Retrieve logs
This guide shows you how to retrieve logs.
As with any programming language, sometimes there are crashes. It is important to retrieve that infromation so that one can understand the root cause of the error.
Retrieve docker container logs
If you run Deephaven in detached mode, all the container information is present in the background. To see that information, access it via the docker logs command.
Replace <CONTAINER> with the name of your server:
Note
If you do not know the name of your container, use the following command in your terminal to show all running containers:
It is useful to redirect the logs to a file for easy searchability. To do this, use > for standard output and >& for standard error.
SIGSEGV error
One of the most common crashes involves the JVM. This results in a SIGSEGV error.
When this error occurs, the server Docker container will generate a log. To retrieve that log from the Docker container to your local machine, copy the file. The container needs to be running to copy the log file.
Replace <SERVER_CONTAINER> with the name of your server:
Note
If you do not know the name of your server container, run:
Debug log
You can fine-tune the level of logging inside Deephaven. For more detailed logs from the JVM, edit the docker-compose.yml file to include the extra flag:
Command history
Deephaven provides a record of all the commands that have been executed, as well as how long each command took or if an error occured. This information is available in the Command History panel, which is searchable.

Hover over the command for more information.
The command in the image below was successful and took one second.

The command in this example, however, resulted in an error after three seconds.

Export browser logs
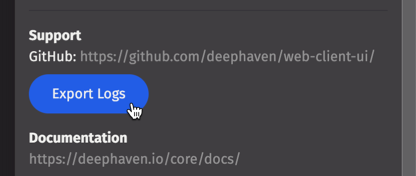
You can export your logs to send to the Community support team. In User Settings, the Export Logs button will download a zip file of your logs:

Access browser logs
If you encounter an issue with the UI during your Deephaven web session, looking at your browser logs can help diagnose the issue.
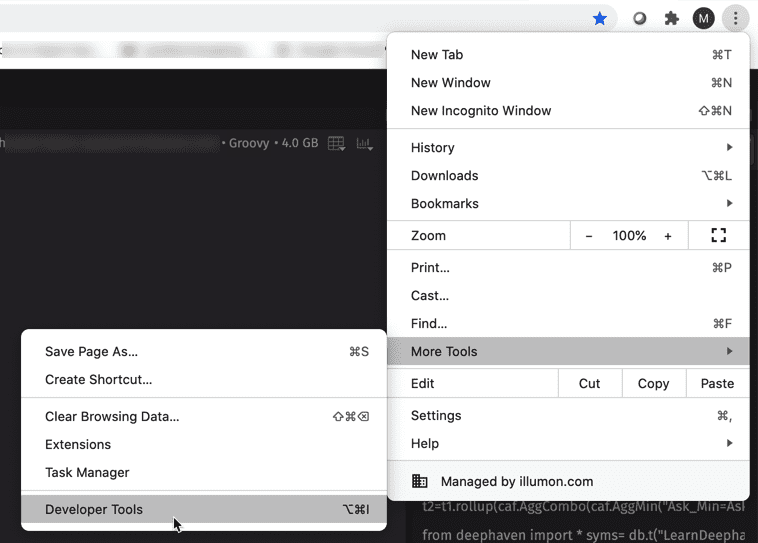
To access browser logs in Chrome, click the Controls menu and choose More Tools > Developer Tools.
Click the Console tab. This is where known issues will be logged.

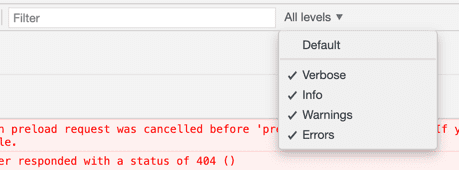
Next to the Filter field, we recommend selecting all levels:
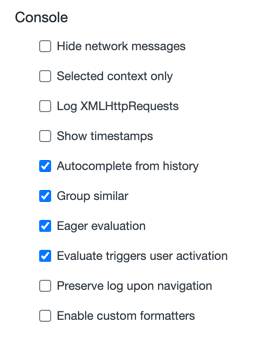
You can also adjust the following settings to capture more detailed information in the logs. In the DevTools Controls menu, choose More Tools > Settings:
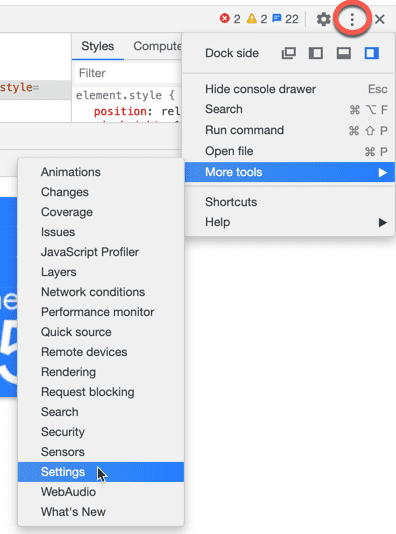
Under Console, you can choose to Log XMLHttpRequests, Show timestamps, etc.:
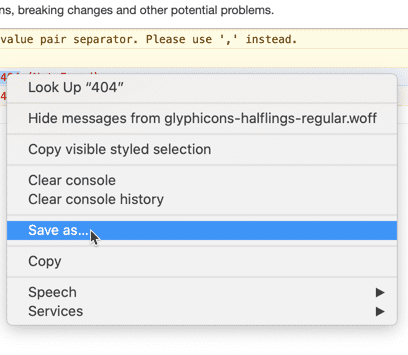
To send the browser logs to support, right-click within the Console to save the file.
Get more help
You can also get help by asking questions in our GitHub Discussions forum or join our Slack Community.