Finding errors
Persistent query processes record their activity and state in the ProcessEventLog and the PersistentQueryStateLog tables. When errors or exceptions occur, these tables can be queried to find error messages or queries that have failed.
Note
See: Internal tables
Querying the PersistentQueryStateLog table
The PersistentQueryStateLog is updated every time a persistent query changes state, and can be used to see both the current state of any persistent query as well as all the historical states. The status of failed queries could be:
- Failed: The persistent query failed before or during initialization.
- Error: An error occurred after the query was initialized (e.g., processing incremental updates)
- Disconnected: The worker process disconnected from the dispatcher. Often this results from a problem that terminates the JVM without giving the worker a chance to notify the dispatcher (e.g.,
OutOfMemoryErroror hotspot errors in native code).
The following example shows all times a persistent query entered a failure state on the current date:
Adding a lastBy call to the query shows the most recent state of any persistent query that attempted to start on the current date:
Combining the above queries indicates which persistent queries are in a failed state today:
Querying the ProcessEventLog table
To find all FATAL Level messages in the ProcessEventLog, the following query can be used:
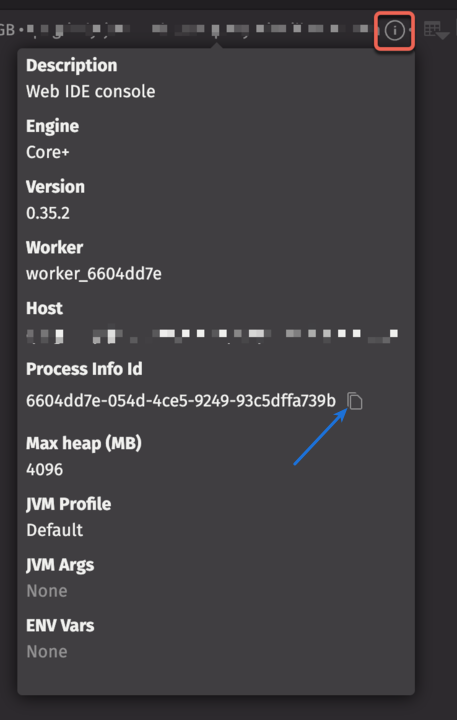
To find specific errors or error messages, use the Process Info Id to query the ProcessEventLog:
The Process Info ID can be found by hovering over the Info button in the console, and the worker's name includes a prefix of the ProcessInfoId:
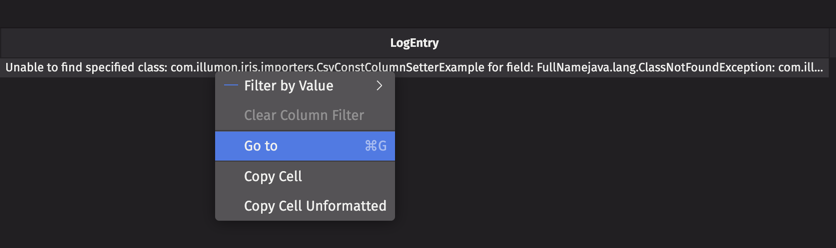
Hold your mouse over LogEntry and click on the View full contents button that appears to view the full exception message and stack trace from the results of the query.

To search for results in the LogEntry column, we recommend using the Go to feature, which you can access by right-clicking a cell or using the keyboard shortcut Cmd+G:
Viewing Persistent Query Exceptions in the Console
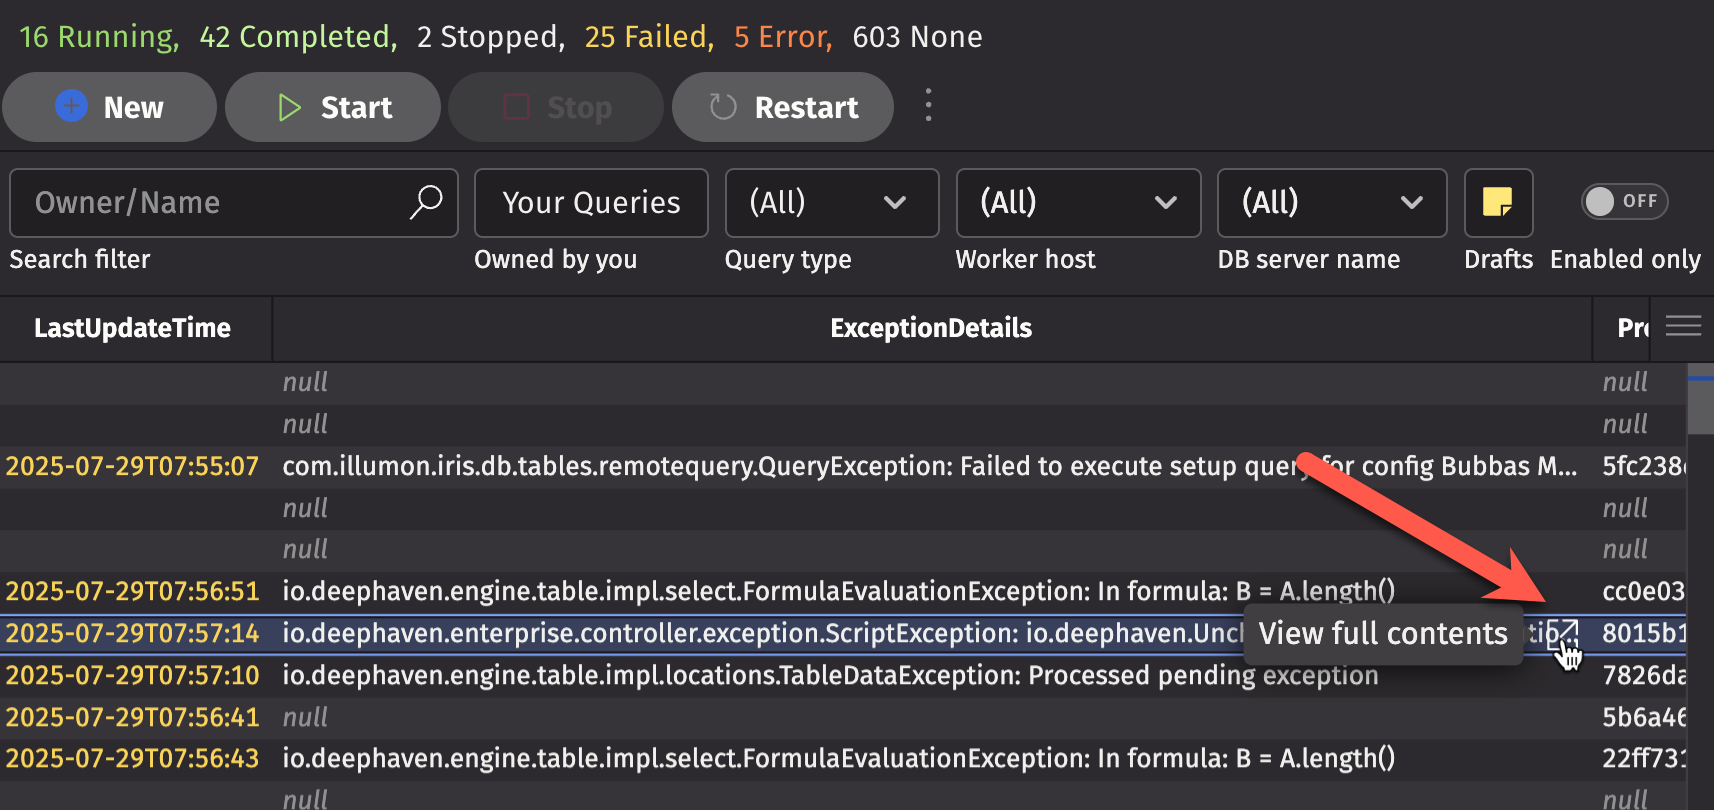
When a persistent query fails with a Java exception, you can view the exception message and stack trace in the Deephaven console.
To view the exception message, open the Query Config panel or Query Monitor. Hover the mouse over the ExceptionDetails column, then click on the View full contents button that appears: