The best thing about a CSV file is that it is a simple text format; the worst thing about a CSV file is that it is a simple text format. Thus describes the love-hate relationship I often find myself in while working with external datasets. "To CSV, or not to CSV", that is the question.
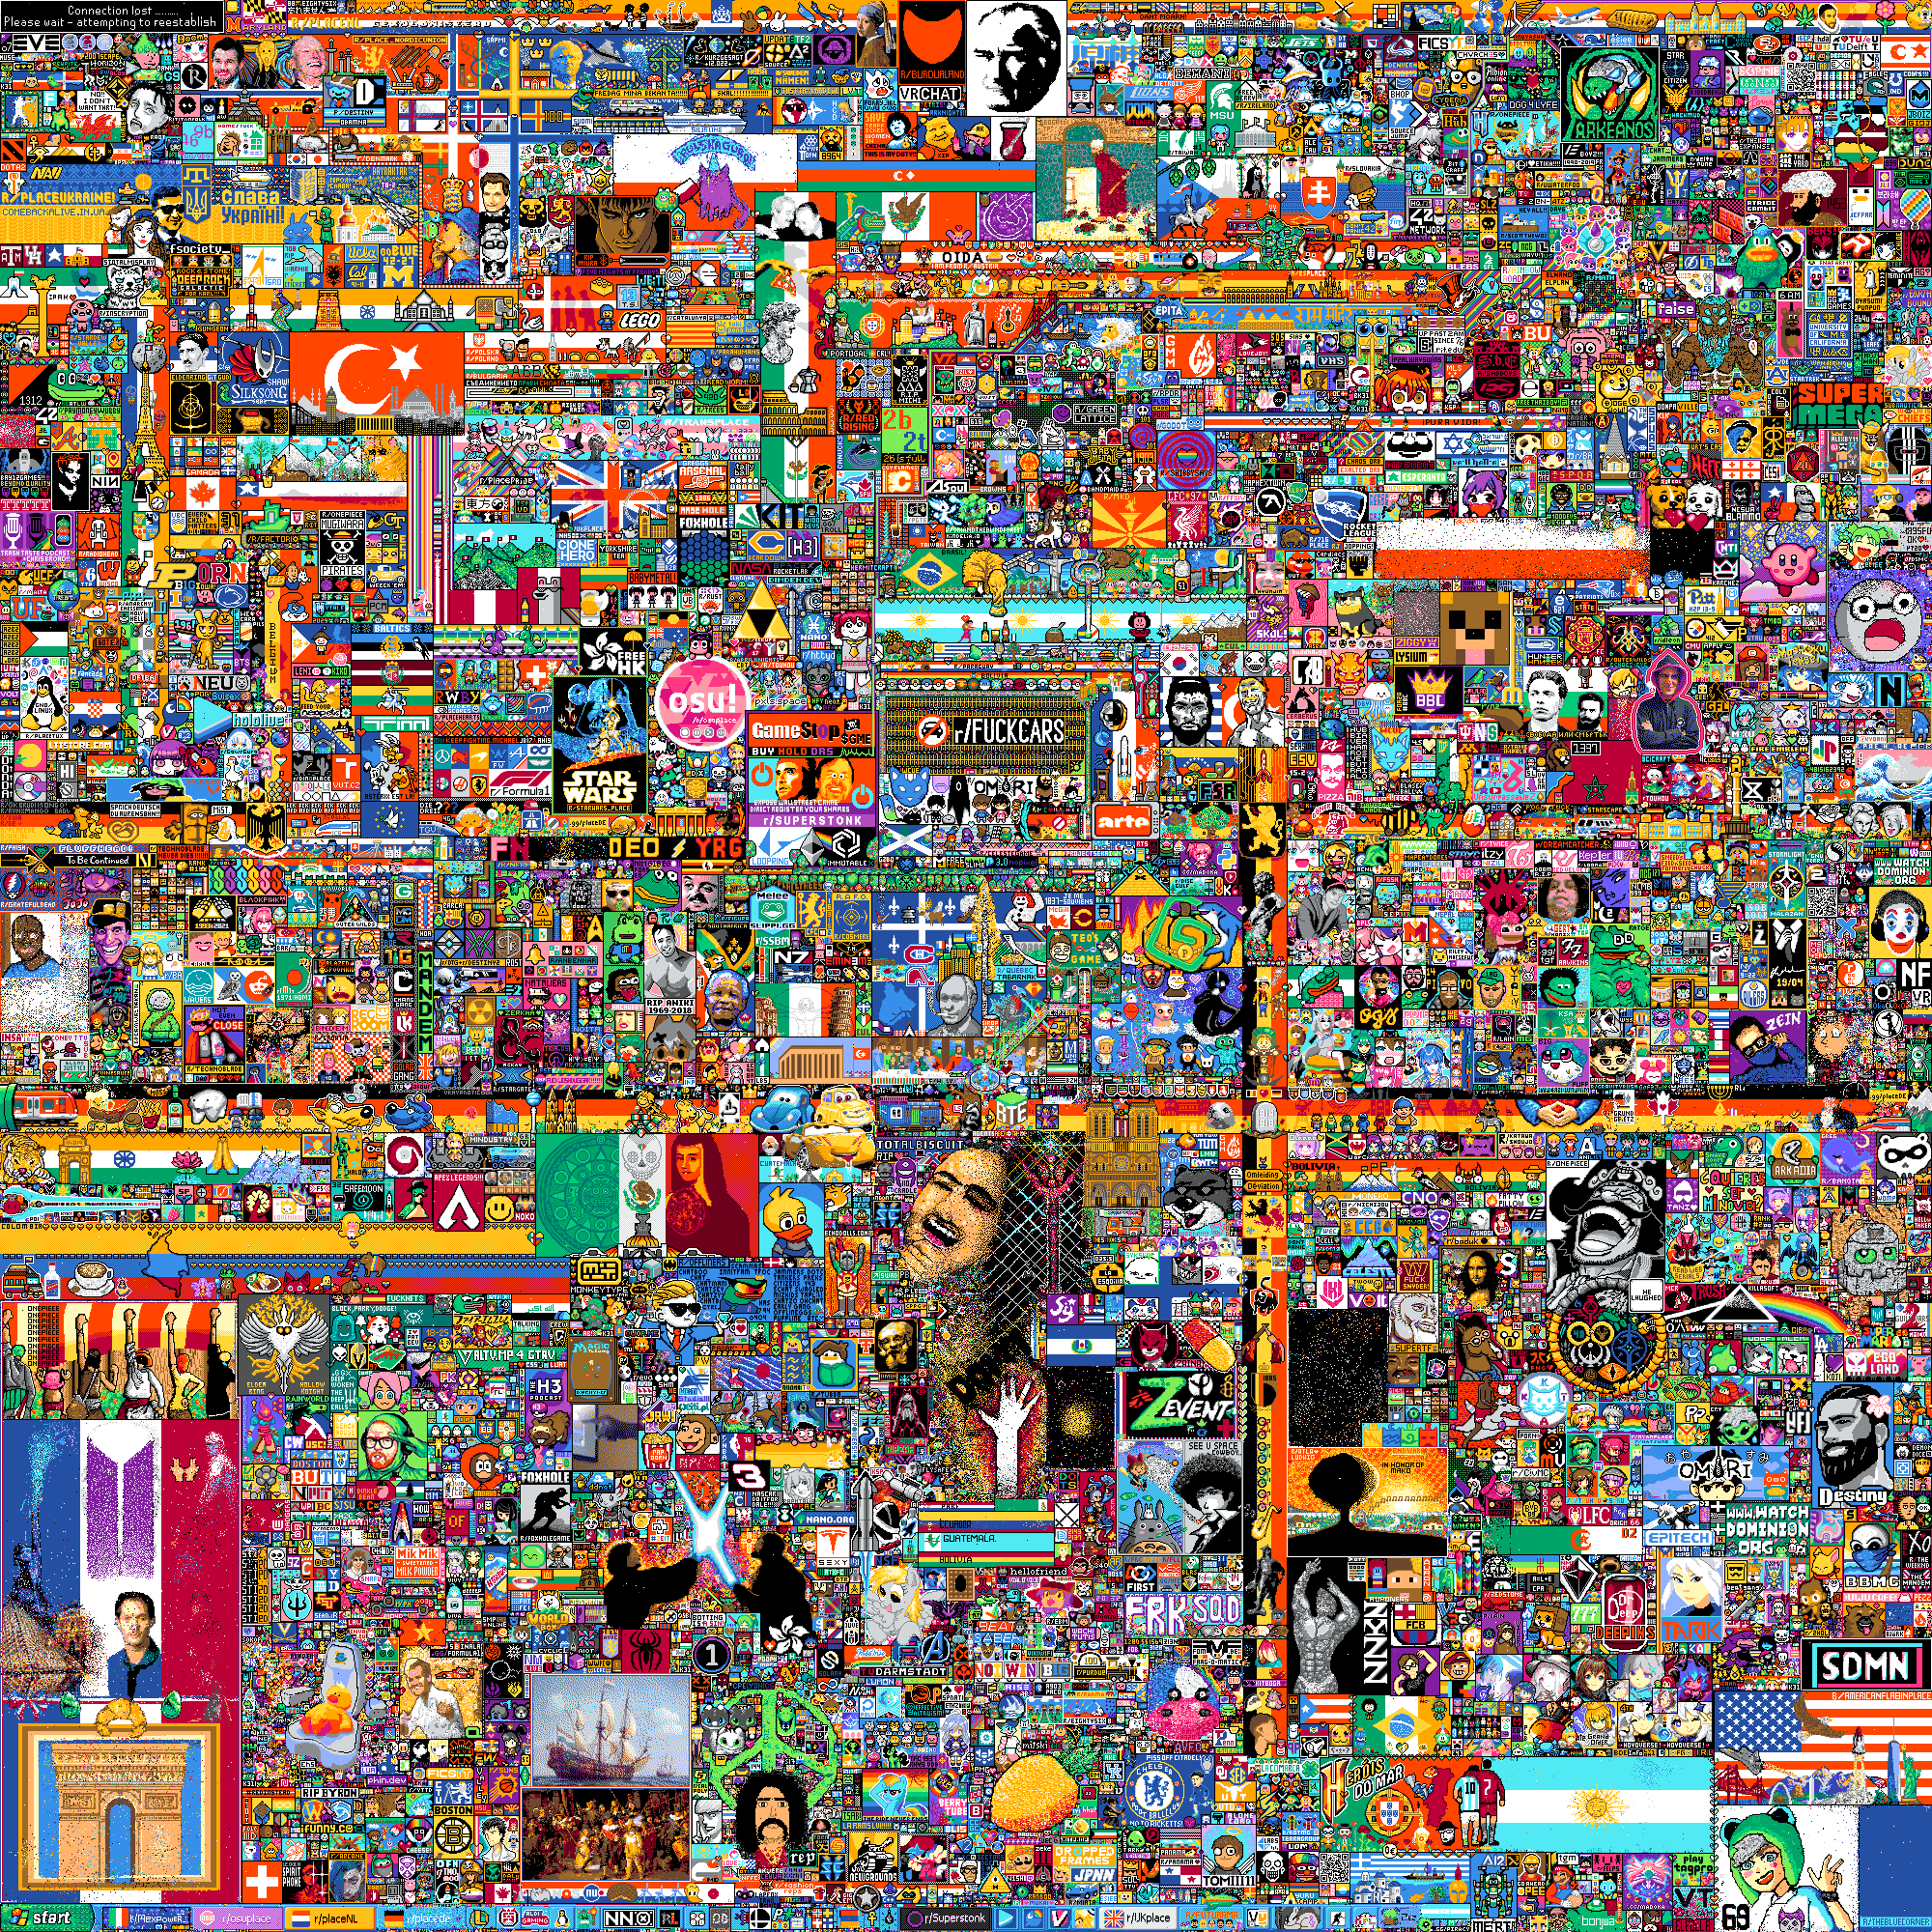
If you haven't seen it yet, r/place had a recent revival - a social experiment where millions of users cooperated, or competed, to carve out pixels on a shared artistic canvas. There are a lot of interesting stories here - but the one I'm focusing on is the public dataset they have released 2022_place_canvas_history.csv.gzip. It contains the timestamps, user ids, colors, and locations of every single pixel placement. Downloader beware - the compressed CSV file is 12GB, and the uncompressed CSV file is 22GB.
While this CSV is a good jumping off point for reading the data once, it is less than ideal to work with for repeated analyses in its raw form. Enter Parquet: a binary columnar format with types and built-in support for compression.
Translating the data from CSV to Parquet is relatively easy within a Deephaven session:
But we can do even better by cleaning up some of the data first:
- Using numeric ids instead of large strings for
user_id - Translating the hex
pixel_colorto an intrgbcolumn - Breaking out
coordinatetox1,y1,x2, andy2columns 1 - Sorting the data based on
timestamp
The full code can be found at place_csv_to_parquet.py.
The result is a 1.5GB Parquet file ready for further data analysis. If you are in a Deephaven session, you can read the Parquet file with:
We've also put this data on Kaggle. Let us know if there's anything you'd like to see!
Footnotes
-
The
x2andy2are only present on r/place moderation edits where a rectangle was placed over questionable content. ↩

