Predicting MSTR Stock Price using Bitcoin - a Simple Model
Intern day 2: Linear Regression
June 29 2022

.jpg "DALL·E prompt: plot chart with two series in the plot, floating hologram UI, film still by Spike Jonze Her (2013)")
As an intern here at Deephaven, I've been documenting my journey as I learn to use Deephaven Community Core. So far, I've explored the basics with a simple analysis project. Next, I'll put my knowledge to the test using Deephaven to analyze a real-world event.
I've been working on a project analyzing a very big financial topic right now, MicroStrategy's purchase of Bitcoin. If you haven't heard, a company named MicroStrategy took out a $205 million Bitcoin-backed loan. They intended to purchase a large amount of additional Bitcoin to protect their earnings from inflation. In my project, I wanted to analyze the relationship between several companies' stock prices and the price of Bitcoin. As part of this analysis, I explored using Bitcoin as a predictor of MicroStrategy's stock price.
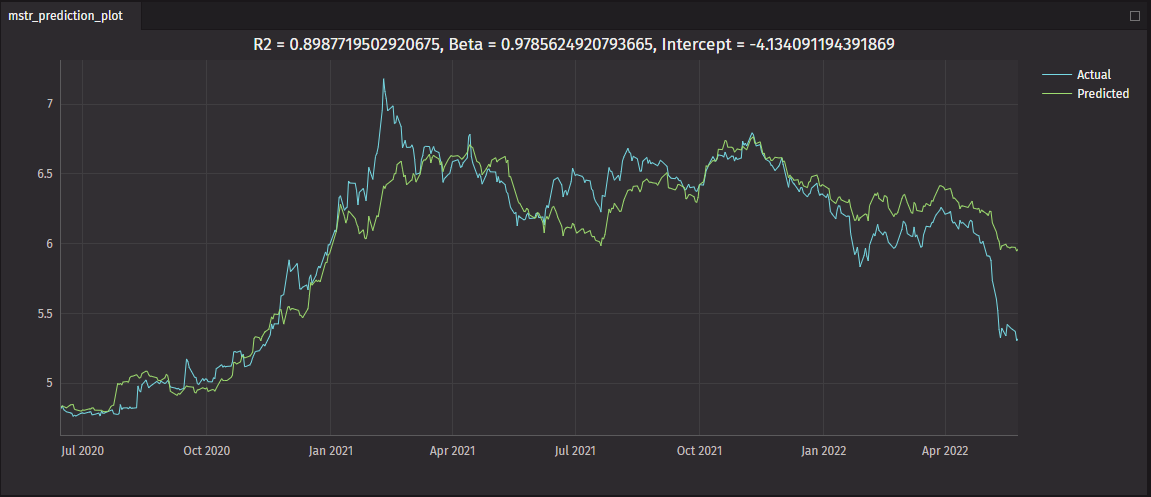
Accurate predictions can be used to guide your decisions and to gain an understanding of the relationships between different variables. During my analysis, I found there was a linear relationship between the securities, so I decided to use a very common prediction method, linear regression, to see if I could create an accurate price prediction. Using Deephaven and NumPy, I created this linear regression based on historical data. I then used this regression to create a historical prediction plot for Microstrategy.
This part of my project has opened my eyes to the number of tools Deephaven and NumPy provide, which was very helpful in my journey. This duo made my data analysis quick and easy, and there's plenty of documentation to help with more advanced use cases. While this is only a static example, the same code can be used on real-time data, so I can seamlessly transition to working with real-time data on future projects.
So how did I end up making that graph?
Low difficulty stock price prediction
To begin predicting stock prices, I first pulled some historical stock price data from Yahoo Finance. After doing some quick cleaning up of the code, I created a table that had both Bitcoin's and Microstrategy's daily prices.
Now I could start creating my linear regression. Using NumPy's polynomial package, it is easy to define the linear regression calculation. A quick search on NumPy's website brings you to the polyfit documentation, which gives all the code necessary to calculate any regression. The only complication was finding the coefficient of determination, which helps judge how accurate any regression is. Some simple math, and I was good to go:
With my new linear regression, the only thing that was left to do was to see it in action. I created a graph that showed both the predicted price from the regression and the actual price.
Predicting the world
Microstrategy's decision to buy such a large amount of Bitcoin has caused them to inherit a lot of volatility, which raises many concerns about the long-term stability of this plan. The uncertain price of Bitcoin holds a major influence on the company's assets, and time will only tell if it was a smart decision. Relationships like this are important to create accurate predictions, and plots are very helpful in discovering these relationships. Being able to leverage Deephaven and its ability to integrate with many different libraries like NumPy made this project very easy. Plus, Deephaven can take on both static and real-time data, which makes its abilities even more convenient. If accurate predictions are what you're looking for, Deephaven has the right tools for the job.
Don't believe me? Be sure to check out our examples or reach out to us on Slack to learn more!