Yogi Berra’s right: “It’s tough to make predictions, especially about the future.”
To win MLB’s fantasy game Beat-the-Streak(“BTS”), you have to do precisely that.
$5.6 million is yours if you can correctly identify an MLB-player that will get a hit in the next game...57 times in a row.
Last week we hinted at, then more overtly described some specifics related to our goal to battle BTS this summer. My good friend, Paul, and I intend to build models and experiences to help everyone make well-informed BTS predictions, deliver web interfaces to help us all track the action, and create real-time simulators of what real-time play would look like. Should be fun.
Paul and I are starting out as rookies in creating baseball prediction infrastructure generally, and forecasting MLB hit percentages specifically. Accordingly, we started to get our feet wet with some observations of history.
First, we have to define a few key terms:
- GWH: Game-with-Hit. For any starting player in any game, this is a 1 or a 0.
- GWHP: Our pronunciation: “G-Whip” (not to be confused with the pitching stat WHIP). This is Game-with-Hit-Percentage, a simple ratio: GWH / Games-Started. (We'll focus on hitters in the starting line-up so these stats only include games where the player started the game.)
- PAA: Plate Appearance Average, calculated as Hits / Plate Appearance. (Again, only for games the player started in, because who cares how they did if they didn’t start? We would never pick them for BTS.)
Winning BTS relates only to predicting a “1” in GWH for your chosen player. GWHP and PAA are obviously relevant, though.
Surveying the basics
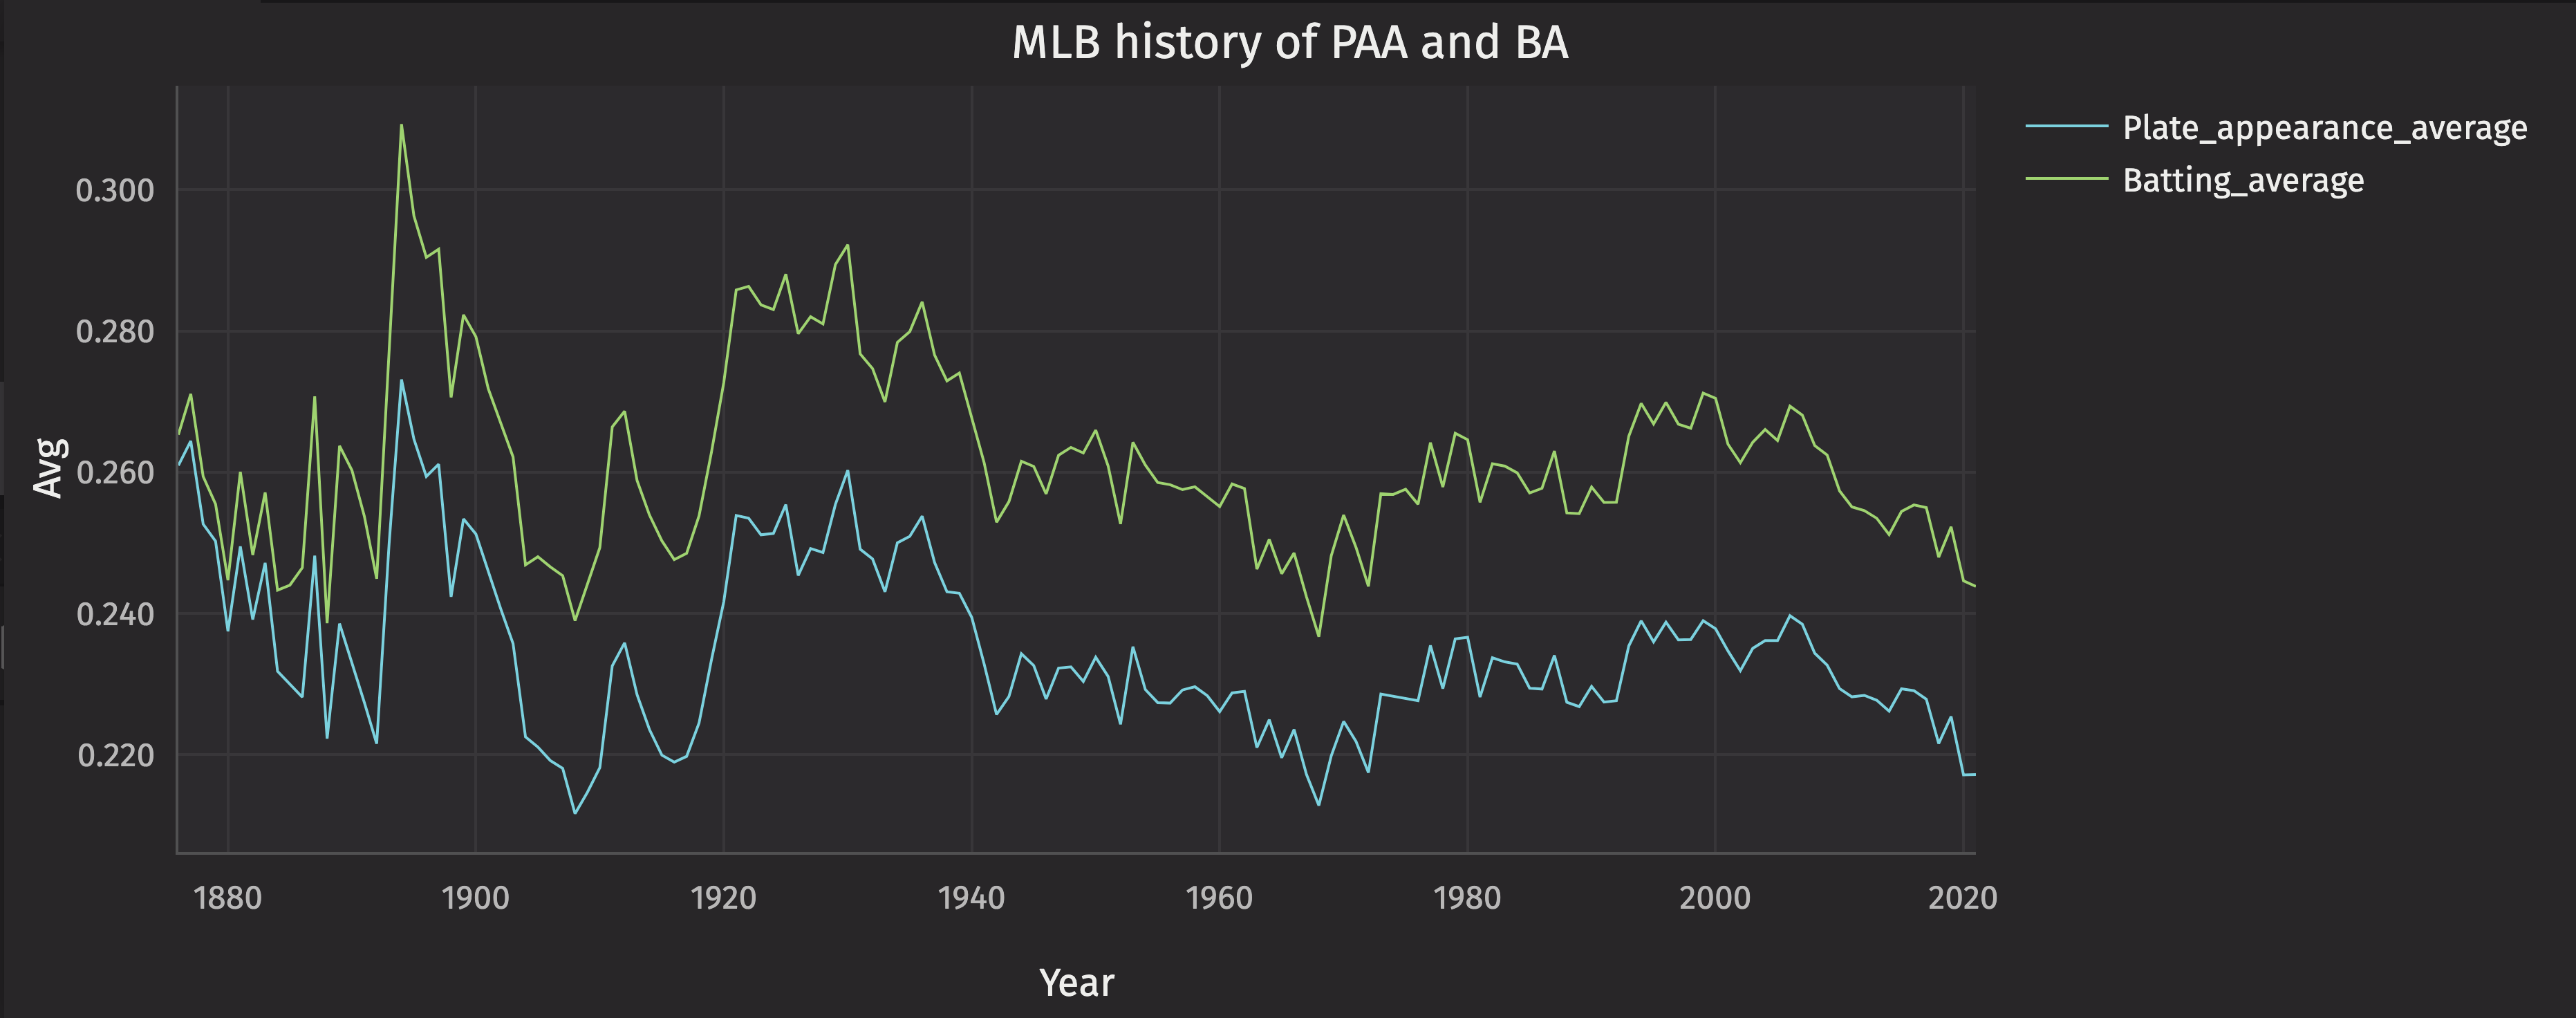
This is a line plot of PAA and BA since the beginning of MLB. As you can see, since 2006, hitting has been on a downward trend, making this game even tougher.
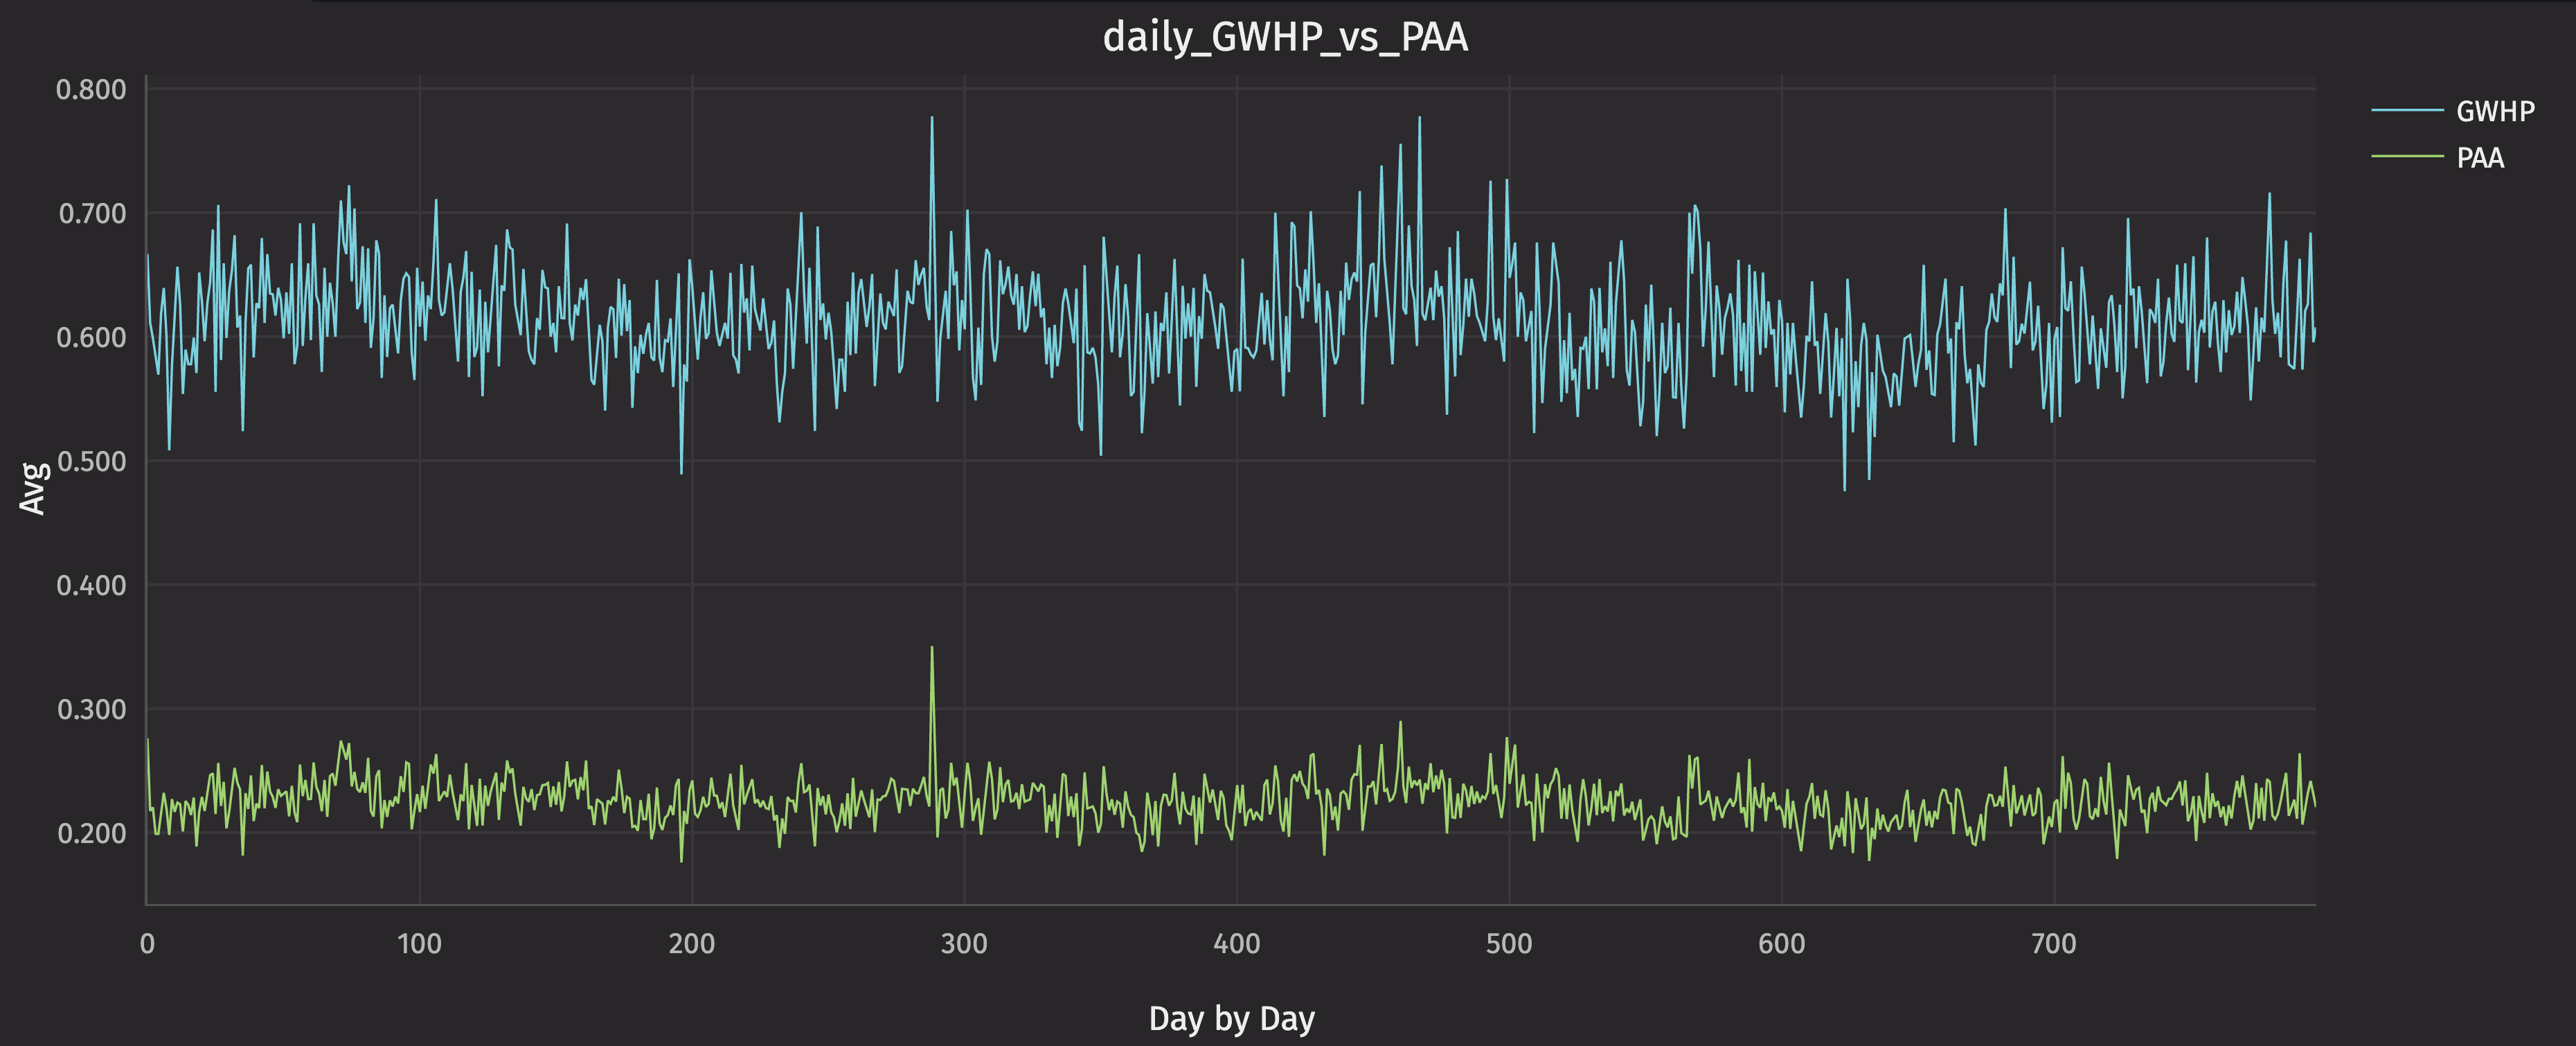
Below is a history of daily GWHP and PAA for the league for the last 5 years.
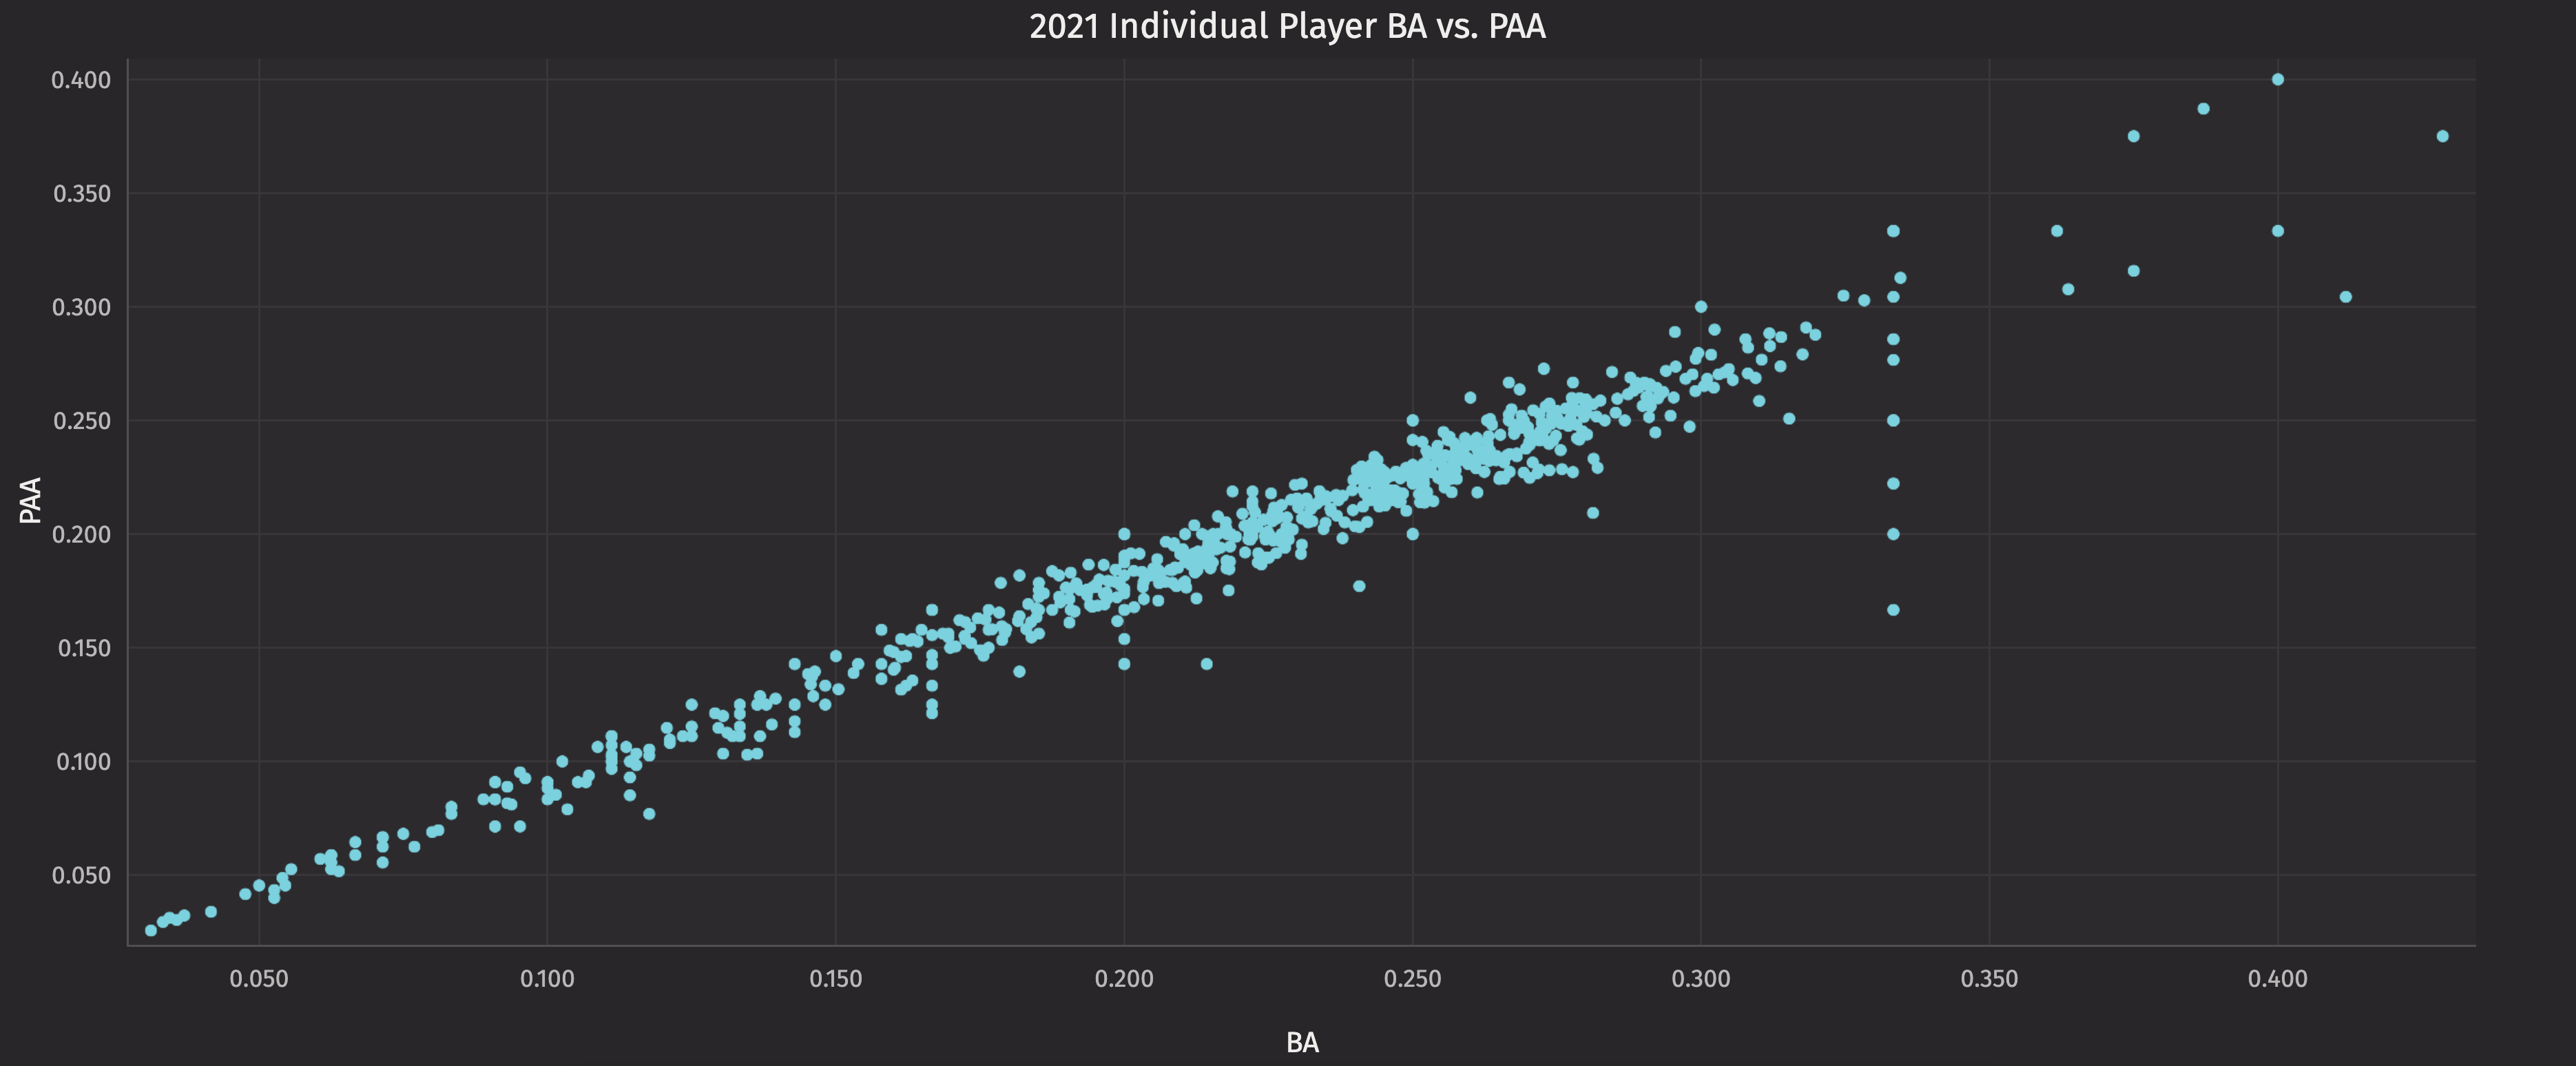
PAA and BA are very correlated, as can be seen below looking at a long history of the MLB, or even looking player by player last year. The r-squared of the scatter plot is 0.966.
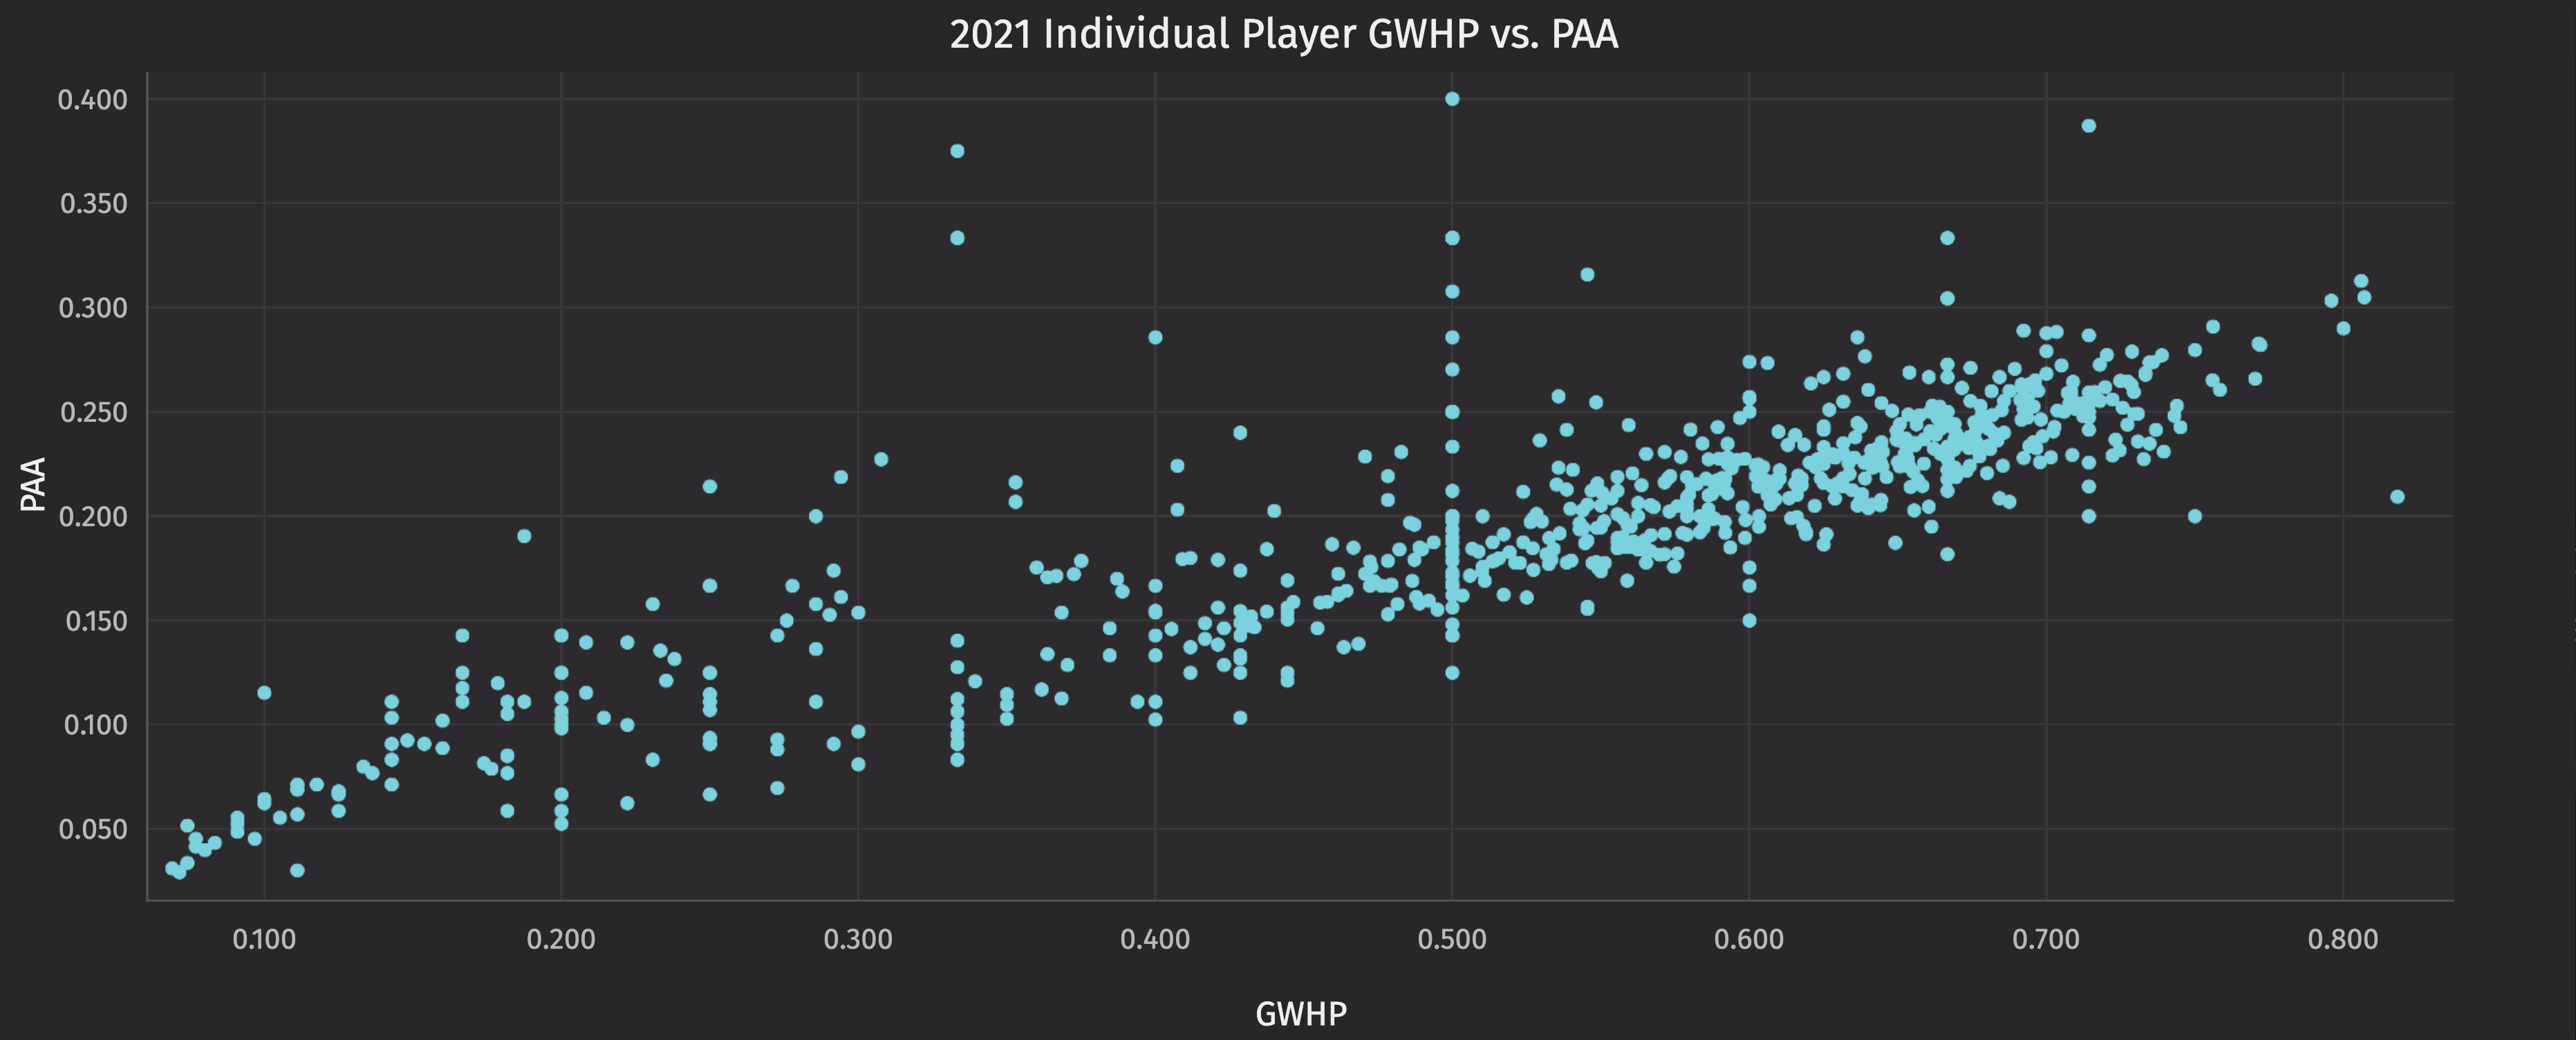
PAA is somewhat correlated with GWHP, player-by-player, as seen in the r-squared of 0.583. This is because a player can go many games with a single hit, or a few with multiple hits. Both these players will have the same PAA with a very different GWHP, resulting in a lower r-squared. This gets a little muddy because the number of plate appearances a player gets in a game has material impact here.
Since PAA is important, and since walks are a bad outcome (quite in contrast to how baseball people value them for the actual game), it seemed to make sense to look at PAA related to the count prior to the pitch being thrown. For example, if the count is 1-1, what is the probability of a hit in this plate appearance? Incorporating this pitch and all subsequent pitches in the plate appearance (this would be really cool if you could follow along with this live, like the game win percentage in the MLB app).
Again, let’s look at the results for 2021:
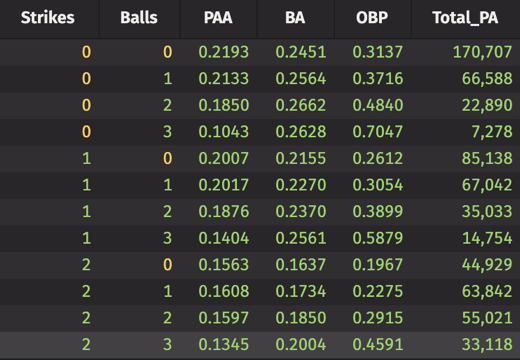
Stats by count
As you know, you’re likely to get more at-bats if you are at the top of the batting order. The statistics bear out that home versus away matters, too, as the visitors are always assured to get 9 innings of plate appearances.

Home-field advantage?
The best
Finding the top GWHP performers over the course of a season isn’t likely to help you win BTS, unless one of them actually eclipses DiMaggio in real life. Though their achievement is likely mostly related to “ya know, they’re just good”, there may be something systematic to learn about these hitters’ success in regards to GWHs. Here are last year’s top 10 performers:

2021's top 10 performers
Prediction, not observation
Picking winners is harder than just keeping score. With analytics like the above in hand, we’ll spend the next few weeks trying to create models that can help you make granularly informed BTS picks. Here's our approach:
- Replicate the models developed by others that have spent time on this; for example, the majority of these models consider stadium characteristics, position in the lineup, and batting stats as helpful signals to identify players that will get a hit in a game. We’ll make heavy use of Monte Carlo methods here.
- Extend the research to consider other factors, in particular those that relate to Statcast data now readily available. Our general hypothesis is that a hitter’s confidence and state of play demonstrated pitch-by-pitch over the last couple games is important to understand.
- Build infrastructure to simulate a BTS league where tens or hundreds of thousands of players are making daily selections and tracking their players – and the league’s progress – pitch-by-pitch.
That’s the plan. Mike Tyson famously said, “Everyone has a plan until they get punched in the face.” Let’s hope we can avoid Rougned Odor.

