Analyzing live, streaming computer vision data
Avengers Facial Recognition, the Sequel: data visualization
July 15 2022


In my previous blog post, I created a simple, 3-step process for ingesting streaming data and performing face recognition live. I pointed my webcam at the Avengers: Endgame movie to show how my face recognition script identified each of the main characters and assessed the relationships among them. Now, as promised, I'll dive more deeply into how we can play with this data in the Deephaven IDE. I focus primarily on real-time plotting, creating a set of charts that update as my data streams in.
As a refresher, here is the table and three graphs I produced in the first blog:
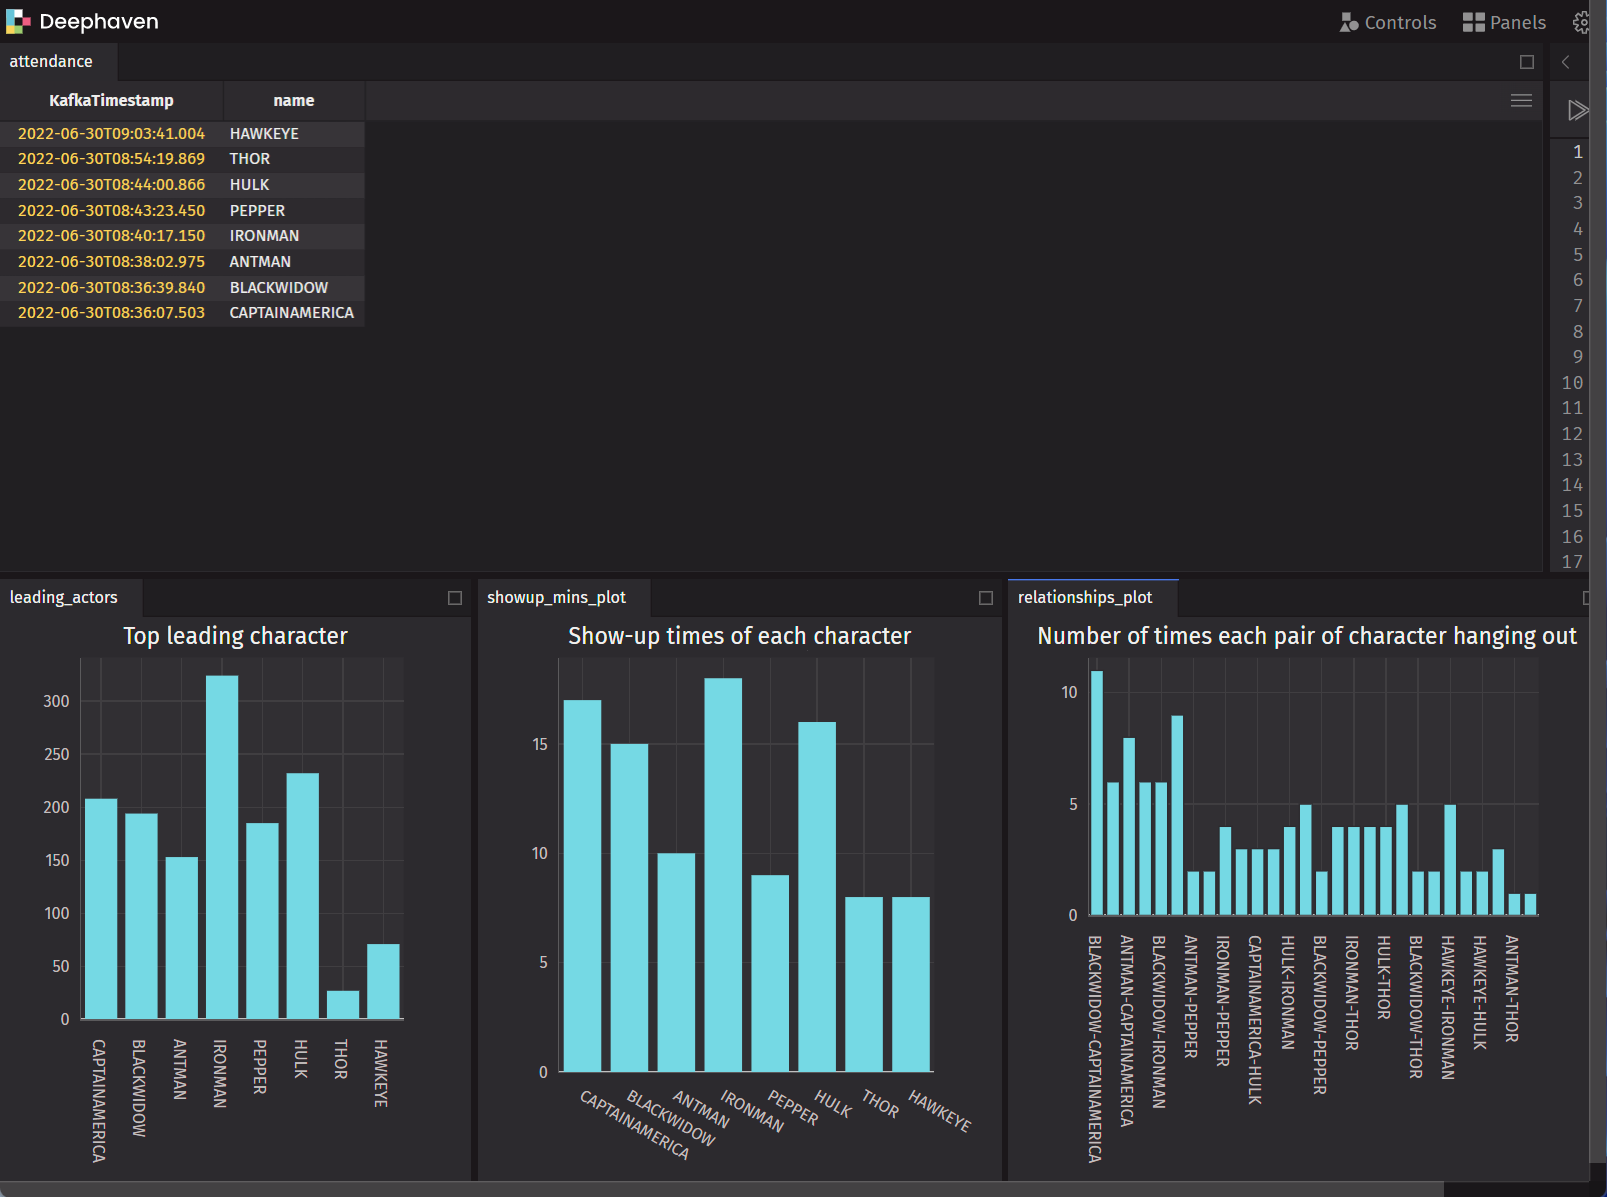
First appearance
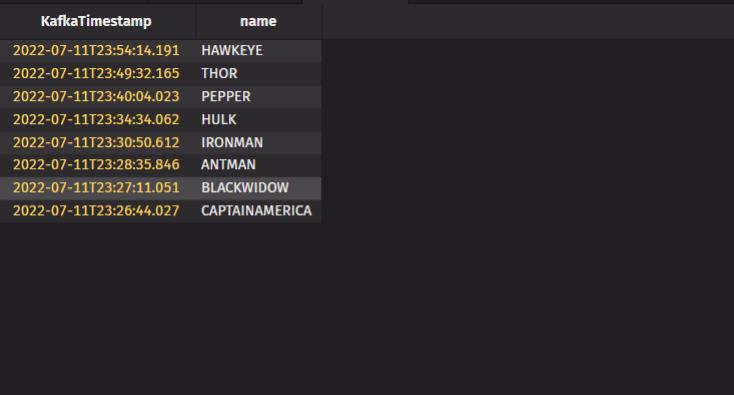
This table records the first appearance of each main character in real time. One line of code creats the table, then I reversed the table so that new rows are appended to the top of the table for better visualization. (Tip: you can also do this in the UI by right-clicking the table data and selecting Reverse.) Doing this programmatically is simple:
Leading characters
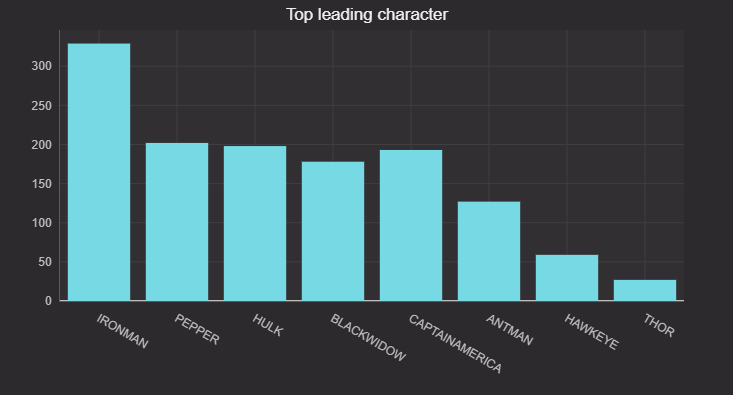
This graph compares the total appearance times of all the main characters. We simply count the total appearance of each character and plot a histogram to demonstrate how this count changes as the movie plays. It's straightforward to do table operations such as count and sort in Deephaven. And by simply passing the table to figure creates a dynamic plot.
Here's the code:
First appearance of each character
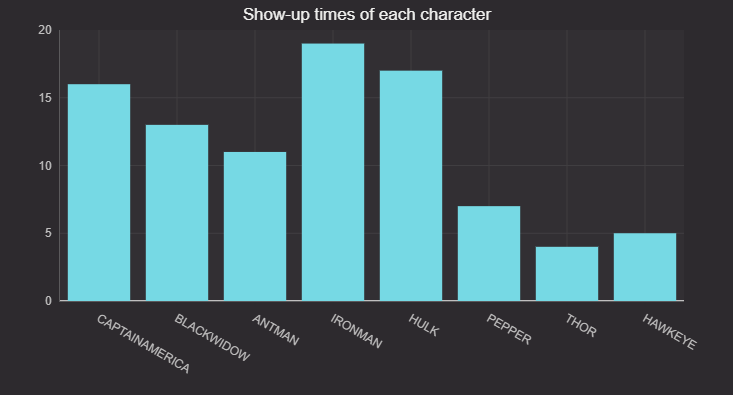
This graph shows the minute at which each main character in the movie shows up. We first group the data by minutes, then count number of minute each character shows up. This gives us a rough estimate on how long each character appears on the screen. As the code shows, grouping based on time is easy in Deephaven with just a single line of code. Feel free to try 5 or 10 second intervals to see if you can get more accurate results.
The code:
Dynamic duos
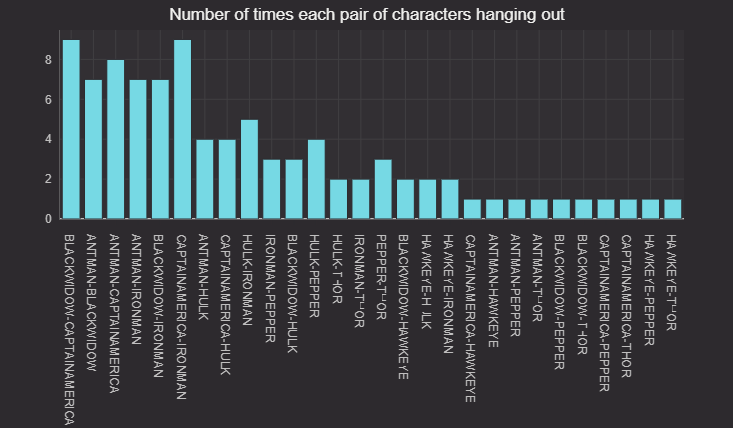
The graph tracks which characters appear together more often than the others. Here, I'm basically tracking relationships between characters.
After grouping the data by minutes, we pair all the characters in each minute, then count how many minutes they show up together. It helps us understand which two characters appear together more often than others. You can also try to group the data by 30 or 40 seconds to see if the relationship still holds.
The code:
Try it out
Please check out our deephaven-examples repo on GitHub to see detailed documentation on how we accomplish the analysis or contact us on Slack if you have any questions or feedback.