Bring data to life: real-time visualizations
Visualize Twitter data with Deephaven's Matplotlib plugin
July 29 2022


Real-time data is the lifeblood of our modern world. Many aspects of our lives are defined by the phrase "right here, right now". It’s more important than ever that you can quickly analyze and understand what data is telling you, so you can make informed decisions. Plots are crucial in this process.
Deephaven is known for its live, streaming tables. Live updating plots are a natural pairing. With the Matplotlib plugin, you can easily build data-streaming charts with a tool you already know and love.
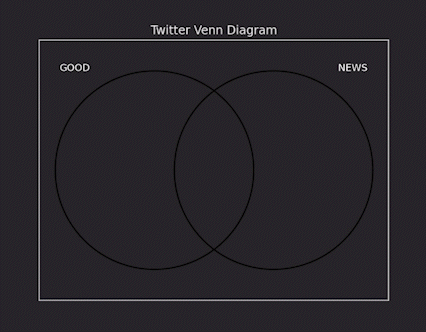
An example Venn diagram connecting two keywords from Twitter data
In this blog post, we'll use the Twitter Streaming API to collect tweets in real time and build a bunch of interesting real-time charts. Let’s dive in!
Note
Free access to the Twitter API is no longer available. However, the code and concepts in this blog are still valid for users with a paid developer account.
Collect Twitter streaming data
First of all, we need to create a Twitter Developer account to obtain an access token. In our example, we use the Twitter API to get tweets containing the word "news".
Click to see the code!
We perform some simple processing on the coming tweets and put the raw and processed data into a Deephaven table, tweet_table:
Click to see the code!
Also, we create another table to keep track of the word frequency of our tweets:
We can use the existing write_live_data function to write data into count_table:
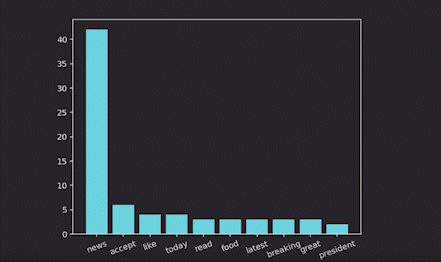
Real-time bar chart
Now let’s visualize the top 10 high-frequency words:
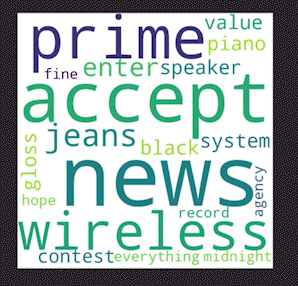
Real-time word cloud
This simple histogram can be very useful to get a first glance at the data. But what if we make this visualization less boring - word clouds a better way to visualize this data, and they're just as informative:
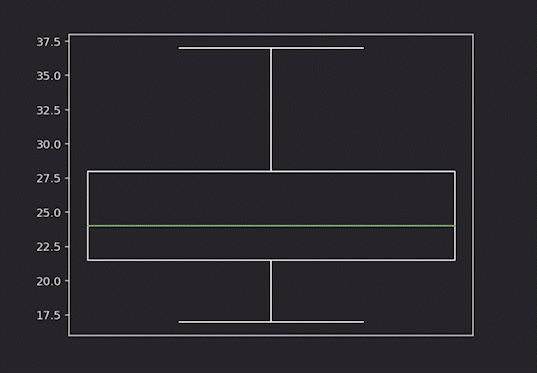
Real-time box plot
Now let’s analyze our tweets by counting the number of words. To do this, we need to update our write_live_data function to have the length variable in our tweet_table table:
The code for building an animated box plot is pretty simple:
Real-time Venn diagram
To demonstrate another type of visualization, let’s build a Venn diagram to explore the relationship between specific words - for example, “good” and “news”. This is a simple example that could be easily expanded to make truly informative and interesting connections between words used in tweets.
We adopted the code from this repository and modified it for real-time data.
Click to see the code!
An animated chart will be rendered as shown below. The circle on the left contains dots that represent tweets with the word 'good' but do not contain 'news'. The circle on the right has messages that contain 'news' but not 'good'. The intersecting area illustrates how many tweets contain both terms used together.
Talk to us
We’ve demonstrated a few examples of real-time streaming charts using Deephaven’s Matplotlib plugin. When it comes to how to display real-time data, the sky is the limit. But we hope this article can be a good starter! Share your ideas on Slack.
If you find any errors or have trouble executing our sample code, click here to download the complete source code of the project we have created for this blog post.