

Deephaven is well-known for its query engine and table API. But it's so much more than just those two things. It's also a fantastic Python IDE and tabular data visualization platform. If you develop Python applications that use Pandas DataFrames, you should use Deephaven to create them. When using Deephaven as a Python IDE, Pandas DataFrames are rendered as a table in the console. You can perform quick filtering on columns, perform downstream operations and visualize results instantly, and find bugs faster than ever before. It's hard to understate the importance of visualizing your tabular data while you process it.
In this blog, I'll tell a story of value gained from Deephaven as a Python IDE while working on an application using baseball data.
Quantitative analysis has taken the driver's seat in the highly competitive world of professional sports. Even activities adjacent to sports, such as fantasy football and the MLB's Beat the Streak, can be won using 100% quantitative reasoning. Despite near-impossible odds, we at Deephaven have set out to finally beat the streak - the MLB's contest, that is. By using machine learning coupled with current baseball data, we aim to be the first to correctly predict hitting success in at least 57 games in a row.
Unfortunately, baseball data notation isn't completely standardized. This article details data in baseball and how we overcame the challenges of dirty data. If there's one thing I hope you take away, it's this:
Seeing your data as you process it will make your life so much easier when bugs occur in your code. Decrease the time you spend as a data janitor and bug fixer by utilizing the best tool for the job.
Baseball data
There are a few different avenues for obtaining baseball data within Python. I use the first on this list in the large gif atop this blog. Here are just a few:
They have their pros and cons, but if you're interested in working with baseball data in Python, you should check all of them out - it's really cool stuff.
Models to predict hits
Baseball is a game noted in particular for the development of sabermetrics, notably portrayed in the 2011 film Moneyball. The story covers the use of data science in the 2002 Oakland Athletics. Despite being a small market team written off by experts before the season started, they won the AL West and went on an unprecedented 20-game win streak during the regular season. A large portion of their success has been attributed to their forward thinking in using objective data analysis and algorithms to run the team, as opposed to the traditional subjective analysis used for much of baseball's history.
We've applied the same thinking to the MLB's Beat the Streak game: Pick a batter that you believe will get a hit on any given day. If you pick correctly 57 times in a row (which would beat Joe DiMaggio's 56-game hit streak in 1941), you win $5.6 million. If you randomly pick any player that gets an at-bat for every day of the contest, you have around a 1 in 4 trillion chance of winning. To put it bluntly, you will never win with that strategy. Even if you make educated picks by looking at lineups, your chances are dismal.
Enter machine learning. There are a few AI models I and others have found that predict who will get a hit on a given day based on a multitude of factors. The purpose of this blog isn't to discuss what each model does or how well it works. Rather, I'll cut to the chase: we at Deephaven have tested Ryan McKenna's approach for the 2021 season and nearly achieved a winning streak in all of our simulations.
We've accomplished this during historical simulations for the 2021 MLB season! But we have our eye on real-time data.
Ryan's models are meant to work on previous seasons. But we at Deephaven want it to work on the current season — we're after that $5.6 million. That's where the story of this blog really starts.
Ryan's models use data specifically sourced from pybaseball and retrosheet. It takes data from these sources, mashes them together using Python's Pandas module, and then writes the output to some pickle files. Thankfully, Ryan made a ZIP file publicly available that contain data for 2010 - 2021. We want this data for the 2022 season as well so that we can use his models on the current season. Thus was born the need to recreate Ryan's pickle files with the aforementioned baseball data sources.
Recreating retrosheet
Ryan's preprocessed baseball data has millions of records for 12 seasons of baseball from 2010 to 2021. The goal is to make that 13 seasons by adding the correctly formatted 2022 data to the end. To do so, we must recreate the manual way of data processing. After examining Ryan's code that puts together the preprocessed pickle files, I realized the source data came from only two sources: pybaseball and retrosheet.
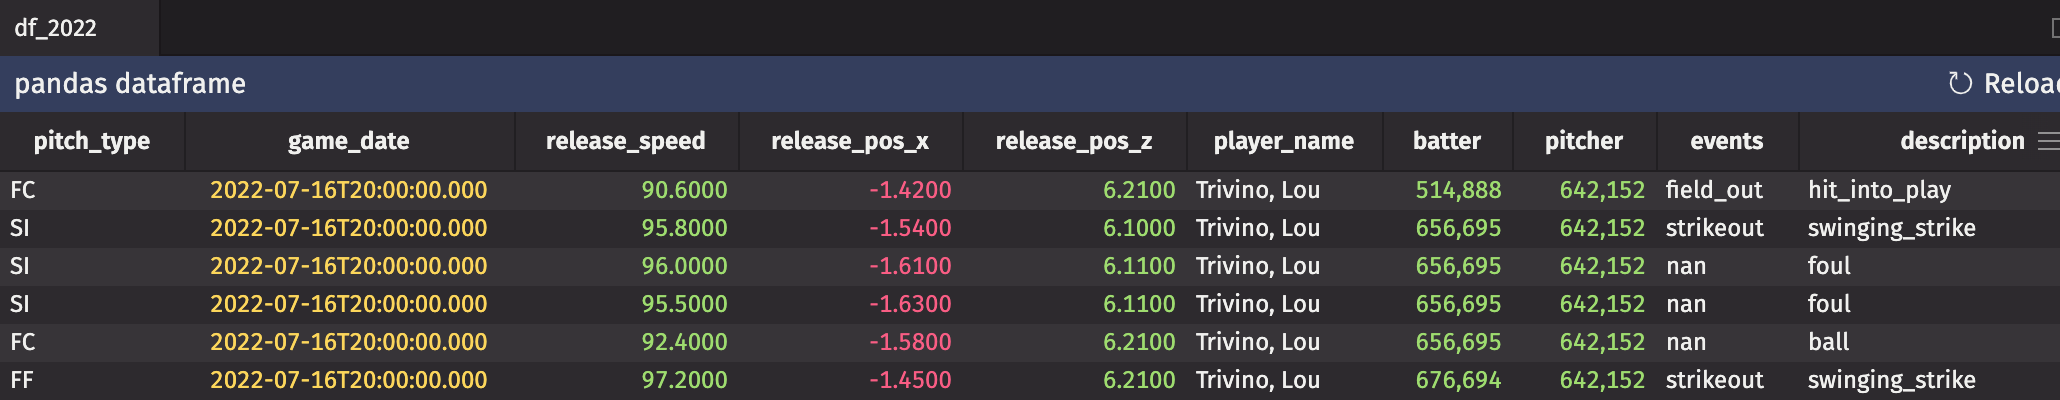
The pybaseball statcast data is easy to recreate. Get the start date for the 2022 MLB season, today's date, import pybaseball, and perform a single function call.
Recreating retrosheet data is not as easy. Unfortunately, Retrosheet doesn't publish its data until the end of each season. Thus, I had to recreate retrosheet for 2022.
Here's a chunk of a singular retrosheet event file for the New York Yankees in 2021:
This is but a small chunk of a single event file, which contains information for every home game in a single season for a single team. A full season's worth of retrosheet data is split into 30 files, with one for each team. The data is split as follows:
- Lines that start with the string
idare the game ID. These correspond to the IDs used for box scores on baseball-reference. For example, here's the boxscore for the game in the retrosheet chunk above. See anything familiar in the URL? - Lines that start with
infohave top-level game related information such as umpires, weather, time, duration, attendance, etc. - Lines that start with
startcontain information on the starting lineup for each team. Each one of these lines has a player's retrosheet ID, full name, home/away (0/1) status, spot in the lineup, and position. The visiting lineup is given first, followed by the home lineup. - Lines that start with
playcontain the play-by-play information for each at-bat in the game. Thankfully, Ryan's models don't use this data so I didn't have to recreate it.
After many hours of work and scouring everywhere I could think for baseball information, I had finally finished the work and recreated retrosheet for every team thus far in 2022 (minus play-by-play info).
Here's a chunk of my 2022 retrosheet (currentsheet?) event file for the New York Yankees:
There are only a few minor differences between my "currentsheet" files and the original retrosheet event files:
- The
wpandlp(winning and losing pitchers) aren't given as their retrosheet IDs, but rather their last name. Ryan's models don't use this data, so that's fine. - In the case of this game, the 1st base umpire's retrosheet ID is wrong. It shouldn't have the apostrophe. Thankfully, Ryan's model only cares who the home plate umpire is, and no home plate umpires have non-alphabetic characters in their names.
- The
oscorerfield contains my very own faux retrosheet ID. Ryan's models don't care who wrote the retrosheet data.
Feeding faux retrosheet data into Ryan's processing code
There's a lot of data in retrosheet event files. When I first fed my currentsheet data into Ryan's code, I got errors that were relatively easy to diagnose. They included:
- Mixing up the precipitation and cloud data (e.g.,
info,precip,cloudyandinfo,sky,none) that confused the model. - Including a typo in the
winddirline.
After removing these two (and one or two others), everything looked in tip-top shape. So, I was pretty frustrated when I got another error. I had the pybaseball statcast data for the all of the correct games, so why wasn't my code working?
Enter Deephaven Community Core
NaNs in Pandas DataFrames
I spent quite some time tracking down bugs in the code (and my faux retrosheet data) only to come up with nothing. When I did all of this work, I did it in a standard Python session from my terminal with no GUI. I could print the data (it's all stored in Pandas DataFrames), but printing a DataFrame will not print all rows and columns if there are too many, and with this stuff, there are a LOT. Even when a DataFrame isn't huge, it's not very pleasant to look at when printed to a console.
I had been doing work with Deephaven for something else entirely, and had finally wrapped that up. I knew exactly which line in Ryan's code produced an error, but had yet to figure out why. So, I spun up Deephaven to have a look at my DataFrames that were being merged.
Here are the side-by-side DataFrames as displayed in Deephaven:
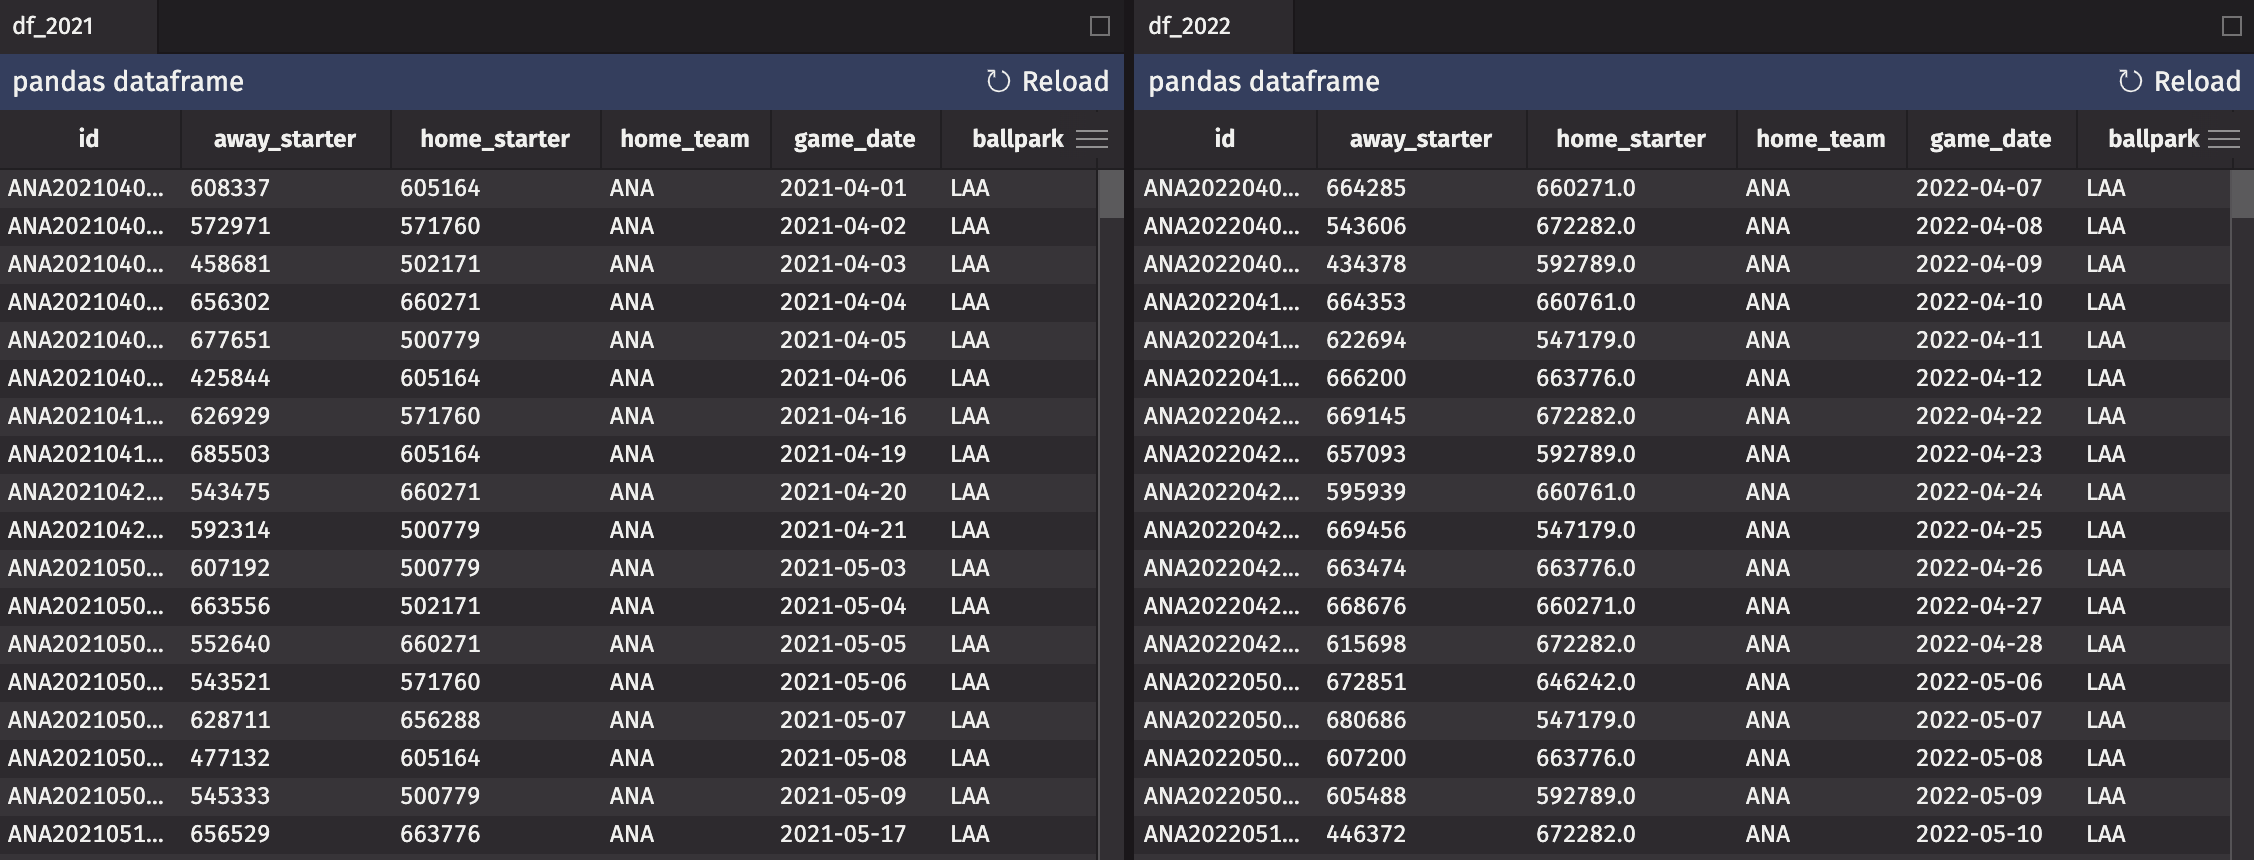
Hmm, looks the same. Or does it?
Notice anything odd? How about that the home_starter column in df_2022 has decimal values instead of integers? The home_starter and away_starter columns should both contain the integer MLBAM ID for the starting pitcher in the game given by the id, date, and ballpark. So why does my 2022 data have decimal values in there? Usually, when a Pandas DataFrame (and a NumPy ndarray) contains floats instead of ints, it's because there's a NaN hidden in the data. Lo and behold:

So, the starting pitcher for the Miami Marlins is causing issues. How come? Well, his name is Max Meyer, and he never played in an MLB game prior to 2022. That means that he does not have a retrosheet player ID, and as such, the code converts that lack of ID to a NaN value in the DataFrame. This is a rather hard-to-find bug with a simple fix.
Another strange bug
That's not where this tale ends. After fixing the Max Meyer issue, I re-ran the code, and now had a column of integers. But now I'm on high alert. So I scroll through the data for 2022, and during the scroll, I notice something:

The starting pitcher for the Boston Red Sox on July 4, 2022 apparently has a -1 for a player ID (hint: that's not a valid player ID). What's happening there? That starting pitcher's name is Austin Davis. And as it turns out, there was once another baseball player named Austin Davis:
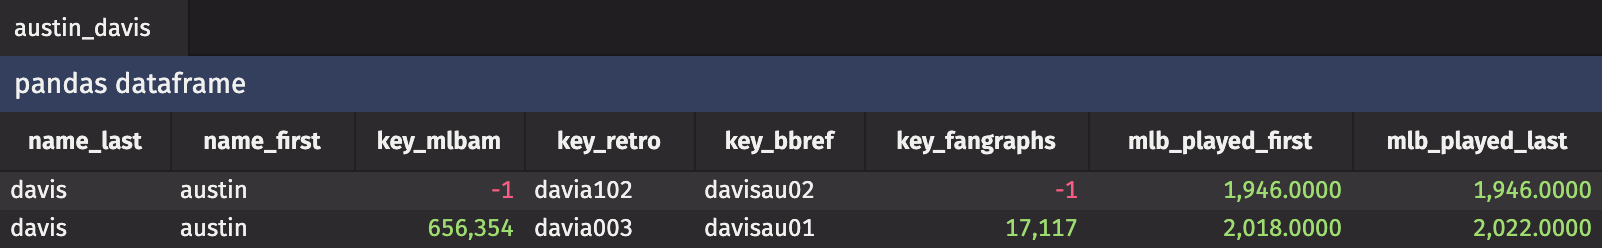
So, I spent HOURS looking for a bug caused by missing data for a second baseman who played for a single game in the 1946 Negro National League II season for the New York Black Yankees. This was me when I realized it:

I do think it's really impressive that retrosheet has information from the Negro leagues before their integration into the MLB. I've always been fascinated by sports history just like I am sports analytics. The positive side of running into this bug is that I got sidetracked reading about the 1946 Negro National League and its World Series.
Conclusion
While AI cannot guarantee that you'll the Beat the Streak, you can flip the odds in your favor. Just like the Oakland Athletics flipped their odds in 2002 using sabermetrics, you too can do so by using deep learning. As you read above, the models are only part of the story - you need to visualize and process your data with care to make accurate predictions.
It's rarely a matter of if gremlins live in your data, but rather a matter of where the gremlins are in your data.
Data scientists, engineers, and analysts alike spend only a small fraction of their time writing code to process data. Most of their time is spent ironing out kinks in code caused by these gremlins. Max Meyer and Austin Davis were the gremlins wreaking havoc in my baseball data. What will the gremlins turn out to be in your next project?
Don't be like me and foolishly think "I don't need to see my data while I work with it." Deephaven is a powerful tool even if you don't use the table API. It can drastically cut down on the time you spend debugging issues due to gremlins in your data.