Building a data quality monitor for CSV pipelines
Part 3 of the CSV Mastery series: Catch problems before they spread
February 24 2026


Remember the taxi dashboard we built in Part 1? It works great — until it doesn't. One day the vendor changes timestamp formats. The next week, fare amounts arrive in cents instead of dollars. Your dashboard shows revenue down 98%, and it takes three days to realize the data was wrong, not the business.
In Part 2, we learned to handle these problems when we know about them upfront. But what about the problems we don't anticipate? What about catching them automatically, the moment they appear?
This is Part 3: building a data quality monitor that watches your CSV pipelines in real time.
The best time to catch a data quality issue is before it enters your analytics pipeline. The second best time is immediately after.
What we're protecting against
In Part 2, we encountered specific failure modes:
- Mixed types — a
user_idcolumn withN/AorPENDINGvalues mixed in. - Timestamp chaos — four different date formats in the same column.
- Encoding drift — files switching from UTF-8 to Latin-1.
- Leading zeros — ZIP codes parsed as integers, turning
01234into1234.
We fixed each with specific CsvSpecs configurations - but those fixes assume you know the problem exists. A proper monitor catches these issues before you've debugged them manually.
Let's build one using the taxi data from Part 1.
Step 1: Establish a baseline from good data
First, load the taxi data from Part 1 and capture what "normal" looks like:
This baseline captures what "normal" looks like — average fares, typical tip ranges, expected row counts. When new data arrives, we compare against these expectations.
Step 2: Define rules for the problems we've seen
Now let's encode validation rules that catch the specific issues from Part 2:
Notice the cents_check rule — this catches the scenario from the intro where a vendor starts sending amounts in cents instead of dollars. If average fare suddenly drops to $0.12, something is wrong.
Step 3: Build real-time validation
Here's where Part 1's key insight pays off: the same code works for static and streaming data. Let's build validation that runs continuously on live taxi data:
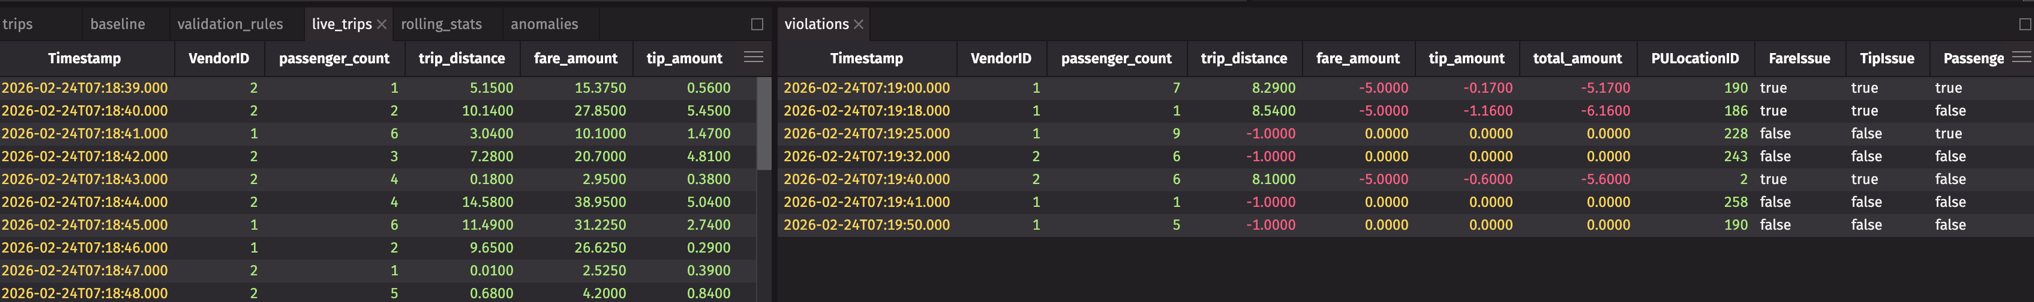
Now violations is a live table that shows only problematic rows — and it updates automatically as new data arrives. This is the real-time monitoring we promised.
Step 4: Detect the cents-to-dollars bug
Remember the intro scenario? A vendor starts sending fares in cents instead of dollars. Here's how to catch that automatically by monitoring aggregate statistics:
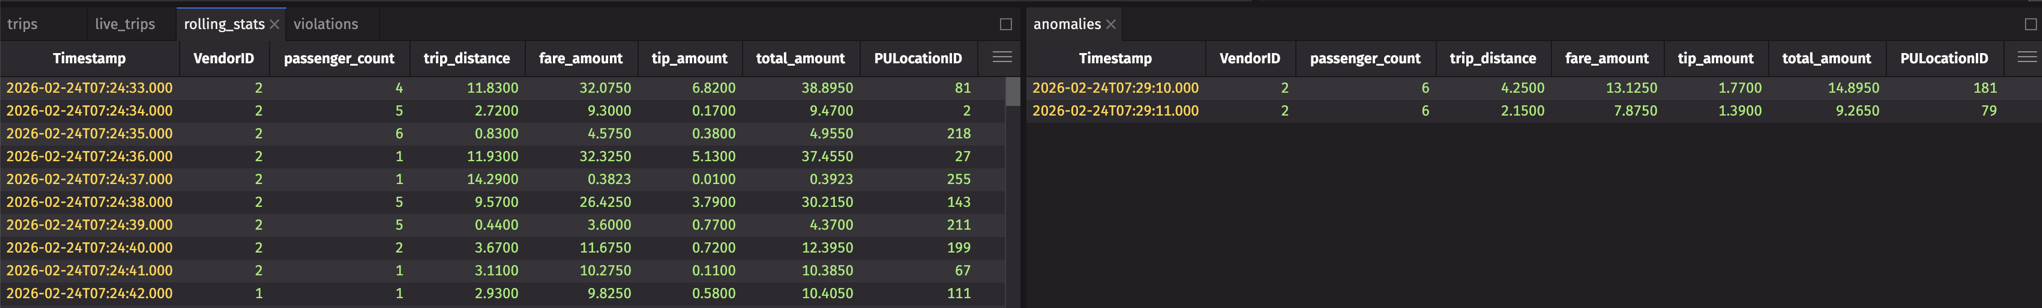
If a vendor suddenly switches to cents, avg_fare_10 will plummet to ~$0.12 instead of ~$12. The anomalies table catches this immediately.
Step 5: Detect schema drift
In Part 2, we saw how columns can change types unexpectedly — a user_id column suddenly containing N/A values. While the previous steps monitor live data, schema drift happens at load time. Here's how to detect it:
This catches exactly the kind of issues we saw in Part 2 — a vendor adding a $ prefix to fares (changing the column from double to string), or adding unexpected columns.
Step 6: Build the monitoring dashboard
Now let's combine everything into a dashboard using deephaven.ui. We'll use ui.dashboard with panels so each table is resizable and scrollable:
This dashboard shows live data, live violations, and live anomalies — all updating in real time. When something goes wrong, you see it immediately.
Note
Our simulation injects ~5% violations (negative values) and ~5% cents-instead-of-dollars records to demonstrate both tables populating. In production, these tables only show data when real issues occur.
Step 7: Alert on issues
The final piece: triggering alerts when problems appear. Use Deephaven's table listeners to react to violations:
Now you're notified the moment bad data arrives — not days later when someone notices the dashboard looks wrong.
Connecting it all together
Here's the full picture of how this series fits together:
| Part | Focus | Key Technique |
|---|---|---|
| Part 1 | Load → Dashboard | read_csv, agg_by, deephaven.ui |
| Part 2 | Handle problems | CsvSpecs, type overrides, encoding |
| Part 3 (this post) | Prevent problems | Real-time validation, anomaly detection |
The techniques from Part 2 — CsvSpecs for null literals, type overrides for ZIP codes, charset for encoding — are your fix when you know what's wrong. The monitoring from Part 3 is how you discover what's wrong in the first place.
The payoff
Before: You load a CSV, run your reports, and discover three days later that revenue tanked because amounts were in cents.
After: A real-time monitor catches the anomaly within seconds. You get a Slack alert. You apply the appropriate CsvSpecs fix from Part 2. Your dashboard never shows bad data.
Series wrap-up
Over these three posts, we've covered:
- From CSV to dashboard — Loading, transforming, and visualizing data in a live workflow.
- Problem CSVs — Handling edge cases that break other tools.
- Data quality monitoring (this post) — Building systems that watch your data for you.
The common thread: Deephaven treats CSVs not as static files to be loaded once, but as data sources that fit into a larger, real-time analytics pipeline. The same code works whether your data arrives as a file drop or a streaming feed.
Questions? Ideas for what we should cover next? Join us on Slack — we'd love to hear from you.