Pivot Widget examples
Example heat maps
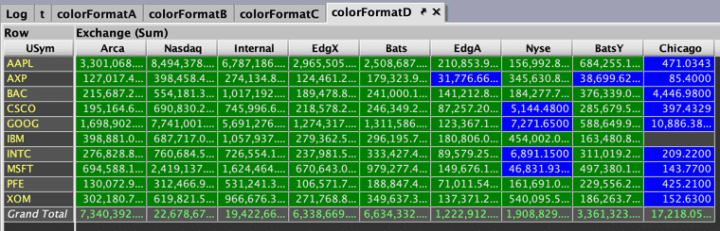
The following examples, scripted in Groovy, demonstrate the .setColorFormat method and its various implementations.
Each example modifies the same pivot widget created from the StockTrades table:
Example 1
Example 2
Example 3
Example 4
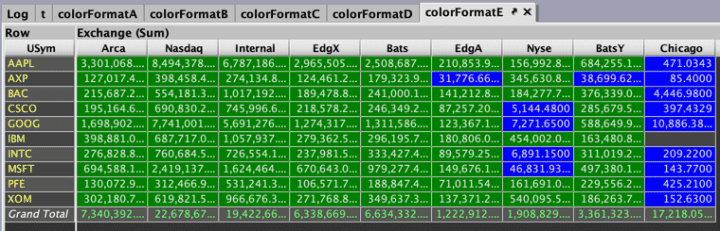
Example 5
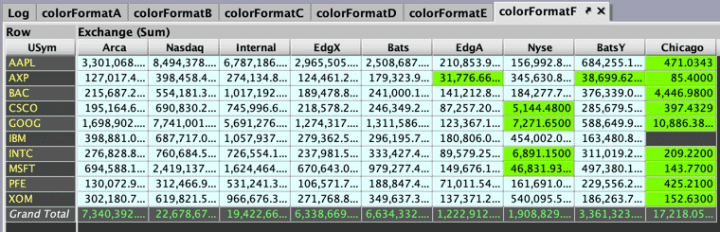
Example 6
Example 7
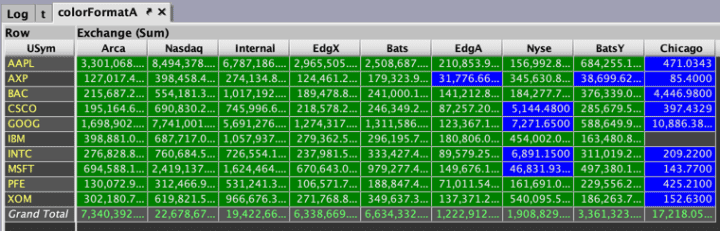
By default, the minimum and maximum values will apply to all the columns in the Pivot Widget. It is also possible to set the min/max coloring ranges dynamically per column by including multiple setColorFormat arguments within your query.
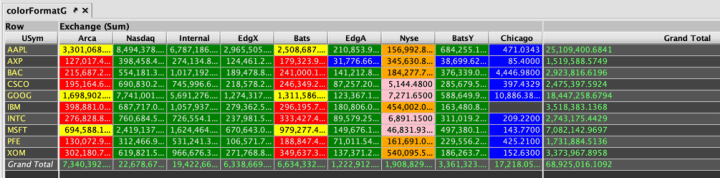
Example 8
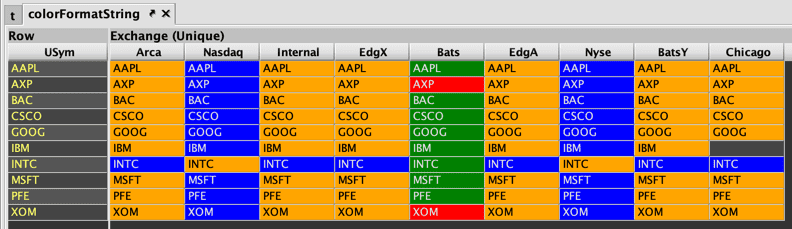
To allow heat maps for String data, include the unique() aggregator in your query.