Create Roll-ups and Tree Tables
If you have a large, detailed dataset it is helpful to quickly drill down to specific information or pull out aggregations for easy analysis. In this tutorial, we demonstrate two options: Roll-up tables and Tree tables.
Roll-up tables
Roll-up Tables group your data according to a specified key value (like Sym) and show certain, aggregated column values.
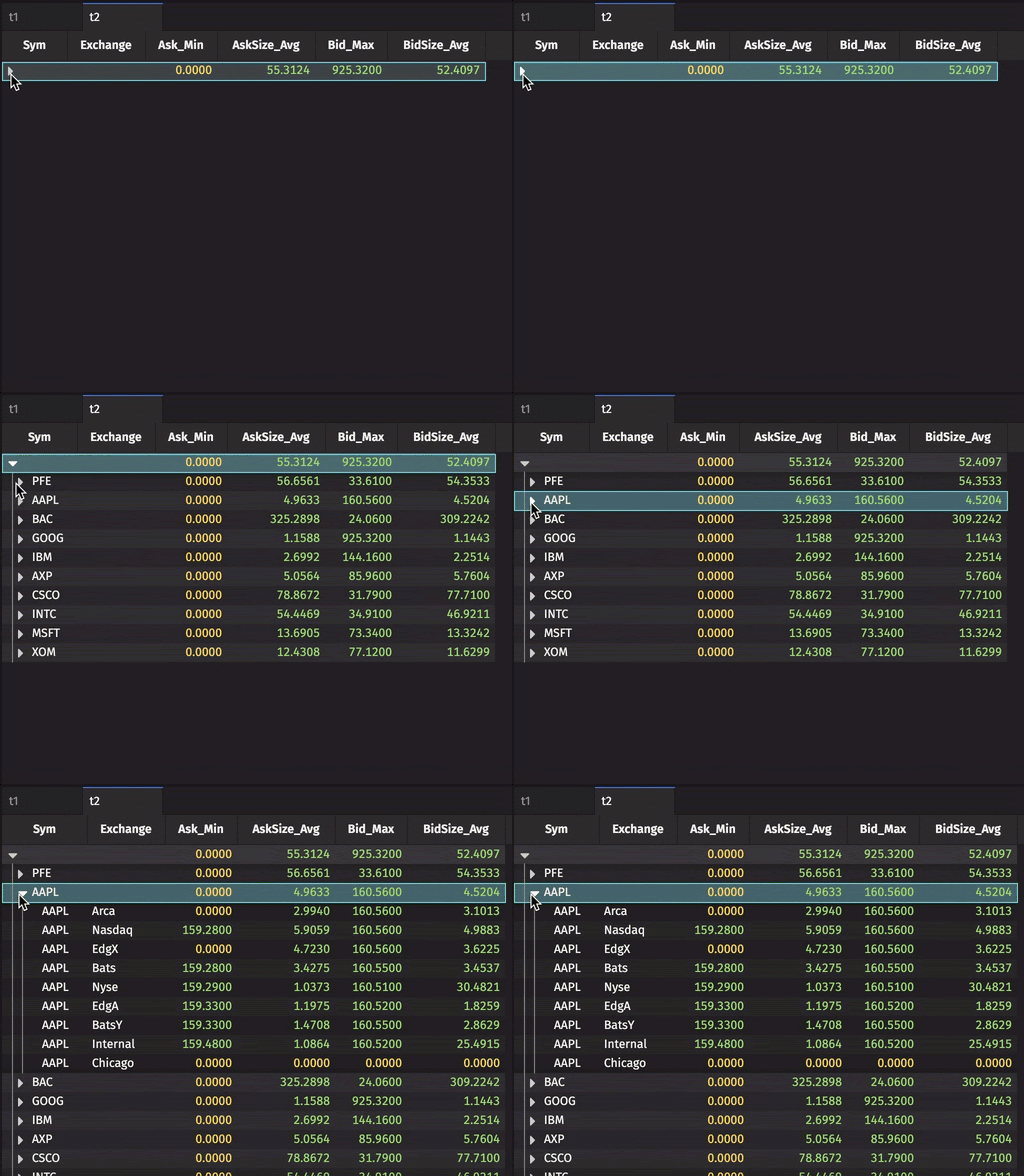
For example, we can "roll-up" the StockQuotes table by Sym at the top level, and Exchange at the sub-level into a table, and include four columns with aggregations specified in the query:

Let's break down that query:
- The second line of the query applies the
.rollupmethod. - Then we chain a series of aggregations using the
AggCombomethod. The aggregationAggMin("Ask_Min=Ask")obviously calculates the minimum ask price, but also defines a column name. Make sure each column has a unique name. Find the list of available operations here. - Finally, the query specifies the two columns by which to group data.
As with any other tables created in Deephaven, the columns in the Roll-up Table can also be sorted, moved, or hidden in the UI. However, any changes to the aggregation parameters must be made in the original query.
Note that Roll-up tables can also be created from the table data menu context menu.
Tree Tables
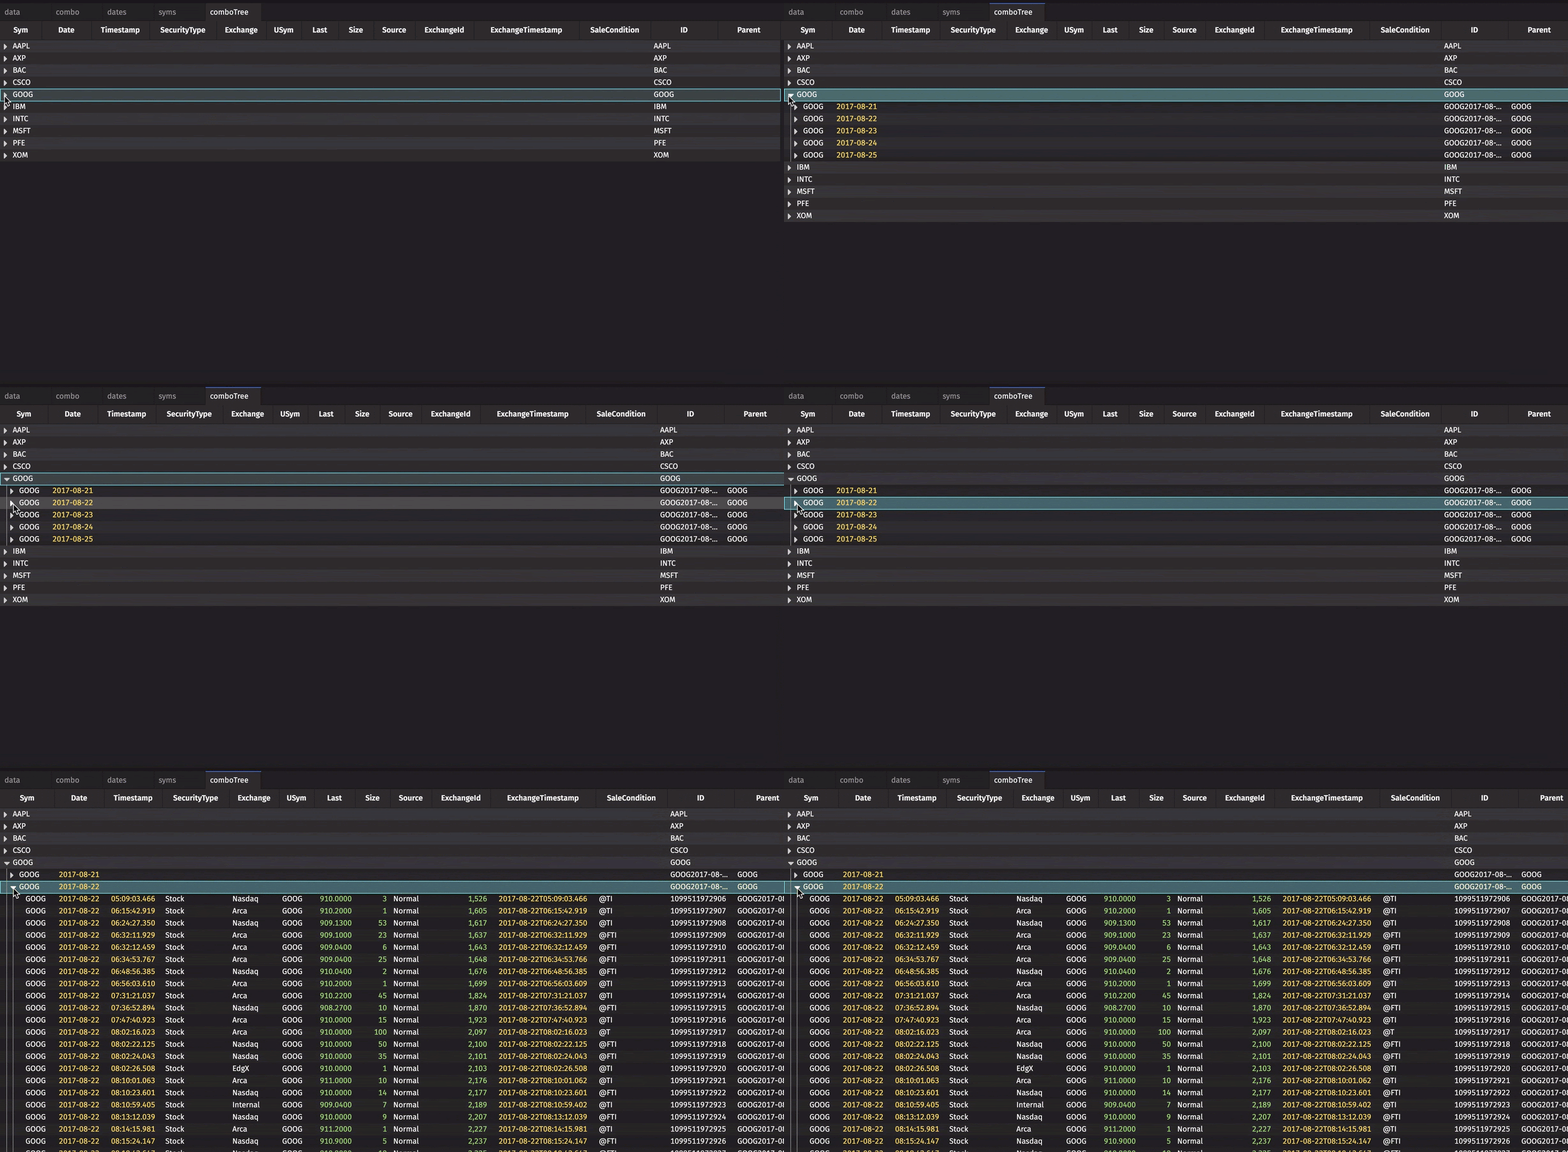
While Roll-up tables create a table hierarchy and display only certain aggregated data, Tree Tables include all your data but allow you to expand or collapse "branches" of the table as needed. In essence, these tables create a navigation menu: clicking on the arrow in a root row opens the data for that particular branch.
To demonstrate, we'll source our data from the StockTrades table and prepare the data by creating separate tables for our keys - Sym and Date. These get merged with a data table, to ultimately form one Tree Table.

This Tree Table organizes all five partitions of the StockTrades table, first by the 10 distinct Symbols, then by the five distinct dates.
To dissect this query a bit further, we can see that:
- The first part of the query creates a syms table, using the
firstBymethod to find each distinct Sym and return the first row for each group. TheupdateViewmethod creates a new ID column and Parent column. The ID column specifies the parent value that children rows will have to match. Parent column values are null because this table contains the root rows of the Tree Table (the rows that open each table level). - The second part of this query creates another parent table, dates, that also uses the
firstBymethod to find each distinct set of values for the columns listed in the argument. In this case, the arguments are Sym and Date. - The dates table sets Parent to the ID value of its parent, Sym, because this will be a sub-level of the root rows in the syms table. However, as a sublevel, ID will be set to the Parent value joined with its own unique identifier, Date. Then, the other columns are set to null so that no other data will be displayed.
- Now we create our table of data. The Parent column is set to the ID value of Sym+Date, but the ID column will still be a row number as a string.
- Finally, we combine all three of the tables together in the combo table, and use the treeTable method with our two arguments, ID and Parent, to create comboTree.
Note
See: Tree Tables