Understand browser logs
If you encounter an issue during your Deephaven web session, looking at Deephaven's logs and your browser logs can help diagnose the issue. For instance, if:
- The session unexpectedly terminates or stops: check the Code Studio Log tab and the ProcessEventLogs.
- The UI appears incorrectly - check browser logs.
- Functionality does not work - check both Deephaven's logs and the browser logs.
Browser Logs
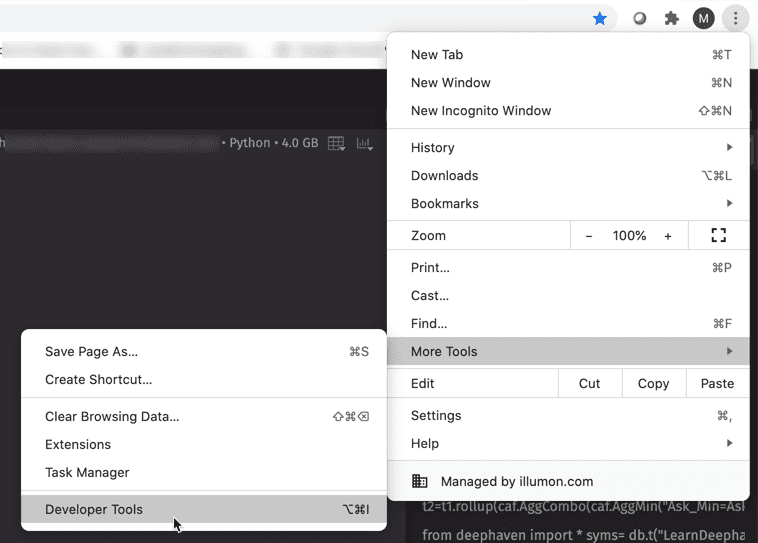
To access browser logs in Chrome, click the Controls menu and choose More Tools > Developer Tools.
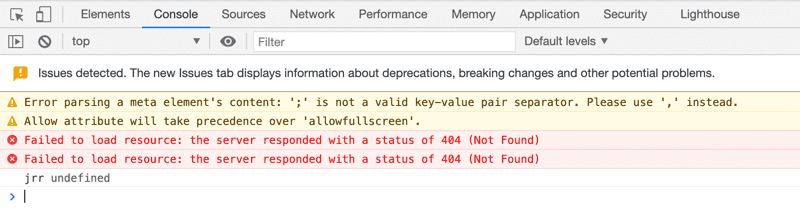
Click the Console tab. This is where known issues will be logged.
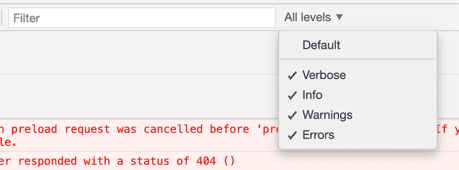
Next to the Filter field, we recommend selecting all levels:
You can also adjust the following settings to capture more detailed information in the logs. In the DevTools Controls menu, choose More Tools > Settings:
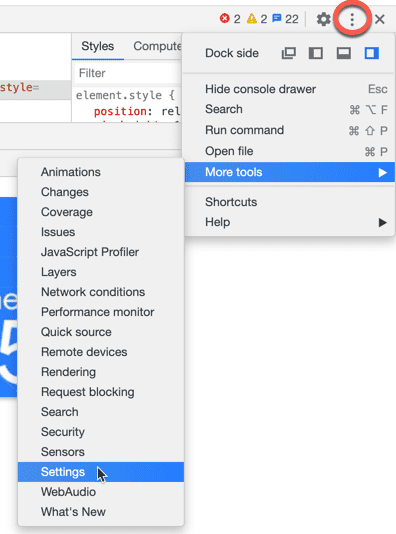
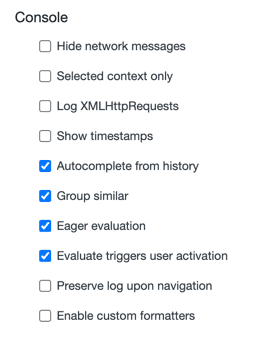
Under Console, you can choose to Log XMLHttpRequests, Show timestamps, etc.:
Getting help
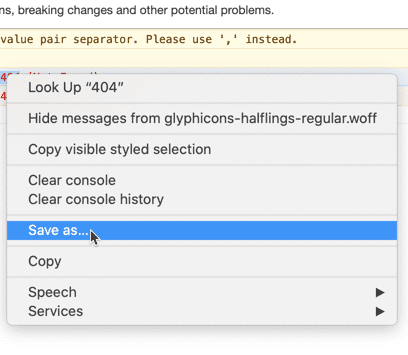
Whenever you encounter a problem, we recommend sending your logs to Deephaven Support. Right-click within the Console to save the file.