Manipulate tables
Whether you're working in a Dashboard or Code Studio, Deephaven makes it easy to customize your workspace and perform data analysis within the UI.
Though writing scripts is valuable and important, users want to be able to manipulate results directly in the tables they see. There are several ways to manipulate your data. Right-click any column header to open the following context menu:
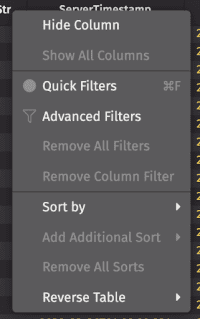
Some basic options are itemized below.
Sort
To sort a column, choose Sort by options from the column header menu, or simply click the column header once to sort in ascending order, a second time to sort in descending order, and a third time to return the column to its original order.
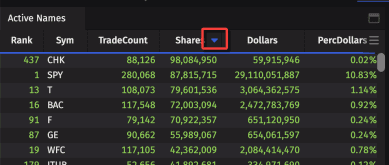
Once a table has been sorted in this fashion, an "up" arrow or "down" arrow will appear to the right of the column name to indicate the sort and the order (as shown below). A blue underline also displays across the bottom of the column header row anytime a table is sorted.
Filter
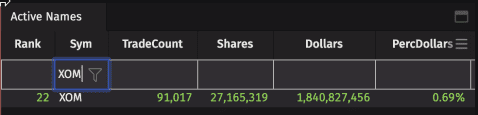
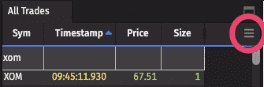
There are several ways to filter your data. Choose Quick Filters from the column header menu to add a filter bar across the header rows of your table. Type in your desired value (e.g., XOM) to immediately apply that filter to the table, as shown below.
In addition to matching exact values, there are other options you can use to filter the data. For example, entering ">=50" in a number field will show table rows containing values greater than or equal to 50. To see all options, please review the Quick Filter Statement Options.
The funnel icon (in the highlight above) opens the Advanced Filters dialog, which include AutoFilters.
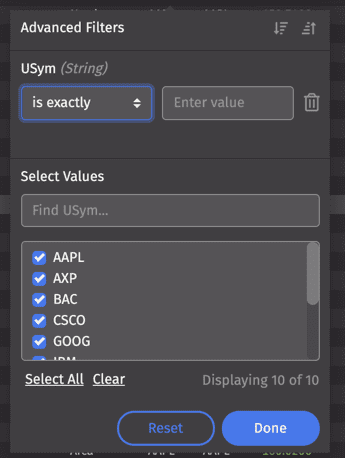
To learn more, see Advanced Filters.
Plot
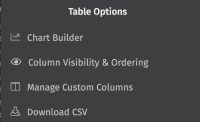
A comprehensive set of plotting methods is available when scripting in the Deephaven Query Language. However, you can also create a simple chart directly from the table. In the table containing the data you want to plot, click the Table Options menu.
Then select Chart Builder.
The Chart Builder interface will allow you to choose one of the four available chart types, and configure the applicable axis values, as shown below.
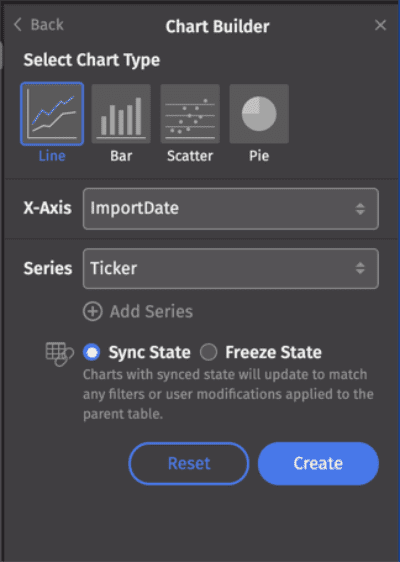
Make your selections and click Create. Note: The resulting plot will reflect any filters applied to the table.
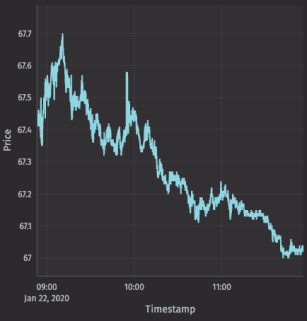
The following line chart shows the prices for XOM:
Hide or Reorder Columns
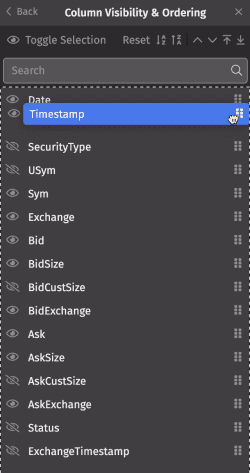
The Column Visibility & Ordering feature allows you to quickly hide/show, rearrange, and sort columns in one place. Open the Table Options menu, and then select Column Visibility & Ordering. A list of column names will appear. The eye icon indicates which columns are visible in the table.
As shown below, drag and drop any selected column to rearrange the order in which they appear in the table.
Manage Custom Columns
Manage Custom Columns is a feature that enables you to quickly add new columns to store custom calculations directly in the Deephaven interface, rather than updating a table's query. (See Custom Columns to learn more.)
To create a custom column, open the Table Options menu, and then select Manage Custom Columns.
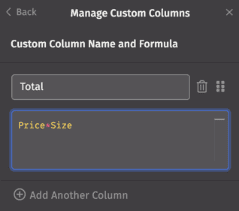
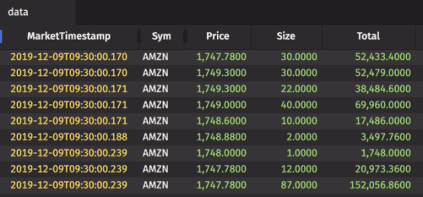
In the Manage Custom Columns dialog (shown below), enter the name of the new column, then write the formula below. For example, you could add a new column called "Total" that multiplies the last price and size for each row in the table:
You can open the Custom Columns dialog again to edit your selections if you like. You can also add additional custom columns by clicking the + Add Another Column button.
Tip
If you have created multiple custom columns, it may be necessary to arrange the order of your custom columns for calculations to work correctly. For example, columns may depend on each other, or especially if your calculations create new columns that override old columns, with the same name. Deephaven evaluates columns from left-to-right.
To change the order of the new custom columns prior to showing them in the table, click the drag icon ( ) in the dialog and drop the column information to the desired position. To remove a custom column, click the trash can button (
 ) to the left of the column name, and select Save Column.
Copy Data to the Clipboard
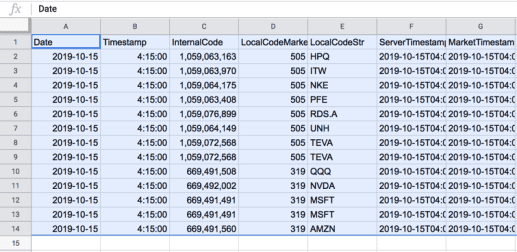
To copy data from a table to the clipboard, use the mouse to highlight the rows of data you want to copy. Then use the context (right-click) menu to select one of the copy options, as shown below.
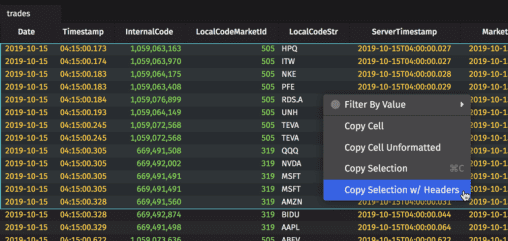
The copied data can then be pasted into a spreadsheet (or text editor):