Category Histogram
The category histogram plot is used to show how frequently a set of discrete values (categories) occur.
Data Sourcing
Category histograms can be plotted using data from tables or arrays.
Creating a Category Histogram Plot using Data from a Table
When data is sourced from a table, the following syntax can be used:
.catHistPlot("seriesName", source, "ValueCol").show()
catHistPlotis the method used to create a category histogram."SeriesName"is the name (as a string) you want to use to identify the series on the chart itself.sourceis the table that holds the data you want to plot."ValueCol"is the name of the column (as a string) containing the discrete values.showtells Deephaven to draw the plot in the console.
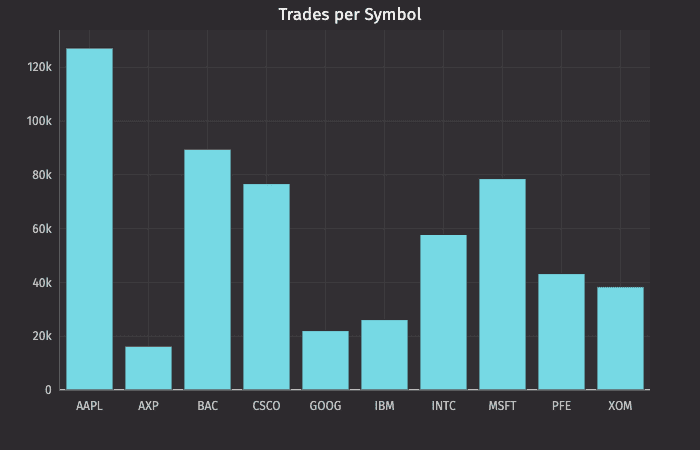
This query plots the histogram as follows:
catHistTradesBySymis the name of the variable that will hold the plot.catHistPlotis the method."Number of Trades"is the name of the series to use in the plot.tradesis the table from which our data is being pulled.Symis the name of the column containing the discrete values.chartTitle("Trades per Symbol")adds a chart title to the plot.
Creating a Category Histogram Plot using Data from an Array
When data is sourced from an array, the following syntax can be used:
.catHistPlot("SeriesName", [Values]).show()
catHistPlotis the method used to create a category histogram."SeriesName"is the name (as a string) you want to use to identify the series on the plot itself.[Values]is the array containing the discrete values.showtells Deephaven to draw the plot in the console.