Dynamic Plots
Plots configured with a selectable dataset can be paired with Deephaven's Input Filter, Linker feature, or drop-down filters. As the input changes, the paired plot will dynamically update to reflect the filtered dataset.
oneClick
To create a dynamically updating plot - a plot that updates with "one click" in the console -, the data source must be a SelectableDataSet. This is easily accomplished with the use of the oneClick method:
.oneClick(source, "ColName1", "ColName2", ...)
sourceis the table containing the data.- Additional arguments represent the name(s) of each column (as a string) to be available for input filtering.
When retailPlot opens in the console, you will be prompted to "Add Input Filters" or "Use the Linker Tool" to filter the data in the appropriate column (in this case, "USym") before the plot will draw.
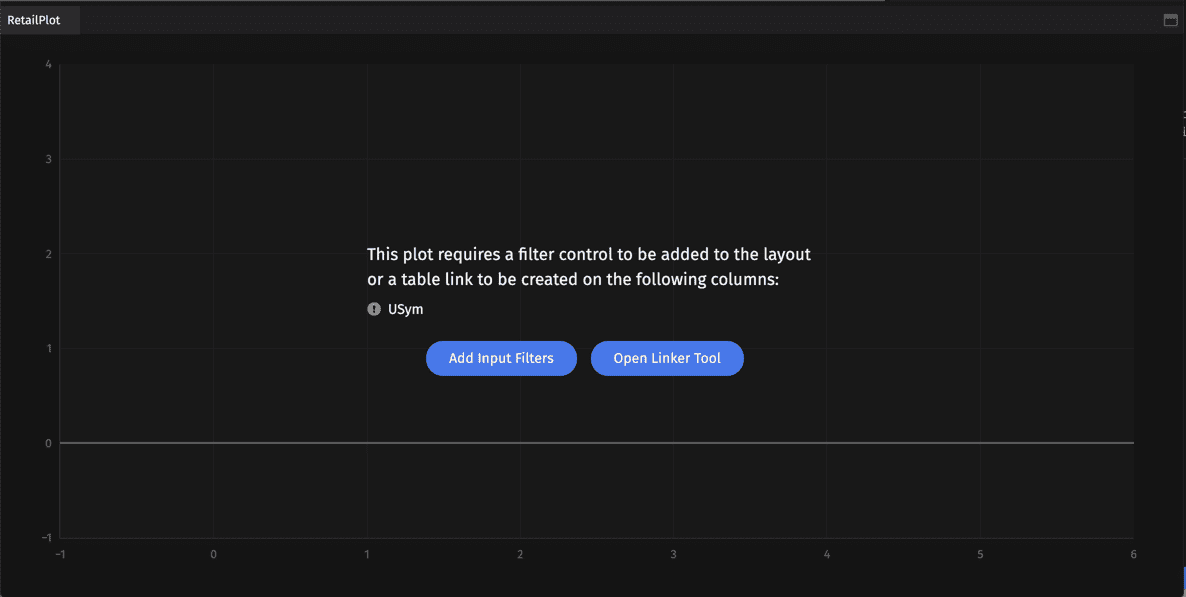
However, including an optional boolean argument set to false will plot the entire table without a filter applied.
Input Filters
In order to pair your dynamic plot with an Input Filter, either click the Add Input Filters button in the console, or choose the Input Filter option from the Controls menu.
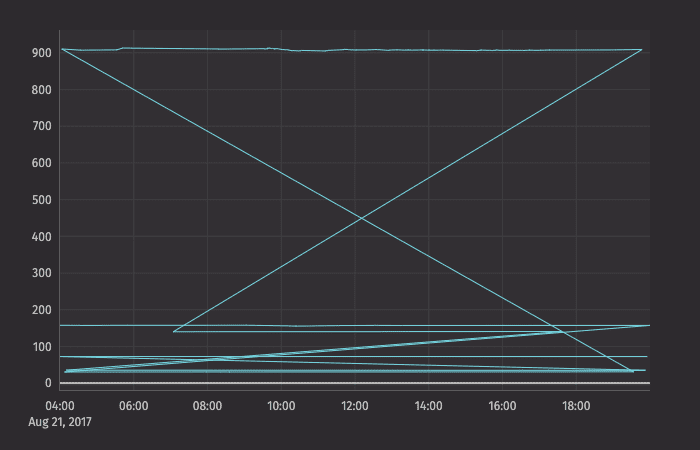
The plot will automatically update as you input values in the filter.
Note
The Input Filter feature filters every open table and dynamic plot in the console.
Note
See Input Filter
Linker Tool
Alternatively, you can use the Linker tool to pair the dynamic plot with a table by clicking the Open Linker Tool button in the console, or choose the Linker option from the Controls menu.
Connect the input column (in this case, "USym") button in the dynamic plot to the matching column in the trigger table. Double-clicking on any row in the trigger table will filter the target (the dynamic plot) to match the input column's value in that row.
Note
See Linker
To clear your selections, open the Linker from the Controls menu and choose Clear All.