Saving Plots
Charts created in Deephaven can be saved as PNG files, either using the Plot Hover menu or by query, using the figureSave
method discussed here.
Tip
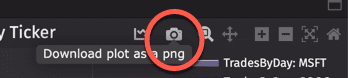
Download any chart as a PNG file from the Plot Hover menu, as shown:
figureSave
There are two options for the arguments in the save
method:
save("StringName.png")
- Saves a PNG file with the size 2480px x 2160px (width x height).save("StringName.png", int width, int height)
- Saves a PNG file with your specified width and height (in pixels).
By default, the resulting PNG file is saved into the following directory on the server: /db/TempFiles/dbquery/db_query_server/
//The following plot assumes the dataset has already been saved to a table named sales.
MarketShareMarch2017 = piePlot("March2017", sales, "Brand", "SoldMarch2017")
MarketShareMarch2017.save("MarketShareMarch2017.png")
MarketShareMarch2017 = MarketShareMarch2017.show() //not required if you only want to save the chart.
from deephaven import Plot
# The following plot assumes the dataset has already been saved to a table named sales.
MarketShareMarch2017 = Plot.piePlot("March2017", sales, "Brand", "SoldMarch2017")
MarketShareMarch2017.save("MarketShareMarch2017.png")
MarketShareMarch2017 = MarketShareMarch2017.show() # not required if you only want to save the chart.