Column formatting
Numeric Formatting
Numeric formatting can be applied to the contents of a column by using the formatColumns method:
.formatColumns("ColumnName=Decimal(`<expression>`)")
The expression used in the argument can be any of the Java DecimalFormat strings. The expression needs to be enclosed by backticks.
| Syntax | Description | Formatted Example |
|---|---|---|
formatColumns("Col=Decimal(`###,##0.00`)") | Formats the column values to include two mandatory decimal places. |
|
formatColumns("Col=Decimal(`\$###,##0.00`)") | Formats the column values to dollars and cents. |
|
formatColumns("Col=Decimal(`##0.00%`)") | Formats the column values to reflect a percentage with two mandatory decimal places. |
|
Combining Numeric and Color Formatting
The methods used above can also be combined with color methods by chaining the arguments to the formatColumns methods.
Note
See: Color Formatting
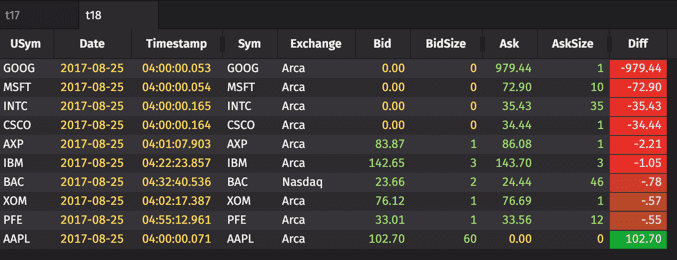
For example, the following query will:
- sort the table in descending order based on the values in the Diff column ,
- format the values in the Diff column rounded to two decimal places, and
- apply a color heat map to the Diff column ranging from vivid red to vivid green as the values of the column move from most negative to most positive.
Date and Time Formatting
Date and time formatting can be applied to the contents of a column by using the formatColumns method.
.formatColumns("ColumnName=Date(`<expression>`)")
The expression used in the argument can be any of the Java DateFormat strings. The two-letter timezone (e.g., NY, ET, MN, CT, HK, etc.) can be displayed by adding %t to the end of the time component (see second example below). The expression needs to be enclosed by backticks.
| Syntax | Description | Formatted Example |
|---|---|---|
formatColumns("PrettyDate=Date(`EEE dd MMM yy HH:mm:ss`)") | Formats the column to show the day of week, month and time. | Wed 21 Mar 18 17:03:16 |
formatColumns("PrettyDate=Date(`HH:mm:ss %t`)") | Formats the column to show the time with two-letter time zone. | 17:03:16 NY |
formatColumns("PrettyDate=Date(`yyyy_MM_dd'T'HH-mm-ss.SSSS z`)") | Formats the column to show the full date and time with the Java time zone. | 2018_05_08T17-03-16.0000 EDT |
Conditional formatting may be applied in the same fashion as with other types of formatting.
Progress Bars
Column values can be displayed with a progress bar, which fills in the cell's background to correspond with a percentage value, thereby making it easier to quickly visualize progress.
To build a table with a column (or columns) rendered as progress bars, the query used to build the table must first import the com.illumon.iris.db.v2.ColumnRenderersBuilder class. The ColumnsRenderersBuilder class is then used to define the columns that will be reformatted in the table.
The syntax follows:
- The first line of the query tells Deephaven where to import the class needed for the query to run properly.
- The second line of the query fetches the source table, t1.
- The third line of the query creates the t2 table by creating a new instance of the ColumnRenderersBuilder, and specifies the columns that will be rendered with progress bars. In this example, two columns are formatted individually by using the
setRenderer()method.
Note
The PROGRESS_BAR argument works for integer data types with values from 0 to 100, or for doubles data types with values from 0.0 to 1.0.
In the following example, we are starting with an existing table called "histVolume", which was created to show the following for each of several tickers:
- number of shares desired (GoalQ),
- number of shares already purchased (FilledQ),
- number of shares still needed to reach the goal (NeedQ),
- progress to goal (PercentComplete),
- and three more columns for the quantity, price, and time of the last purchase for each ticker (LastQty, LastPrice, Time).
The "histVolume" table is shown below.
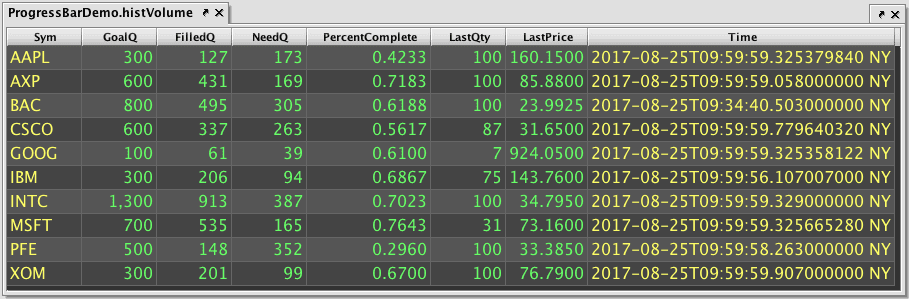
As shown above, the "PercentComplete" column shows a numerical value. By adding the following two lines to the query, we can also incude a visual progress bar in the background for each cell in the column.
Note
This is a non-working example, as it requires the "histVolume" table to run.
After importing the ColumnRenderersBuilder class, the query creates the t2 table by fetching the earlier histVolume table, creating a new instance of ColumnRenderersBuilder, and specifying the column that will be rendered with progress bars. In this example, the "PercentComplete" column will be formatted using the setRenderer() method, as shown below.
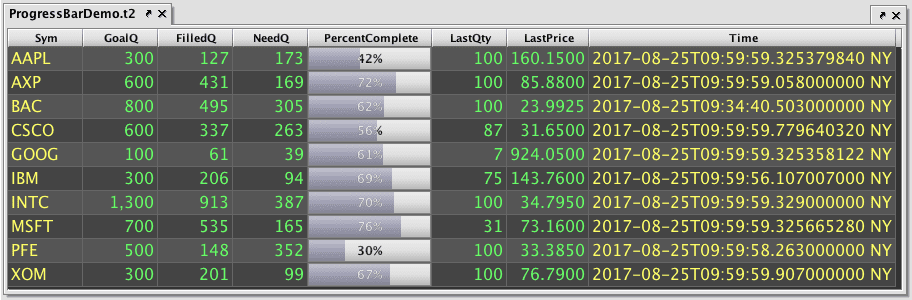
The ColumnRenderersBuilder class works on ticking tables, and will update accordingly as the underlying data changes in the table. In the example above, as more orders are filled, the values in the NeedQ column will decrease and the values in the PercentComplete column will increase.
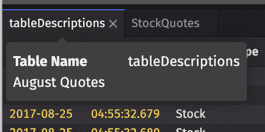
Custom Tooltip Descriptions
Custom descriptions for tables and/or columns can be added using the withTableDescription() and/or withColumnDescription() methods. Descriptions will appear as tooltips when the user's cursor hovers over the respective table's tab or the column's header:
t.withTableDescription("<description>")
t.withColumnDescription("<colName>", "<description>")
For example, the query below starts with the StockQuotes table, adds a new column (Mid), and then adds a table description and a column description to the new table.
When the cursor hovers over the table tab, "August Quotes" appears in the tooltip:
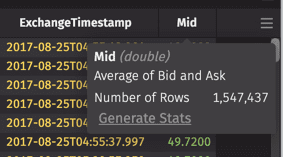
When the cursor hovers over the Mid column header, "Average of Bid and Ask" appears in the tooltip: