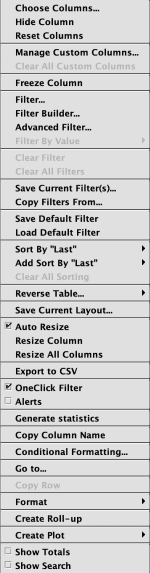
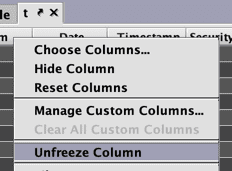
Column name context menu
When you right-click on a column name, a list of shortcut options appears.
Choose Columns
Selecting Choose Columns opens a new window, which allows you to select from a list of available columns to keep visible or to hide.
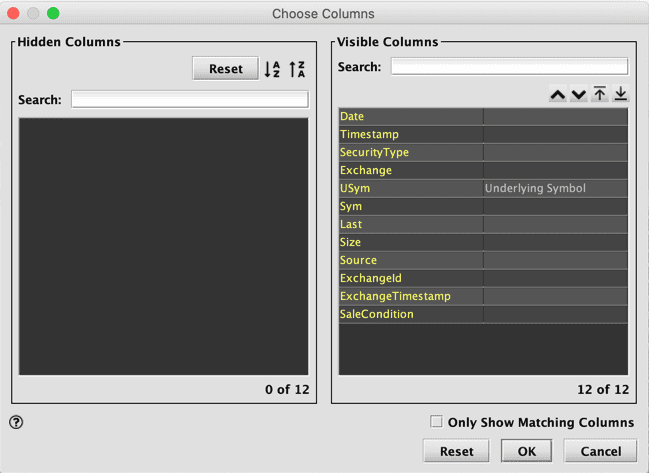
To the left is a list of hidden columns, if any. To hide a column, double click on the column in the panel to move them to the Hidden Columns section. If columns are already listed as hidden, you can double-click on the name of the column to move them to the Visible Columns section. Multiple columns may be shown, or hidden by holding Cmd (Mac users) or Ctrl (Windows users) and clicking on the desired columns, then pressing Cmd or Crtl + Left arrow to hide, or Right arrow to show. Right-clicking either panel will also display a drop down menu to move columns.
In the right panel, visible columns are listed top-to-bottom in respect to the left-to-right order they appear in the table (i.e., the first column listed in this panel corresponds to the leftmost visible column in the table). Column descriptions (if applicable) appear next to the column name, as in the USym column in the example above. You can change the order of column(s) by selecting one or more and then dragging them to the desired position. Additionally the arrow may be used to move the select columns up or down incrementally or directly to the top or bottom of the list.
The Column Chooser also provides some searching controls to help find columns of interest. Simply select or press Cmd-F (Mac) or Ctrl-F (Windows) and begin typing to find columns. By default, search will select and scroll to the first match. Checking the Only Show Matching Columns checkbox will instead hide columns that do not match.
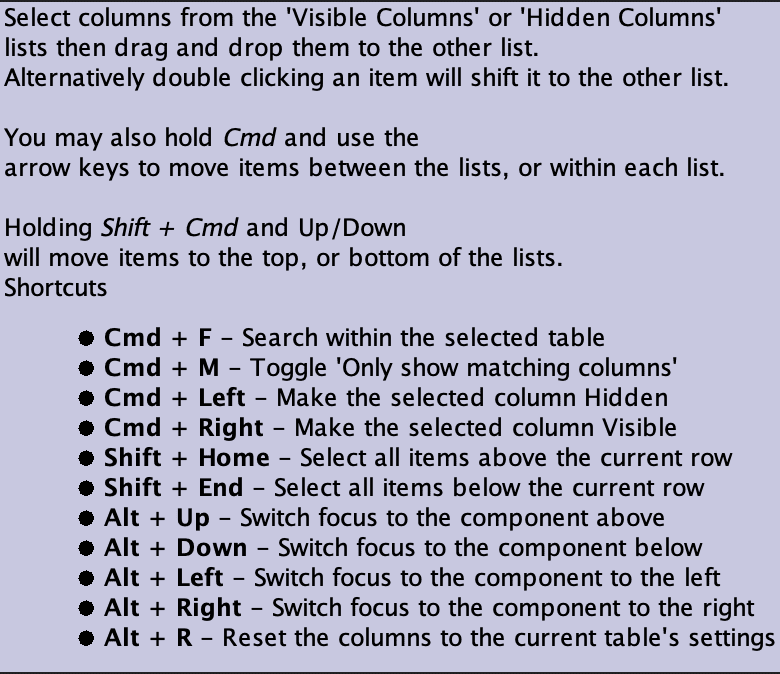
There are also keyboard shortcuts for various actions. Hover to display the available shortcuts:
Hide Column
If you right-click on a column name and select Hide Column, that column will be hidden from view. This process can be repeated if you want to hide more than one column. To show hidden columns, use the Column Chooser shortcut.
Reset Columns
If you right-click on any column name and select Reset Columns, the order and visibility of all columns return to how the table was originally generated.
Manage Custom Columns
Selecting Manage Custom Columns opens the Column Builder interface, which enables you to quickly add new columns and manipulate other columns directly within the table interface in Deephaven.
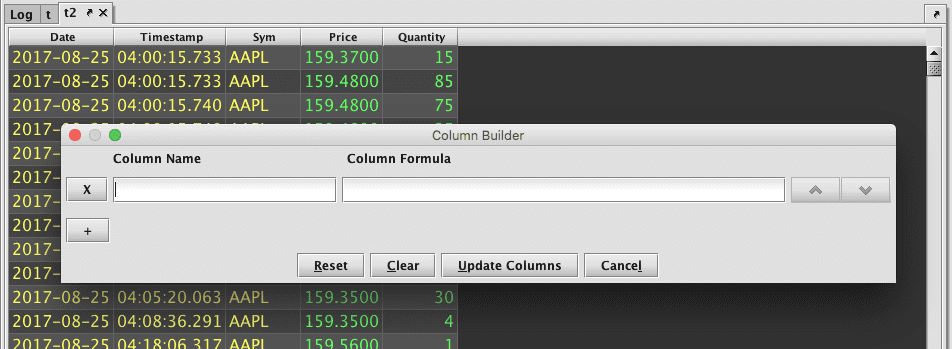
Type the name of the new column in the field on the left titled Column Name. (Note: Column names cannot contain spaces.) The Column Formula field is used to hold the formula you want to use to create the data in the column rows.
The example below is a calculation to determine the total value of each trade, so it uses "Total" as the value in the Column Name field and "Price*Quantity" (using an asterisk for the multiplication symbol) as the value in the Column Formula field.
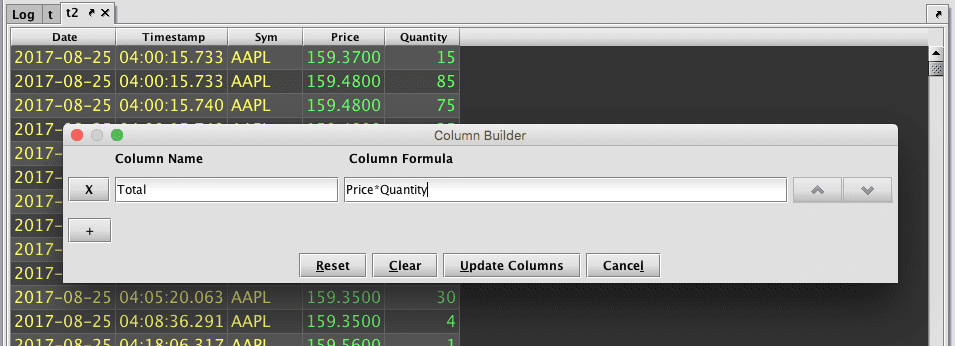
- Other columns and their respective formulas can be added by clicking the + button on the left side of the dialog window.
- To remove a custom column, click the X button to the left of the column name.
- To change the order of the new custom columns, click the up or down buttons to the right the Column Formula field.
Caution
Custom column formulas that have no syntax issues can still cause errors when actually applied to the view's dataset. If this happens, the underlying worker will crash and require a restart. The most common case is a NullPointerException, which can occur when for example a row contains a null value for Symbol in Symbol.contains(`SPX`) .
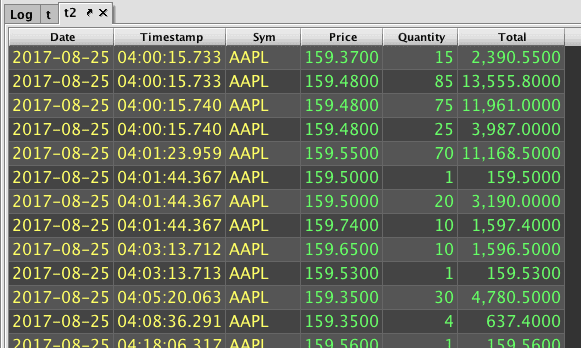
When you are done creating new custom columns, click Update Columns to add the new column(s) to the displayed table:
Tip
New column(s) created in this manner are only temporarily added to the table displayed in your immediate workspace. If you close Deephaven and restart it later, the new column will no longer be part of the table. If you would like the new column to persist in the table, click Save at the top of the Deephaven interface. This will save your current workspace, including the definition and layout of any custom columns.
Caution
Note that creating a custom column can potentially break a persistent query if the tables are ticking. Setting the property SystemicObjectTracker.enabled to true enables systemic object tracking. This can be done via property files or using extra JVM arguments of a persistent query.
Clear All Custom Columns
If the table contains one or more columns created by the process outlined in Manage Custom Columns, selecting this option will delete all of those custom columns. If there are no custom columns in the table, this option will be grayed out in the menu.
Freeze Columns
The Freeze Column feature allows useres to "freeze" certain columns so that they will remain in view when horizontally scrolling through the table. Right-click the desired column header and select Freeze Column to move the selected column to the front (left side) of the table, and the horizontal scrollbar at the bottom of the table will move to the first unfrozen column.
Once a column has been frozen (either in the GUI or via the query language), it can be unfrozen by right-clicking on the column header and selecting Unfreeze Column from the drop-down menu:
The Freeze Column option can be used in conjunction with other layout hints, such as Saved Layouts and Autofilters.
Note
The following behaviors should be noted when freezing columns in the UI:
- If a column is locked and also frozen by the query language, it cannot be unfrozen by using the right-click method in the GUI. - - If an unfrozen column is locked using the query language, it cannot be frozen in the GUI.
- These options will be grayed out in the Column Name menu.
- Frozen columns are saved to the workspace and reloaded, and any changes made to these columns in the UI will override selections made in the table's query.
- Frozen columns can be hidden and restored just like any other column. The Reset Columns option will restore frozen columns to the original state defined in the query.
Note
Freezing columns is not currently supported on Tree Tables.
Filter…
This option enables you to manually filter data in a table after it has been generated. To use this feature, right-click on the heading of the column you want to filter and then select Filter… from the shortcut menu.
The following dialog window will appear:
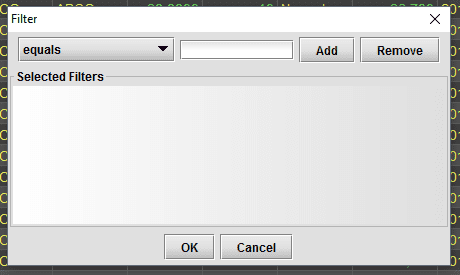
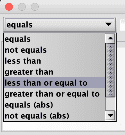
The drop-down list at the top left includes the following filter operations:
- equals
- not equals
- includes
- not includes
- equals (casesen)
- not equals (casesen)
- includes (casesen)
- not includes (casesen)
- included in list
- not included in list
- starts with
- ends with
The notation "casesen" on four of the filters indicates a case-sensitive filter. When using the filter versions without "casesen", uppercase and lowercase letters are treated the same.
For example:
- "equals AAPL" would filter for any combination of the letters AAPL, including AApl, aAPl, aaPL, etc.
- "equals (casesen) AAPL" would filter only on values that include the uppercase letters AAPL.
To create a filter, select the operation desired, then enter the value in the field to the right of the drop-down menu. Click Add to include the operation and value in the final filter. The filter will then be shown in the Selected Filters section.
For example, if you wanted to see only data related to trades where AAPL was listed in the Sym column, the filter would look like this:
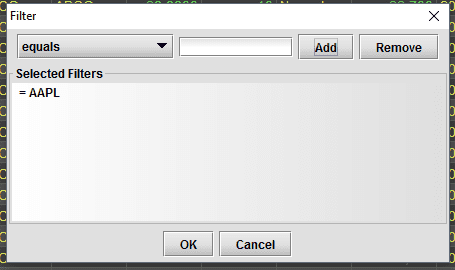
Additional filters may be added to the set using the same steps.
You can also remove filters by selecting a filter and clicking Remove.
Filter Builder
Filter Builder is a slightly more complex version of Filter. To use this feature, right-click on the heading of the column you want to filter and then select Filter Builder from the shortcut menu. The following dialog window will appear:
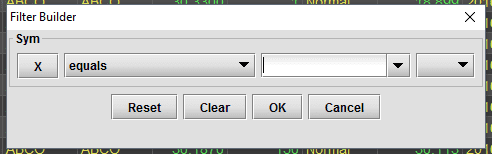
The name of the column being filtered is shown in the top left corner of the dialog box.
Select the operation from the drop-down menu. The next field to the right is a drop-down combo box. You can type a value into the field directly, or you can select from the drop-down list to compare values in two columns. When you click the button on the right, the filter will be saved and a new line for another filter operation is added below. Note also that the last button on the right now also presents options for "And…" or "Or…", which allow you to build filter sets based on multiple combined operations or multiple individual operations.
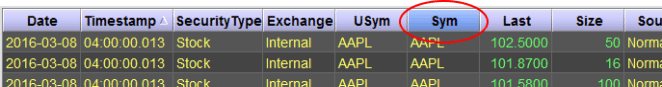
If a filter has been applied to a column (including OneClick filters), the background of the column header will change to a darker shade of blue. For example, the table shown below has a filter applied on the Sym column:
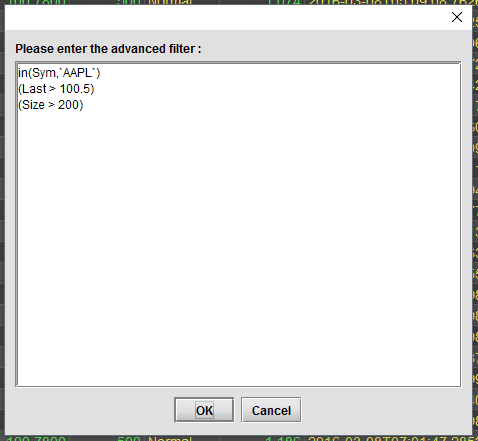
Advanced Filter
The Advanced Filter option opens a new window where you can write your own filter using the Deephaven Query language.
If you open the Advanced Filter dialog on a table that has already had filters (including OneClick Filters) applied to it, those filters will be shown in the panel.
Note
Filter operations that were applied as part of the query that created the table are not shown.
You can use the Advanced Filter panel to write a new filter, or view/change an existing filter.
Each individual filter must occupy its own line in the panel. This is accomplished by pressing Shift+Return or Shift+Enter on your keyboard at the end of each line. Pressing only Return or Enter on your keyboard will not work, as that is equivalent to clicking the OK button.
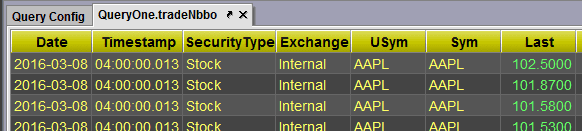
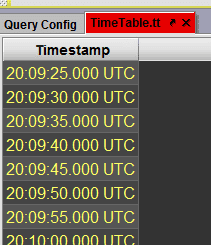
When a table is being filtered by the Advanced Filter, the background of the column headers will turn yellow:
Filter by Value
The Filter by Value option is grayed out unless you right-click on a cell in the table. See Filter by Value.
Clear Filter
If you right-click on a column name and select Clear Filter, the filter used on that column will be cleared.
Note
Filtering operations applied within the original query code are not impacted.
Clear All Filters
Selecting Clear All Filters clears all filters used on that table (including OneClick filters).
Note
Filtering operations applied within the original query code are not impacted.
Save Current Filter(s)…
Selecting Save Current Filter(s)… will save the filter(s) applied to the table, which may be used on other Deephaven tables.
If you change the filter(s) used on this table at a later date, those changes will not automatically be updated in the saved filter set.
Tip
The Save Current Filter(s)… process only saves the filter for use in the current Deephaven session. If you quit Deephaven, any filters saved in this method will be deleted. To retain the saved filter(s) and table layout for use in subsequent Deephaven sessions, you will need to also save the workspace by clicking Save at the top of the Deephaven interface.
Once a filter set is saved, three additional options appear in the shortcut menu:
- Load Filter - When this option is selected, a list of previously saved filters for this table is presented in the drop-down list. When you select one of the saved filters, that filter will replace any previous filter(s) that may have already been applied to the table.
- Merge Filter - When this option is selected, a list of previously saved filters for this table is presented in the drop-down list. When you select one of the saved filters, that filter will be applied to the table in addition to any other filters that may already be applied to the table.
- Delete Filter - When this option is selected, a list of previously saved filters for this table is presented in the drop-down list. When you select one of the saved filters, you will be asked to confirm that you want to delete that particular filter from the saved filters list.
Copy Filters From…
In addition to saving filters for a given table, filters may also be shared with other tables. To use a filter that was saved on a different table, right-click on a column name and select Copy Filters From… from the shortcut menu. This will bring up a list of previously saved filters, grouped by the name of the table on which the filter was originally created.
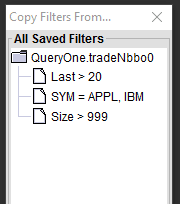
To apply the saved filter to your current table, select it from the list and click OK. You can also copy multiple filters to the current table by holding down the Ctrl or Shift key when clicking on the filter name.
Save Default Filter
Selecting Save Default Filter saves the filter(s) applied to this table (and only this table) for use as the defaut filter.
Load Default Filter
Selefting Load Default Filter re-applies the previously saved default filter for a given table.
Sort by…
Right-click on the name of the column you want to sort, and the name of that column will be shown in the Sort by… option.
If the column contains text or strings, three options will be presented in the drop-down list:
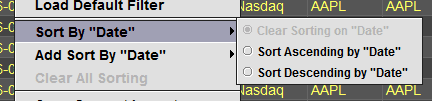
- The first option, Clear Sorting on…, will be grayed-out, unless sorting has already been applied to this column.
- Sort Ascending by… sorts the table in ascending order of the content in the column selected.
- Sort Descending by… sorts the table in descending order of the content in the column selected.
If the column you are sorting contains numeric content, two additional options will be presented:
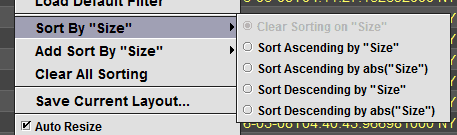
- Sort Ascending by (abs)… sorts the table in ascending order of the absolute value of the content in the column selected.
- Sort Descending by (abs)… sorts the table in descending order of the absolute value of the content in the column selected.
Add Sort By…
Add Sort By… provides the opportunity to do sorting on additional columns in a table. For example, you could first sort a table by the value in one column and then apply secondary sorting on a different column.
The order of sorting is determined by the order in which you create new sorting parameters. For example, if you first sort the order of column A, then column B and then column C, the table will be sorted in that same consecutive order.
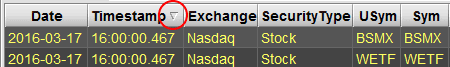
When a table is sorted, an arrowhead indicator will be visible in the column header for that column.
Column sorted in ascending order:
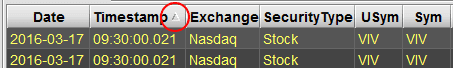
Column sorted in descending order:
Clear All Sorting
Selecting this option clears all sorting from the table.
Note
Sorting operations applied within the original query code are not impacted.
Reverse Table
Selecting Reverse Table will reverse the order of the rows in an entire table, where the last row becomes the first row and vice versa.
The following three options are presented:
- Reverse Before Sorting: Selecting this option reverses the table order immediately. This reversed table can then be manually sorted as many times as needed.
- Reverse After Sorting: Selecting this option reverses the order of rows after manual sorting methods are applied. When more than one manual sorting operation is applied to the table, all sort operations are sequentially applied to the unaltered table before returning the rows in reverse order.
- No Reversal: Selecting this option restores the order of the original table. If manual sorting has been applied to the table before this option is chosen, those sorting results remain visible in the table.
Note
See Reversing Table Order for more about using query methods.
Save Current Layout
Selecting Save Current Layout saves a specific layout for use at a later time, including whether columns are visible/hidden, the column order and the column widths. This process only saves the layout for a single table. Saved layouts cannot be shared with other tables.
Tip
The saved layout is only available for use during the current Deephaven session. To include the saved table layout for use in future sessions, click Save at the top of the Deephaven interface.
Load Layout
Selecting Load Layout will open a list of saved layouts. Select the name of the saved layout you want to apply to the table.
Delete Layout
Selecting Delete Layout will open a list of saved layouts. Select the name of the saved layout you want to delete and click Yes in the confirmation window to delete the layout.
Auto Resize
The Auto Resize check box is selected by default.
When checked, Auto Resize will automatically increase or decrease the width of a column based on the longest value displayed in that column. This is most commonly used in a table where rows are added or removed based on live, ticking data.
If Auto Resize is not selected, the width of the column will default to its initial width when the table was created.
Resize Column
Selecting Resize Column automatically reduces the width of a column to the minimum width required to show the longest content in that column.
Resize All Columns.
Selecting Resize All Columns automatically reduces the width of all columns in a table to the minimum width required to show the longest content in each column.
Export to CSV
This option enables you to export all of the data in the table as a comma separated value (CSV) file, thereby allowing you to use the data outside of Deephaven.
OneClick Filter
The OneClick Filter check box is selected by default.
When a OneClick filter is used in a given panel, all tables and graphs in that panel are filtered according to the value entered in the OneClick Filter. To stop the OneClick filter from operating on a specific table, deselect the OneClick Filter check box within that table.
Note
See: OneClick
Alerts
This feature is used with tables that are interacting with live data.
- If the Alerts check box is selected, the tab for this table will turn red when a new row of data is added to the table. The tab will stay red until the tab is clicked.
- If the Alerts check box is not selected, the table will continue to update, but the tab will not turn red.
Generate Statistics
Select Generate Statistics will open a small window (similar to a tooltip) presenting specific statistics about the data in the column.
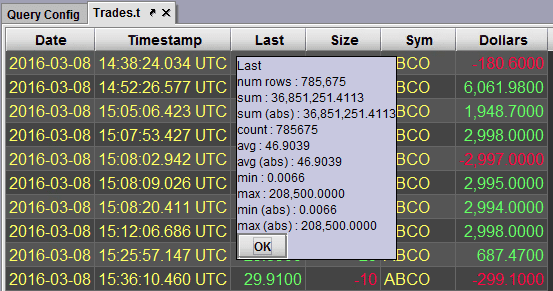
When you are done reviewing the information, click OK to close the window.
Copy Column Name
Selecting Copy Column Name copies the column name to the clipboard.
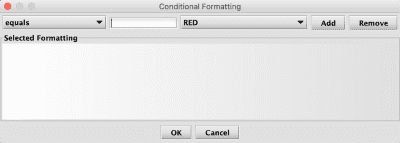
Conditional Formatting...
Selecting Conditional Formatting... enables users to format column color according to a custom filter:
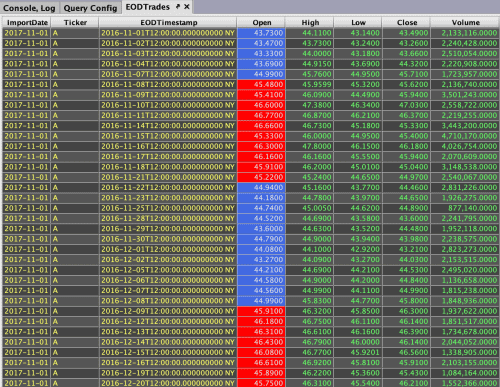
The following example configures conditions for the Open column in the EODTrades table from LearnDeephaven namespace.
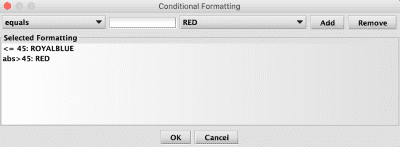
First, choose a condition from the drop-menu:
Then, type the desired value for that condition in the next field. In this case, we've selected the "less than or equal to" condition and specified the value 45. Next, choose a color:
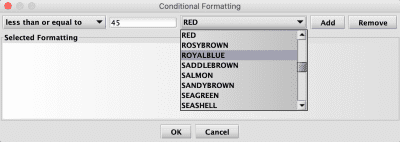
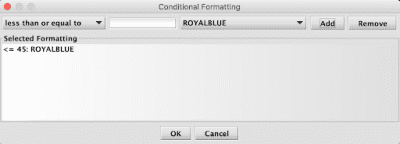
Click Add to save the selections, and OK to apply the formatting options. Any cell in the column with data column matching the filter will be colored royal blue.
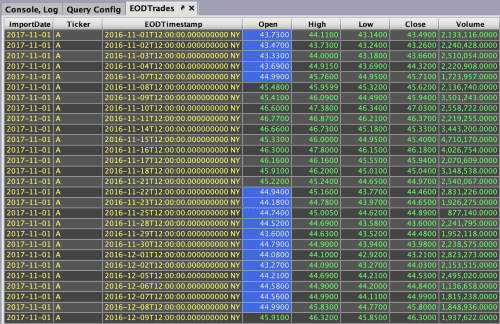
It is possible to add multiple conditions to the same column. For example, we can add another condition to color values above 45 in red, as shown below:
Note that the formatting conditions are applied in the order listed in the dialog. Conditions can be dragged and dropped in the dialog to rearrange them.
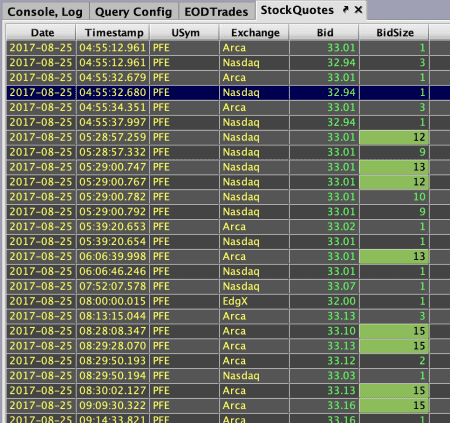
For example, the BidSize column in the StockQuotes tables is configured with two conditions. Because the first filter takes precedence, all values above 10 are colored light green:
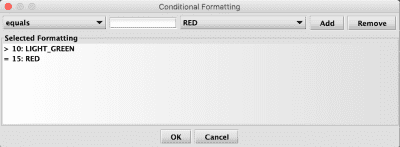
If we rearrange the filters, moving the equals filters to be first in order, all values of 15 will be colored red:
To remove some or all conditions, re-open the Conditional Formatting dialog for that column, highlight the condition, and select Remove.
Note
Formatting defined in the UI will not ignore formatting defined within the query that generates that table.
Go to…
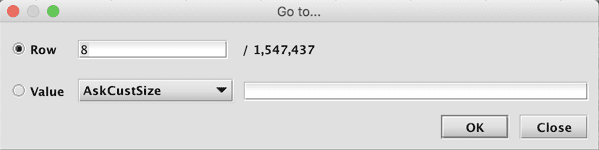
Selecting the Go to… option will open a dialog window that enables users to "go to" a specific row location in the table.
The Go to… dialog windows offer the following options:
When Row is selected, you can enter the number of a specific row to which you want to proceed. (Note: the total number of rows in the table is presented to the right of the Row field.)
When Value is selected, the field will automatically show the value for the row in the column in which you originally right-clicked. However, you can find a value in any of the available columns in the table by using the drop-down list of column names. Depending on the column chosen, you may need to select whether the value in that column should be equal to or contain the value entered, and whether it should match the case used in the column. You can then enter the value desired in the last field.
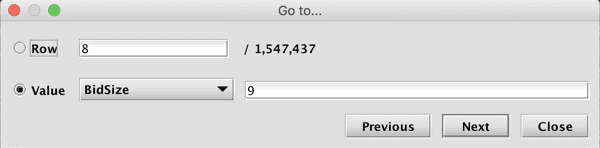
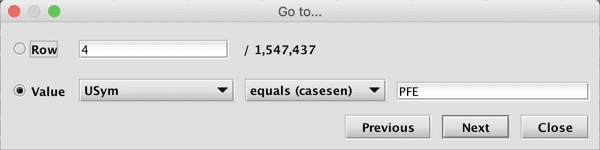
When you click Previous or Next, you will be taken to previous or next row in the table that contains that value.
If a table has a timestamp column and you select the name of that column in the Go to… dialog window, the field to the right of the column name will present a date/time picker.
Values in the field can be changed:
- with your mouse/pointer by selecting a value and then using the up/down arrows at the right side of the field to increase or decrease the values
- by using the left or right arrows on your keyboard
- by using Shift+Semicolon combination to scroll right, or the Shift+Ctrl+Semicolon combination to scroll left
- by using the up and down arrows on your keyboard to increase or decrease the values
- directly typing values into the field
When you click Previous or Next, you will be taken to the nearest matching timestamp.
Tip
Go to is also available:
- in the table data right-click menu.
- by clicking on a specific table and using the keyboard shortcut Ctrl+G (Windows) or ⌘+G (MacOS).
Format
When a column contains numerical data, the Format option can be used to apply special formatting to the data in the column.
Columns that contain Double, Float, and BigDecimal data types can be formatted with the following options:
-
Default - the default formatting for a column of that type
-
Percent - multiplies the column value by 100 and displays the result as a percentage with two decimals; e.g., 0.7550 becomes 75.50%.
-
Basis Points - multiplies the column value by 10^4 and displays the result with no decimals and the suffix bp; e.g., 23.7400 becomes 237,400 bp.
-
Millions - multiplies the column value by 10^-6 and displays the results with three decimals and the suffix mm; e.g., 201653 becomes 0.202mm.
-
Custom - opens the Custom Numeric Format dialog; users can select Decimals (the number of decimal places to show), Exponent (an exponent value by which to multiply the column value, and Suffix (any text value chosen by the user).
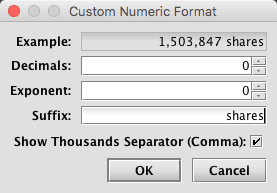
In the example above, the column will display each value with commas and the custom suffix "shares".
Columns that contain Integer, Short, and Long data types can be formatted with the following options:
- Default - see above for description.
- Millions - see above for description.
- Custom - see above for description.
Once a formatting option is selected, it can be saved with the user's workspace by clicking Save in the Console.
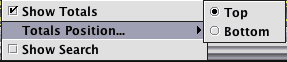
Show Totals
Selecting Show Totals enables users to generate aggregated column values in a table. These are shown in a Grand Totals section, placed at the top of that table by default.
If you right-click in the column header again, the Totals Position option will appear, which enables you to place the totals content at the top of the table or at the bottom.
Note
See: Grand Totals to learn about configuring grand totals via query methods.
Grand Totals
Initially, the information in the Grand Totals section is collapsed, as indicated by the downward pointing chevron icon at the right of the section. Click anywhere within the header to expand the section. To collapse the Grand Totals section again, click the upward pointing chevron icon, or anywhere within the header.
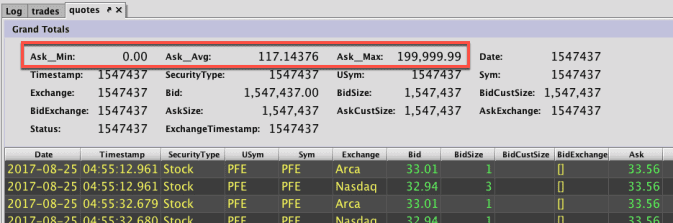
For example, the following screenshot demonstrates the result when the Grand Totals feature is activated using the StockQuotes table in the LearnDeephaven namespace:

All of the values are added together in each respective column. Here, the section includes the sums for the Bid, BidSize, Ask and AskSize columns. However, no results are displayed for the BidCustSize and AskCustSize columns because they contain null values in the table. The other columns in the table cannot be aggregated because they do not contain numerical values.
Totals
The Grand Totals section displays the various column totals for all the data within the table. If you filter the table using the filtering options available in the right-click context menu, an additional Totals section appears.
The Totals section presents the same column(s) and their respective aggregation operations as the Grand Totals section. However, the values shown in the Totals section apply only to the values included in the filtered dataset. Any time you add, remove or modify a filter in the table, the data in Totals section of the table will automatically update.
In the example below, the StockQuotes table has been filtered to show rows when the value in the Sym column is GOOG.
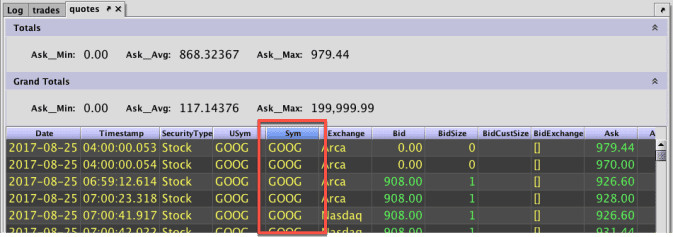
The Grand Totals section and the Totals section both show the same set of three aggregations on the Ask column: Min, Avg and Max. However, because the table was filtered on the Sym column to show only data for GOOG, the Totals section of the table shows those same three aggregations only as they apply to data related to GOOG, whereas the Grand Totals section continues to present three aggregations on the entire table.
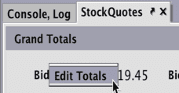
Edit Totals
Right-clicking anywhere within the expanded Grand Totals or Totals section reveals the Edit Totals option:
The Edit Totals dialog provides a selection of options that can be used to aggregate columns in different and multiple ways. The left side shows the available columns in the table, while the right side is used to apply different aggregation methods on specified columns. The arrow buttons at the right allow you to reorder the columns. The Grand Totals and the Totals sections share the same configuration parameters. Therefore, any configuration changes in the Edit Totals dialog will apply to both.
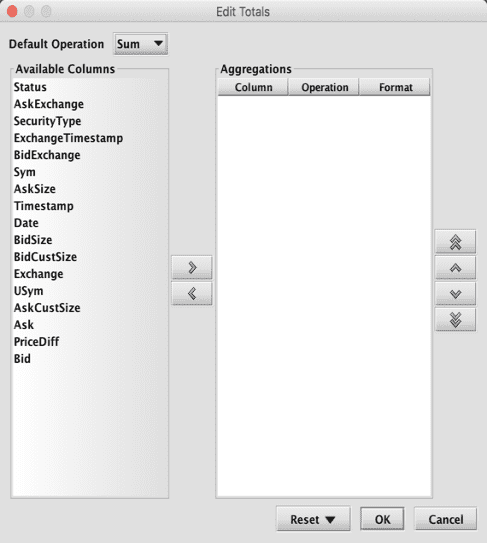
The Default Operation for all the columns is Sum. To select a column for a specific aggregation method, first select the column name from the Available Columns list on the left and then click the button with the right-facing arrow in the center of the panel. That column name will then be moved to the Aggregations side of the window.
When you have moved a column from the Available Columns list to the Aggregations field, you can assign a particular aggregation operation to perform on that column. This is accomplished using the drop-down menu that opens when you click the value listed for that column name under Operation.
When selected, the Operation column will only display aggregations that are meaningful for the data type found in that column. For example, if you select numeric columns such as Ask or Bid, operations will include any aggregations that are meaningful for numerical data, including calculations for sum, average, standard deviation, and more. However, if you select text-based columns such as Sym or USym, you can only choose to count the rows, show the First/Last item in the column, or show the Min (alphabetically first)/Max (alphabetically last) item in the column.
To remove a specific column from the aggregation list, first select the column name from the right side of the window and then click the button with left-facing arrow.
Users may also specify a formatting type by which to display each aggregation by clicking the cell in the Format column for that row.
For example, selecting the cell in the BidSize row in the Aggregations section opens the Enter Formatting Formula dialog:
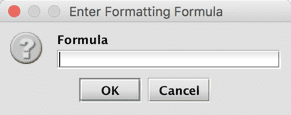
Specifying a format is optional. If the Format field is not set, the total for that aggregation will appear using the default format. Date and Decimal are the only formula types supported, and these share the same arguments as the formatColumns method.
Note
See Numeric Formatting for more information on the available arguments.
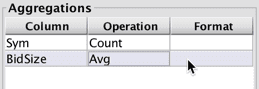
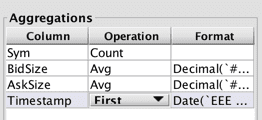
In this example, the average BidSize and AskSize in the Grand Totals section are set to display with two decimal places using the formula Decimal(`###.00`), and the Timestamp is set to show the day of week, month and time using the formula Date(`EEE dd MMM yy HH:MM:ss`).
Columns that are not individually aggregated as described above are also included in the Grand Totals section of the table. However, the same method of aggregation is used for each of those columns. The method used to aggregate those columns is determined based on the value selected in the Default Operations drop-down menu in the Edit Totals dialog. Options include Count, Min, Max, Sum, Var, Avg, Std, First, Last and Skip.
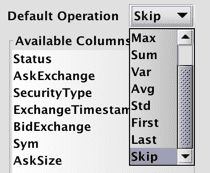
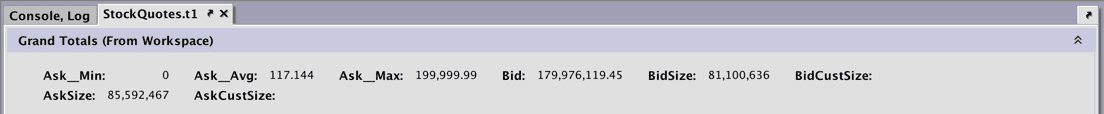
If not set, this will be Sum. In this example, the Default Operation is set to Skip. Only the columns included in the Aggregations field will appear in Grand Totals:

Note
"From Workspace" in the header indicates that the Grand Totals were edited in the user interface, rather than the query language.
Deephaven also enables users to present multiple aggregation methods on the same columns. For example, you want to see the aggregated values representing the minimum Ask value, the average Ask value and the maximum Ask value. This is accomplished by selecting the same column multiple times using the button with the right-facing arrow button, and then applying different aggregation operations for each reference to the same column.
The screenshot below demonstrates how to apply three different aggregation methods to the same column.
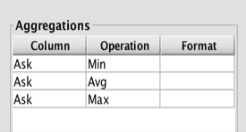
The display will then specify which operation is applied to that total:
The three individually aggregated columns previously specified in the Edit Totals dialog window appear first in order, as noted in the red box. Then, each of the other columns in the table, which have been aggregated using Count, are presented.
If a method is selected in the Default Operation menu that does not apply to a column that was not specified in the Aggregations section, the column will not appear in the Grand Total header. For example, In the previous example, Count was chosen as the Default Operation. Therefore, all columns were presented because the value types in all columns can be counted. Contrast that with the following example of the Grand Totals section when Sum is chosen as the Default Operation.
Only eight columns are visible now, because the data types in the other columns cannot be aggregated with Sum.
The Reset button at the bottom of the Edit Totals dialog allows you to restore both the Grand Totals and the Totals sections to a previous setting. It contains two options:
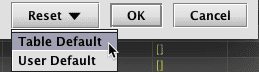
- Table Default restores the sections to the parameters defined when the table was created, or back to Sum if no operations were specified.
- User Default restores the panel to the settings used when the Edit Totals dialog was most recently manually reconfigured. If the user saves the workspace and subsequently reopens the table in another Deephaven session, the user can restore their preferred settings.
Show Search
The Show Search check box is deselected by default.
Selecting Show Search adds a Search Bar to any table in Deephaven that quickly filters a table to any value. Type a term in the text field to search the entire table. If the term is found, the table will present any row that contains that value, regardless of the column in which it is found. The results provided through Search are applied in addition to any filter that has already been applied to the table.
Note
This option may be disabled for all users or for individual tables.
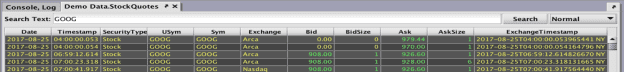
For example, the table below is filtered to only show rows that contain the value GOOG.
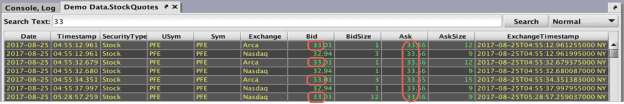
The table below is filtered to only show rows that contain the value 33.
To clear the search results from the table, delete any text in the Search Text field and press Enter or Return on your keyboard.
The drop-down menu to the right of the Search button offers the following options:
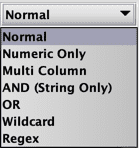
- Normal - This mode searches for letters and numbers only.
- Numeric Only - This mode searches for numerals only.
- Multi-column - This mode returns rows where each value entered is contained in at least one column.
- AND (String Only) - This mode interprets all values typed in the Search field as Strings, and only applies to columns with String values. It returns rows where any columns contain all values entered.
- OR - This mode returns rows where any column contains one of the values entered.
- Wildcard - This mode matches against String values only using the following rules:
- * is a wildcard that matches against zero or of any character; e.g., h*o matches "hello" or "hero" or "ho".
- ? is a wildcard that matches against exactly one of any character; e.g., h?o matches "hio" or "heo".
- Regex - This mode matches against String values only using the Java regex rules. See Java Class Pattern to learn more.
Note
Searches are case insensitive.
Tip
The keyboard shortcuts, Ctrl+F or ⌘+F, also open the search bar.