Exclusive query methods
AutoFilters
An AutoFilter allows users to filter a Deephaven table based on an automatically generated list of unique values found in the column. This feature is enabled for columns through the query used to create the table by applying the .layoutHints method with an autoFilter argument. The syntax follows:
.layoutHints(LayoutHintBuilder.get().autoFilter("ColumnA","ColumnB","ColumnC"))
Note
The columns named in the argument must be separated with commas only, with no extra spaces.
This query generates the t1 table using data from the StockTrades table in the LearnDeephaven namespace, filters the data to show only data from August 21, 2017, applies the layoutHints method, and then creates an AutoFilter for the USym, Exchange, and Size columns.
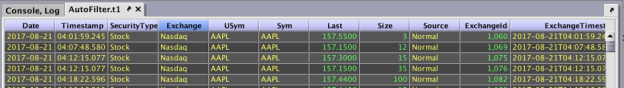
Once the layout hints have been applied, a filter icon will appear when the cursor is hovered over the column heading, as shown in the screenshot below:
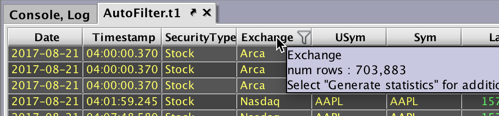
Clicking on the empty funnel icon will change the icon to a filled funnel and will open a pop-up menu that contains a searchable list of the unique items in that column.
Note
If the table is large, the pop-up may take longer to load, and a progress bar will appear to indicate its status. Because the menu is a pop-up (rather than a dialog window), clicking anywhere else in the console will dismiss the filter and cancel the data load.
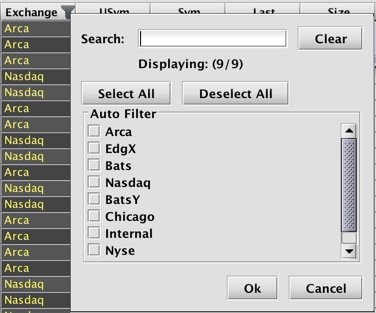
By default, the dialog will return up to 1,000 unique values from the column. In this case, there are only nine unique values in the Exchange column to display.
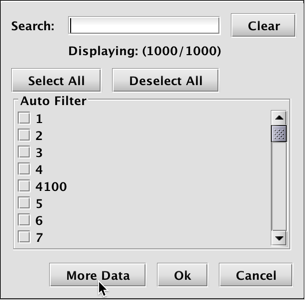
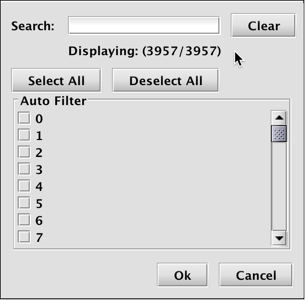
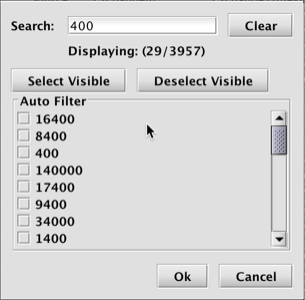
If the column contained more than 1,000 unique values (such as Size), a More Data button would appear. When selected, the menu could then return up to 1 million unique items.
The Search field at the top may also be used to filter the list, which is particularly useful when you have a large number of items.
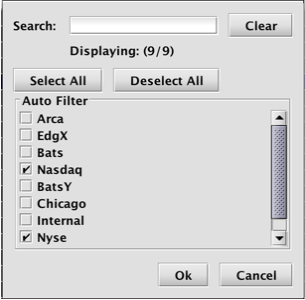
To filter the table, select the items from the pop-up menu and click OK. The table will then be filtered to show only those rows that contain the selected items in that column. The header of the column turns blue to indicate a filter has been applied.
To clear any AutoFilter(s), right-click in the column header and select Clear Filter or Clear All Filters from the drop-down menu.
Optional Properties
As stated above, the default initial fetch size for the AutoFilter dialog is 1,000 unique items. This can be changed globally by modifying the property:
AutoFilterSelectionPanel.defaultInitialFetchSize=[size]
You can also set the maximum fetch size by modifying the property:
AutoFilterSelectionPanel.maxAutoFilterItems=[size]
The fetch size can be set per-column by including this method in your layout builder:
.autoFilterFetchSize("ColName", int size)
Additionally, modifying the maximum cache size property will keep selected values in the cache so that they always appear in the AutoFilter dialog regardless of the fetch size.
AutoFilterSelectionPanel.maxCacheSize=[size]
This property defaults to 100. Cached items appear first (even after they become unselected).
These should be configured in the iris_console and interactive_console stanza.
Aggregating Grand Totals
Users can configure aggregated column values in a table, such as the total sum of values in a column or an average value of a particular column, using the setTotalsTable method in a persistent query. Alternatively. data aggregation can be accomplished through the Deephaven console using the Show Totals option in the right-click context menu. This menu shortcut can also be used to edit total previously configured via query.
Note
See: Show Totals
Note
To build a table that presents aggregated values for one or more columns (filtered or not), users must first import the com.illumon.iris.db.v2.TotalsTableBuilder class. The TotalsTableBuilder class is used to define the default aggregations to be displayed in the Grand Totals and Totals section(s) of a particular table.
The following example creates a table using data from the StockQuotes table in the LearnDeephaven namespace. The final generated table will include the Grand Totals section at the top of the table:
This Grand Totals section (and Totals section if present) will display the average size of the Bid column and the average size of the Ask column.
- The query used for the example did not configure the
setShowGrandTotalsByDefaultargument totrue(see the list of available methods below), so the Grand Totals section will appear in its collapsed state when the table is shown. - The Totals section will only appear if the table is manually filtered.
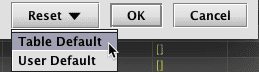
- The parameters set in the query become the Table Default. However, they do not prevent individual users from customizing the aggregations in their workspace using the Edit Totals dialog.
Available methods
The following methods are included within TotalsTableBuilder:
| Method | Description |
|---|---|
TotalsTableBuilder() | Creates a new instance of a TotalsTableBuilder. |
TotalsTableBuilder.get(Table source) | Creates a new instance of a TotalsTableBuilder from a specified Table source. Note that the .get method is unnecessary if your query already designates a source table in previous lines. |
addOperation("ColName", "Operation") | Adds a column operation to the set of aggregations. You can select multiple aggregations on the same column by including distinct addOperation parameters; e.g, addOperation("Bid," "Avg").addOperation("Bid," "Min"). See the list of available aggregations below. |
addOperation("ColName", "Operation", "Format") | Adds a column operation to the set of aggregations, and also a format by which to display the total value; e.g., Decimal(`###,###.###`). Note: only Date and Decimal are supported. |
setOperation("ColName", "Operation") | Sets the aggregation for the specified column. Note that this will replace any other aggregations specified by addOperation(). |
setOperation("ColName", "Operation", "Format") | Sets the aggregation for the specified column, and also a format by which to display the total value; e.g, Date`dd?yyyy!MM-HH:mm:ss.SS %t`). Note: only Date and Decimal are supported. |
setDefaultOperation("Operation") | Sets the default aggregation to apply to columns that have not been explicitly set. If the query writer does not choose an alternative, the default aggregation is Sum. |
setFormat("ColName","Operation","Format") | Sets the format for the designated column and operation. If "Operation" is set to an asterisk ("*"), the specified format string will be applied to all aggregation types for that column. |
setShowGrandTotalsByDefault(<true or false>) | Instructs Deephaven to expand (true) or collapse (false) the Grand Totals section when the table is initially displayed. This will not override a user's workspace settings. |
setShowTotalsByDefault(<true or false>) | Instructs Deephaven to expand (true) or collapse (false) the Totals section when the table is initially displayed. This will not override a user's workspace settings. |
setTotalsTable() | Passes the result of the specified operations to the table. |
Available aggregation operations
The following aggregation operations may be used:
| Operation | Description |
|---|---|
| First | Display the first value of the column |
| Last | Display the last value of the column |
| Min | Display the minimum of the column |
| Max | Display the maximum of the column |
| Sum | Display the total sum of the column |
| Avg | Display the total average of the column |
| Std | Display the standard deviation of the column |
| Var | Display the variance of the column |
| Count | Display the number of non-null items present |
| Skip | Do not display any aggregation information for this column |
Available formatting options
Only Date and Decimal are supported as arguments within the in TotalsTableBuilder methods. The expressions are the same those used to format columns in a table.
Note
See: Numeric formatting