Help within Deephaven Classic
There are four ways to contact Deephaven Customer Support from within the Deephaven workspace.
- Help Button
- Through the Log Panel
- Through the Query Configuration Window
- Sending Thread Dumps to Support
Help Button
The Help button is located in the top right corner of the Deephaven console. When clicked, a drop-down menu provides the following options:
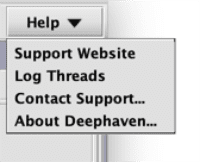
Support Website
When Support Website is selected, the default web browser will open a new window. If there is a connection to the Internet, the Deephaven Help web page (https://deephaven.io/help) will present options to:
- email Customer Support (support@deephaven.io),
- chat with Customer Support, or
- review the Deephaven documentation.
Contact Support
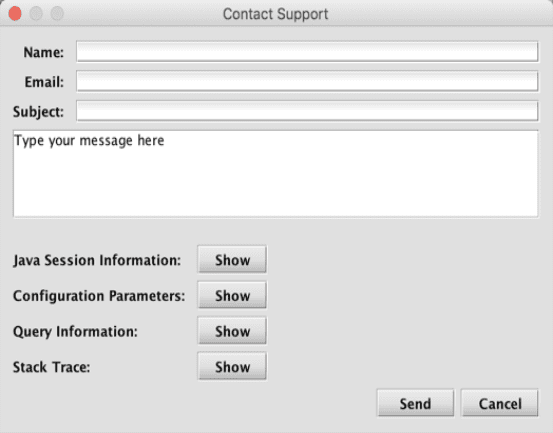
When Contact Support is chosen, a dialog window similar to the following will open:
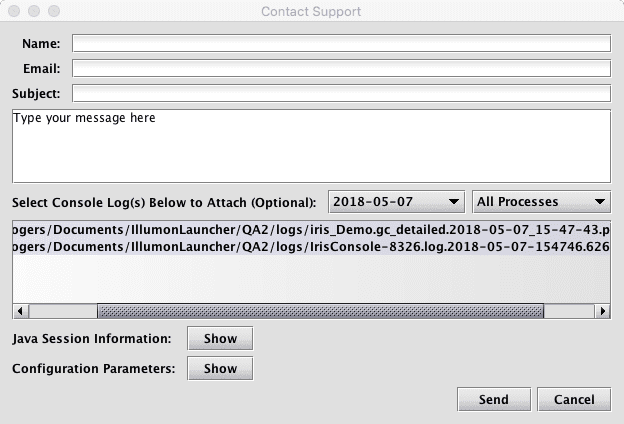
You should first enter your name and email address in the respective fields.
Note
The name and email address may already be completed if you had previously selected the option to auto-populate these fields.
A descriptive subject line should be included in the Subject field, and sufficient details about the issue should be included in the Message field.
It is often beneficial to include the log files associated with an issue being reported. Therefore, a list of log files, sorted by date, is shown below the Message field. To include a specific log file with a support request, click on the file in that list. To select multiple files, click on the name of the first file to attach, hold down the Ctrl key (or ⌘ on macOS), and select additional files as needed.
Session Information and Configuration Parameters are also automatically included with all support requests.
Through the Log Panel
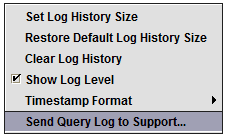
When running a query in Deephaven, the Log panel is typically positioned under the Console window. This log shows information about the queries that previously ran or are currently running in the Console.
To attach this log (the Query Log), right click anywhere in the Log window and select Send Query Log to Support.

You should first enter your name and email address in the respective fields.
Note
The name and email address may already be posted if you had previously selected the option to auto-populate these fields.
A descriptive subject line should be included in the Subject field, and sufficient details about the issue should be included in the Message field.
This option automatically attaches Session Information, details in the Query log, Configuration Parameters and Processor Information. The contents of these fields can be reviewed by clicking Show.
Even though the content presented in the Log window is determined by the settings in the Display Log Levels menu, the Query log attached to this dialog will include the full log.
Through the Query Configuration Window
The Query Configuration window presents all the queries that you are authorized to see. Information about each query is stored in columns, including the owner, the query name, whether it's enabled, its status, etc. If a persistent query has failed, the "Exception Details" column may contain content pertinent to why the query failed.
To read the Exception Details, hover the mouse pointer over the cell. However, this option only allows the review of this content while the tooltip is activated. For other options, right-click on the cell containing the Exception Details for your specific query.
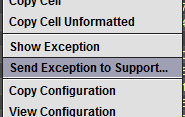
To view the exception details in their own window, select Show Exception.
To open a support ticket, select Send Exception to Support... This will open a dialog window similar to the one shown below:
You should first enter your name and email address in the respective fields.
Note
The name and email address may already be posted if you had previously selected the option to auto-populate these fields.
A descriptive subject line should be included in the Subject field, and sufficient details about the issue should be included in the Message field.
This option automatically attaches Session Information, Stack Trace, Configuration Parameters and Processor Information. The contents of these fields can be reviewed by clicking Show.
Sending Thread Dumps to Support
A thread dump is a collection of information that shows the activity of every thread in the Java Virtual Machine (JVM). This information is particularly useful to technical support personnel because the thread dump can help show where a problem might exist.
There are multiple ways to send your thread dump to Customer Support.
Sending Thread Dump via More Actions
When a console is running in Deephaven, the More Actions button will appear near the bottom right corner of the console window. When clicked, a drop-down menu will appear:
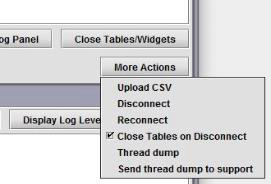
You can view the thread dump by selecting Thread dump, or, you can select Send thread dump to support.
You should first enter your name and email address in the respective fields.
Note
The name and email address may already be posted if you had previously selected the option to auto-populate these fields.
A descriptive subject line should be included in the Subject field, and sufficient details about the issue should be included in the Message field.
This option automatically attaches Session Information, Stack Trace, Configuration Parameters and Processor Information. The contents of these fields can be reviewed by clicking Show.
Note
The thread dump attached to the email will have pulled information from the JVM running on the server that is hosting your console session. This thread dump is helpful when a Deephaven component is not behaving as expected (e.g., is hung or slow). It contains the list of functions the JVM is currently executing and may help Deephaven Support identify the root cause of the issue.
Extracting the Thread Dump via Command Line Tools
On rare occasions, the interface may freeze up. If that were to occur, you would not be able to use the More Actions button to view or send your thread dump to Customer Support. However, you can still extract the thread dump using command line tools found on most PCs.
Once you have obtained the file containing the thread dump information, you can then attach the file to an email and send it to support@deephaven.io.
On a PC
Open cmd prompt, access the directory where the current instance of Deephaven is installed, and then access the bin folder. Run threadDump.bat on the command line. For example:
or
You will need a valid JDK installed, and you will need JAVA_HOME to point to this JDK (your version number will probably be slightly different, but the location will probably be the same)
Optional arguments
These can be combined if desired:
PID=>- If you know the process ID for the running the Deephaven application, you can pass it in with the following:
threadDump.bat "PID=123" - Otherwise, the script will attempt to retrieve a thread dump for every Java process with the word "Deephaven" in the title.
- If you know the process ID for the running the Deephaven application, you can pass it in with the following:
FILE=>- If you want to write the thread dump to a specific file, use the following:
threadDump.bat "FILE=dump04062017.txt" - Note: The default file is named "threadDump.txt".
- If called on the same file more than once, the results will not be overwritten; they will be appended to the end of the file.
- If you want to write the thread dump to a specific file, use the following:
On a Mac
Open a terminal, access the directory where Deephaven is installed (typically ~/iris/.programfiles/<workspace name>), and then access the bin folder. Run threadDump.sh. For example:
You may need to update the permissions of the shell script:
Then run the command to get the thread dump:
If the script cannot find the jstack executable, there will likely be an error similar to the following:
To resolve this, try setting JAVA_HOME to point to a valid JDK (the version number will probably be slightly different, and the location will definitely be different).
Optional arguments:
pid=>- If you know the process ID for the running Deephaven application, you can pass it in with the following:
.threadDump.sh pid=123 - Otherwise, the script tries to get a thread dump for every Java process with the word "Deephaven" in the title.
- If you know the process ID for the running Deephaven application, you can pass it in with the following:
file=>- If you want to write the thread dump to a specific file, use the following:
.threadDump.sh file=dump04062017.txt - The default file is called "threadDump.{CURRENT-DATE-AND-TIME}.txt".
- If the same file is called more than once, the results will not be overwritten; the previous file will be moved to an appropriate timestamped backup-file.
- If you want to write the thread dump to a specific file, use the following: