Table data context menu
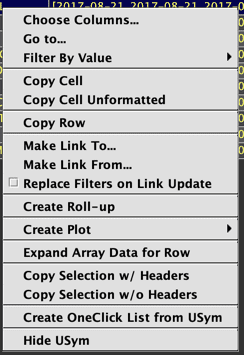
Right-clicking within any cell or row in the table presents the following options.
Choose Columns
When selected in the shortcut menu, Choose Columns opens a dialog window, which allows you to select what fields (columns) you want to show in the table, and to change the order of the columns.
Note
See: Choose Columns
Go to...
Selecting the Go to... option will open a dialog window that enables users to "go to" a specific row location in the table.
Note
See: Go to...
Filter by Value
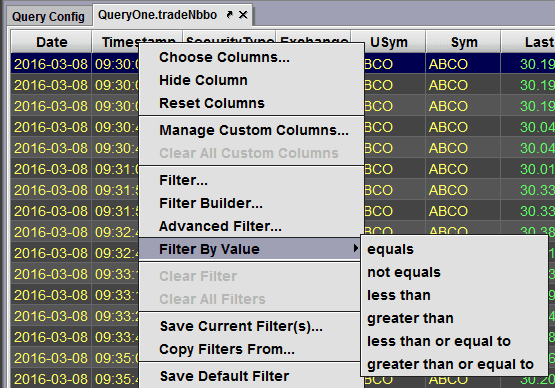
The Filter by Value option appears when you right-click on a cell in the table. The value by which it filters the table is the same as the cell you select in the table, and the operation is dependent on what you choose from the secondary drop-down list.
For example, using the table below, if you right-click in the first row under the Timestamp column header, and then select Filter by Value, the secondary drop-down list will present options for filtering the table based on the value clicked (e.g., 09:30:00.151). If you were to select "greater than", the table would be filtered to show only those values in the Timestamp column that were greater than the value of the cell in which you initially right-clicked.
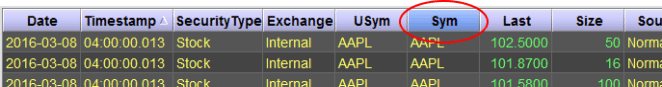
If a filter has been applied to a column (including OneClick filters), the background of the column header will change to a darker shade of blue. For example, the table shown below has a filter applied on the Sym column:
Copy Cell / Copy Cell Unformatted
Right-click on the cell you want to copy and select Copy Cell or Copy Cell Unformatted to copy data to your clipboard for use outside of Deephaven.
- Copy Cell copies the value and any formatting of the data in the right-clicked cell. For example, the Deephaven console shows special formatting applied to the timestamp field. When you use Copy Cell, you are copying the formatted value, just as it is presented in the table. E.g., 12:34:11.090.
- Copy Cell Unformatted copies the raw value; e.g., 2016-03-17T12:34:11.090335000 NY.
Make Link to / Make Link from
These commands refer to the Linked Views feature in Deephaven, which enables a user to interactively filter the content in one Deephaven table based on the content selected in another Deephaven table.
Replace Filters on Link Update
This checkbox refers to the Linked Views feature in Deephaven. When this option is selected, all existing filters will be cleared before applying filters from a Link Update.
Note
See: Linking Tables or Linking Plots
Create Roll-up
You can create a Roll-up Table from any table in Deephaven. Right-click anywhere within the table data and select Create Roll-up.
Note
See also: Configuring Roll-up Tables via query
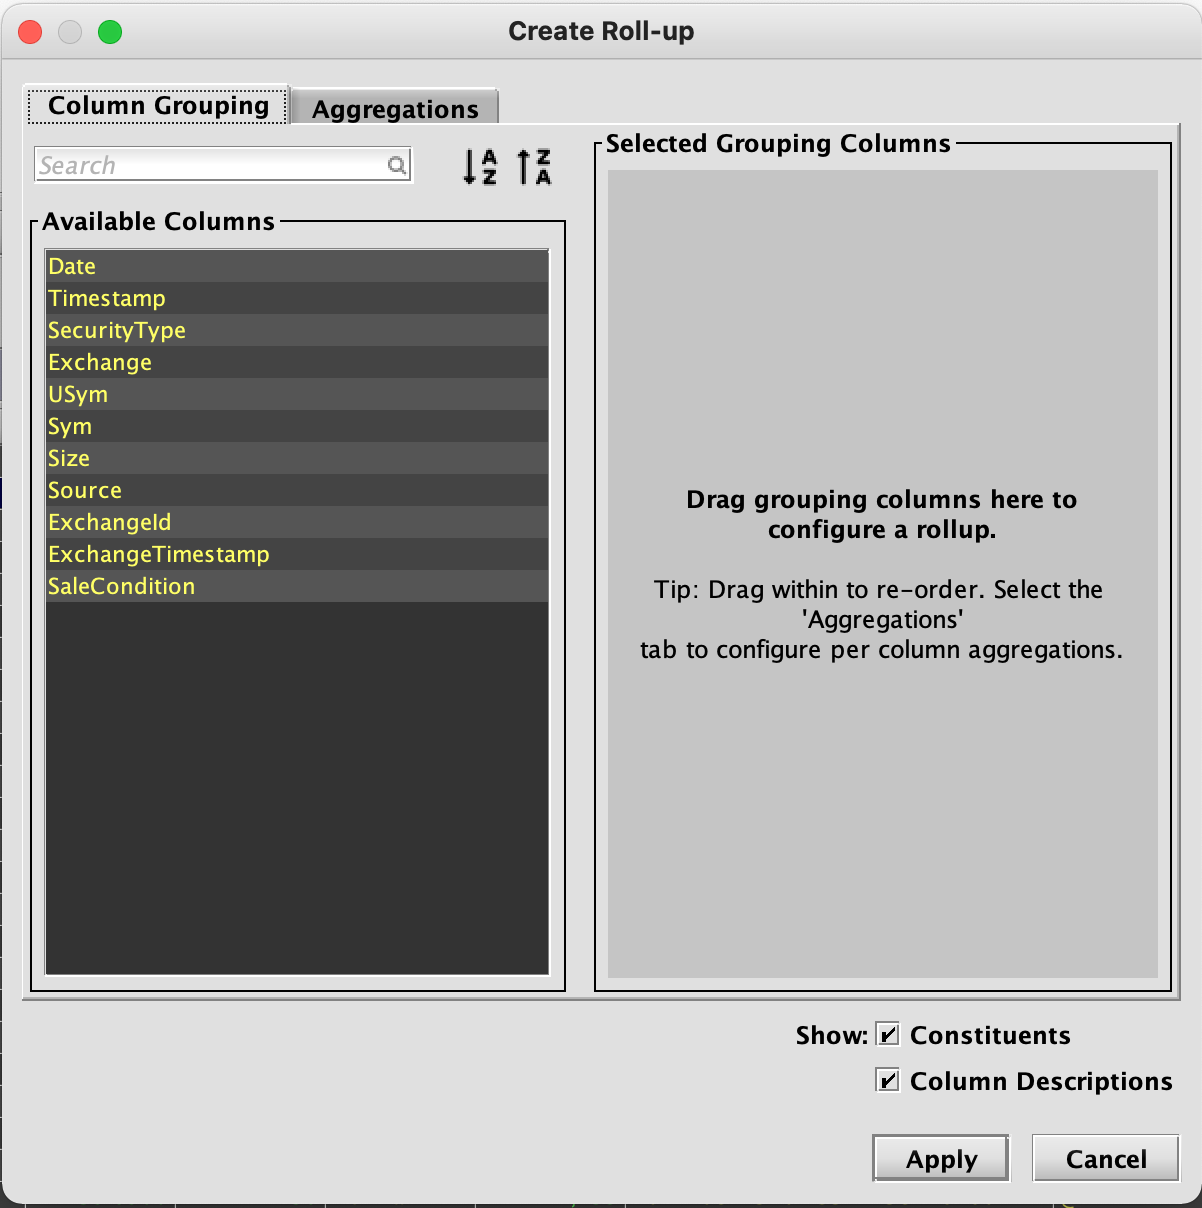
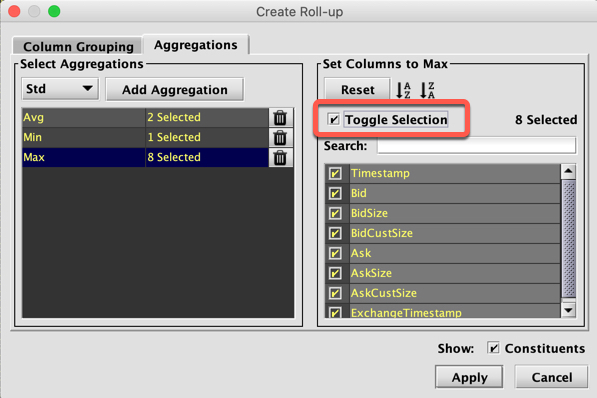
When selected, the Create Roll-up dialog window will present options that can be used to group and aggregate the data in different and multiple ways. The following screenshot below demonstrates the options available when the Create Roll-up feature is activated using the StockQuotes table in the LearnDeephaven namespace:
This window contains two tabs:
- Column Grouping tab controls how the table will roll-up. The left side shows the available columns in the table, while the right side is used to select the column(s) by which to group the table data.
- Aggregations configures the aggregation operations in the resulting Roll-up table.
The Create Roll-up dialog contains two additional options:
- Constituents - When checked, the roll-up table will show what rows from the source table contributed to the hierarchy at the lowest level.
- Column Descriptions - When checked, the column header tooltip will show the aggregation applied to the data.
Selecting grouping columns
The left hand panel in the Column Grouping tab displays the columns which are allowed to participate in grouping.
- Hover over these columns to display the column description, if one was provided by the query writer.
- Use the sort controls to sort the columns alphabetically either ascending or descending, or to reset the order.
- Use the search box to search for a particular column.
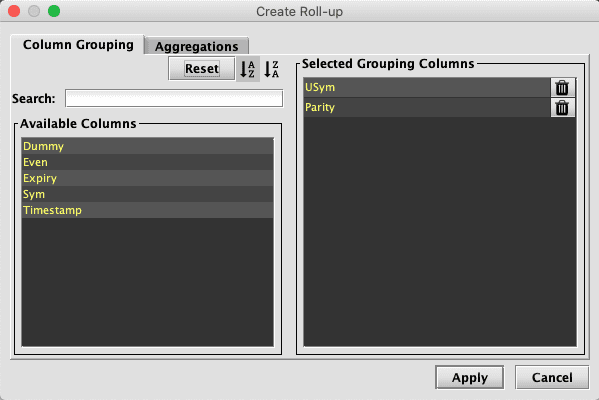
Simply drag the columns from the left hand side onto the right hand side to add them to the set of grouping columns:
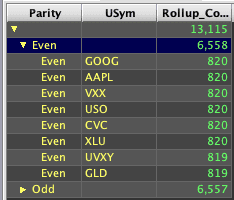
It is important to recognize that the order of the columns defines the order in which the table is rolled up. For example, consider the following two Roll-up tables.
The table below is first grouped by "USym", and then by "Parity":
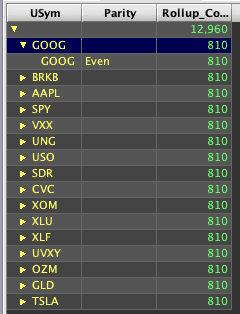
In the next example, however, the table is first grouped by "Parity" and then "USym":
Once you have added columns to the set of selected grouping columns you may double-click and drag to reorder them within the set of selected columns. You may also remove grouping columns by dragging them back to the Available Columns panel, or clicking on the trash can icon to the right of the column name.
Configuring Aggregations
While simply grouping rows from the original table may be useful, Roll-ups become a powerful tool when paired with column-level aggregations. You can do this in the Aggregations tab.
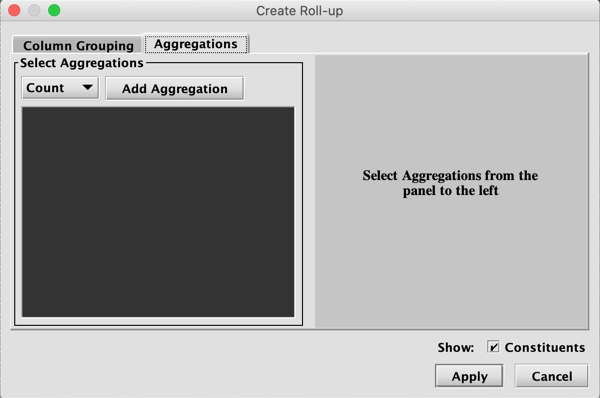
First, select an aggregation from the drop down menu on the left, then click Add Aggregation. This will add a row to the list on the left for the aggregation you selected. Once you have added an aggregation you must then select which columns should be aggregated for each type of aggregation. On the right hand side there is a list of available columns with checkboxes. Simply click on the checkbox to select that column to be aggregated, and check it again to deselect it.
The Operation column will only display aggregations that are meaningful for the data type found in that column. For example, if you select columns with numeric data such as Ask or Bid, operations will include any aggregations that are meaningful for numerical data, including calculations for sum, average, standard deviation, and more. However, if you select text-based columns such as USym or Exchange, you can only choose to count the rows, show the First/Last item in the column, or show the Min (alphabetically first)/Max (alphabetically last) item in the column.
You may select as many aggregations as you like. Clicking on the aggregation in the left hand panel will display the selection for that aggregation on the right hand side. Note: while you cannot use a column again once it is added to the Group By field, you can assign different aggregation operations to the same column.
You may also click-and-drag to rearrange the order of aggregations. This will change the order of the columns in the result table. Aggregations can be removed by clicking on the trash can icon.
You may use the Toggle Selection checkbox to either select all, or select none of the columns.
The search bar and sorting controls function the same way here as they do in the Column Grouping tab.
Selecting Apply will create and display the configured Roll-up, and Cancel will abort the operation and close the dialog.
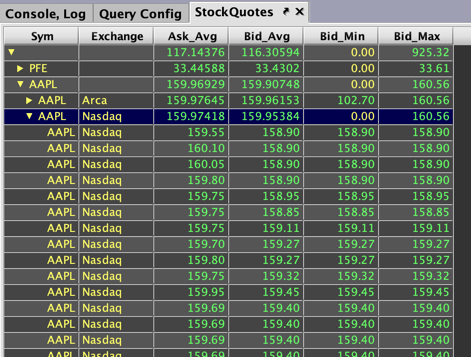
In the screenshot above, the Group By columns are set to Sym and Exchange. So, the Roll-up Table will be grouped first by Sym, then Exchange.
As with any other tables created in Deephaven, the columns in the Roll-up Table can also be sorted, moved, or hidden. AutoFilters applied to columns in the open table in the UI will carry over to the Roll-up Table.
Caution
Only Group By columns may be filtered in a Roll-up Table at this time.
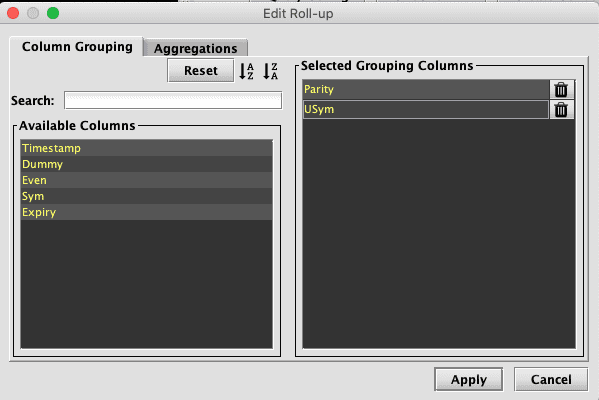
Edit Roll-up Parameters
Once a Roll-up table has been created, further options become available in the right-click table data menu:
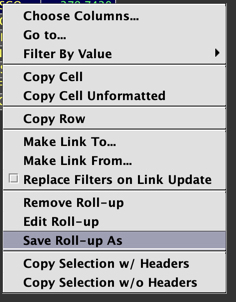
You can edit your Roll-up Table by selecting Edit Roll-up.
This will open the same dialog window used earlier to create the Roll-up Table. Simply make the required changes to your configuration and select OK.
Remove Roll-up from a Table
You can revert to your original table by selecting Remove Roll-up.
Save Roll-up As
You can save and restore a Roll-up table after it has been removed by selecting Save Roll-up As.
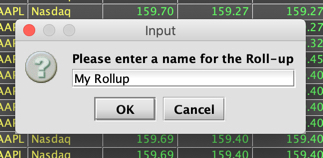
Entering a name and clicking OK will save it to the workspace. After the Roll-up is closed, it can be re applied at any time by selecting Reapply Roll-Up in the table data menu:
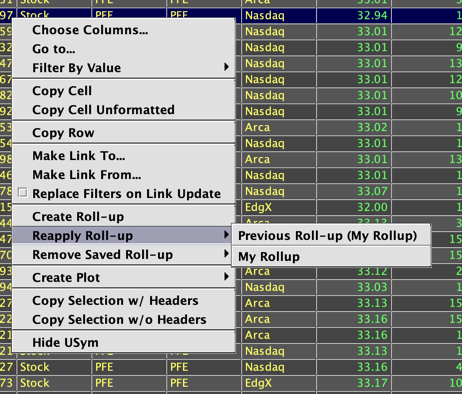
This will reapply your previous Roll-up configuration. However, any sorts or filters applied to the Roll-up table before it was removed will not be restored.
Create Plot
Create Plot allows users to create plots from table data directly from the user interface.
Note
Expand Array Data for Row
Note
This option will only appear in the table data menu when right-clicking a cell with values in an array.
Tables that contain array columns will only show the first 5 values with an ellipsis to indicate the actual dataset is larger. This avoids loading large amounts of data into the UI until it is needed.
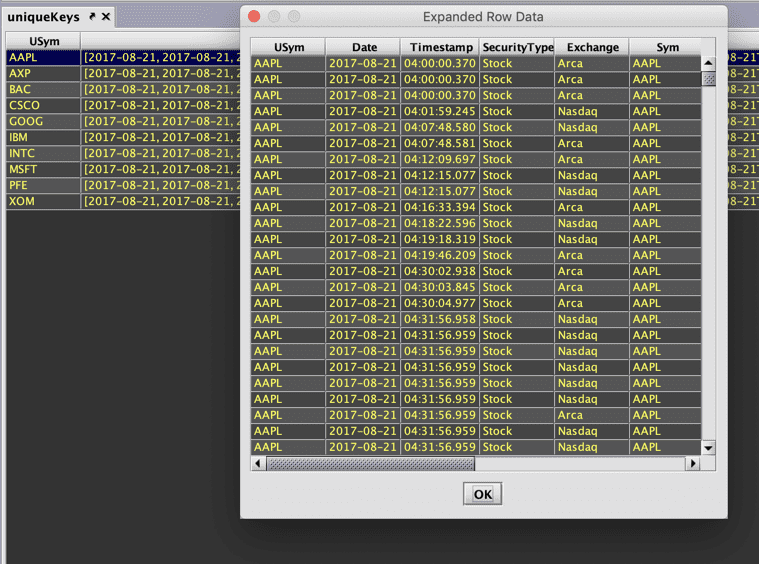
Right-clicking an array column and selecting the Expand Array Data for Row in the shortcut menu opens the Expanded Row Data dialog, which displays the array in a pop-up table, which can be viewed and filtered:
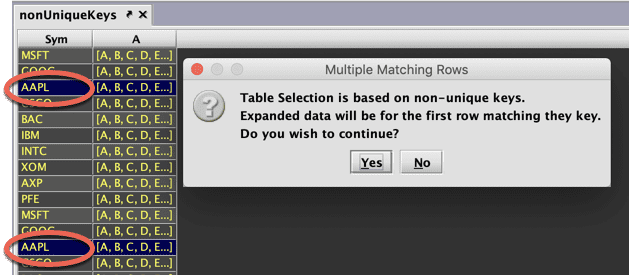
For tables with non-unique keys, the pop-up table will display the row for the first instance of the key:
Copy Selection with Headers / Copy Selection without Headers
You can copy one or more entire rows of data:
- Copy Selection w/ Headers includes the column titles in the content that you copied.
- Copy Selection without Headers only copies the values.
When selecting a row with array values, the following options will become available:
- Copy w/ Array Previews only copies the first few values with an ellipsis to indicate there are more: [1, 2, 3, 4, 5, …]
- Copy w/ Array Expansion copies all the array values: [1, 2, 3, 4, 5, 6, 7, 8, 9, 10].
Create OneClick List
This option creates a OneClick list from the values in the colum the user has highlighted and clicked.
Note
See: OneClick