User Interface
When you open Deephaven for the first time, you will see a blank workspace:
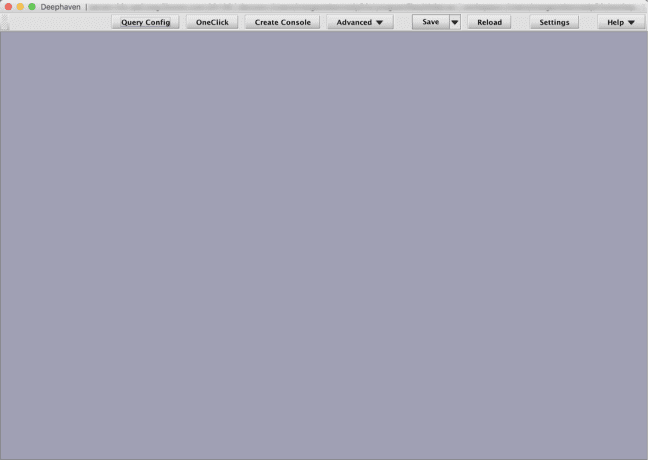
The majority of the interface is reserved for your workspace, where you can view data analyses including tables, plots or other widgets. Depending on the complexity of your workspace, multiple panels may be present, with each panel represented by its own tab at the top of the workspace.
Query Config
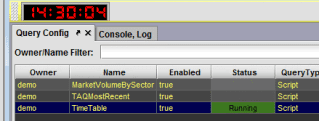
Click the Query Config button to open the Query Configuration window.
The Query Configuration window contains information about all of the persistent queries you are authorized to view in Deephaven. Information about each query is stored in columns, including the owner name, the query name, whether it is enabled, its status and type, etc. You can sort these queries by clicking on the column headers - once to sort in ascending order, twice to sort in descending order.
Note
See: Query Configuration
OneClick
The OneClick menu in the Console provides access to Deephaven's OneClick feature and the Filter View Manager. The OneClick option generates a new window that can then be used for advanced filtering of data in tables and widgets such as plots. Deephaven's Filter View Manager allows users to save a collection of filters, called Filter Views, across an entire set of panels.
Note
See: OneClick Filtering
Create Console
Clicking Create Console opens a new console window in the workspace, which allows you to generate and work with console-based queries.
Note
See: Console
Advanced
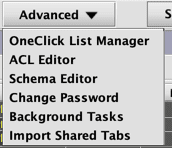
Clicking the Advanced button generates the following options in a drop-down menu, which are described below:
OneClick List Manager
Selecting OneClick List Manager will open the OneClick List Manager window. This window is used to create, edit and delete any OneClick Lists in your workspace. For more information, please see: OneClick Filtering with Lists.
ACL Editor
Selecting ACL Editor will open a dialog box that asks you confirm or create a new name for an DB ACL Editor panel. For more information, please refer to Permissions.
Schema Editor
Selecting Schema Editor will open a dialog box that asks you confirm or create a new name for an Schema Editor panel. You'll also be asked to select the Query Host and the Heap Size, and to include any additional JVM Arguments as appropriate. For more information, please refer to the Schema Editor documentation.
Change Password
Selecting Change Password will open a dialog box that will enable you to change the password you use to log in to Deephaven.
The default password length is eight characters, but your system administrator could have changed this for your installation.
Note
If your organization uses LDAP for authentication, Change Password will not be available as an option in the drop-down menu. In this case, to change your Deephaven password, you will need to use your company's authentication process. Please contact your company's system administrator for additional information.
Background Tasks
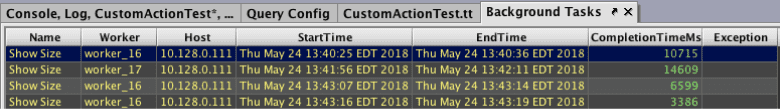
The Background Tasks panel shows Custom Actions that have been executed. As seen below, the panel logs the following information for the Custom Action: Name, Worker, Host, Start Time, End Time, Completion Time (in milliseconds), and any Exceptions if applicable.
Note
See: Custom Actions
Import Shared Tabs
Selecting Import Shared Tabs opens a File Chooser to select any workspace (.xml) file saved on your system. Unlike the Reload button at the top of the console, you can import components of a workspace (e.g., a tab of several tables, or a set of tabs) that will open within your existing workspace.
Note: it is possible to import an entire workspace. However, this will replace your current workspace.
Note
Save
When the main Save button is clicked, Deephaven saves the current layout of your workspace. This includes the number and location of all tables and plots you have open, your formatting preferences such as colors and fonts, and any other configurable option in the workspace. When you open a new instance of Deephaven, the workspace most recently saved by the user in this way will be used.
Clicking the down arrow at the right of the Save button opens the Save As… option, which allows you to name and choose a location for your workspace file.
Every 10 minutes, Deephaven will automatically save the user workspace if any changes have been made. Up to six workspaces can be saved.
Reload
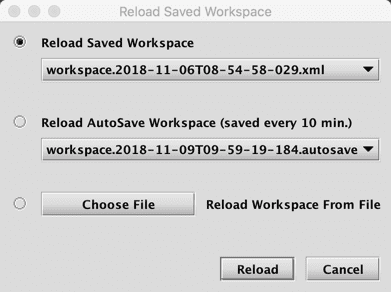
When Reload is clicked, a dialog box will allow the user to choose from manually saved workspace files, automatically saved workspace files, or to bring up a File Chooser to load any workspace file.
Warning
Older versions of Deephaven (Iris) cannot load a workspace with a new version. A newer version of Deephaven will automatically transcode workspace files to the latest version (e.g., V3 workspaces will be automatically updated to V4 when the GUI starts).
Settings
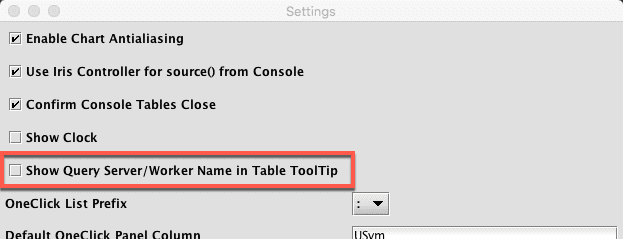
Clicking Settings opens a dialog box with options for changing certain settings established in Deephaven.
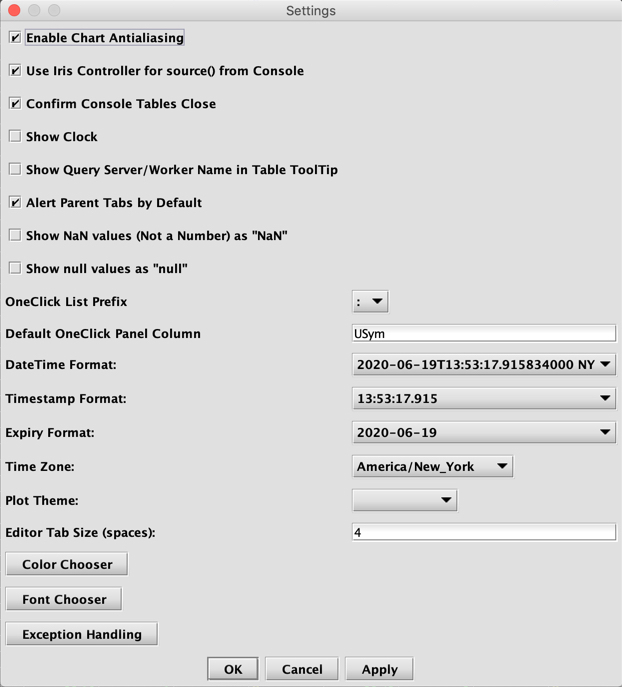
Enable Chart Antialiasing
When checked, Enable Chart Antialiasing provides smoother lines and figures in charts. If you are running Deephaven over VNC or through Amazon Workspaces, you may want to turn antialiasing off. Otherwise, you should leave it turned on, which is the default setting.
Deephaven Controller for source() from Console
Some Deephaven installations allow you to access source code from a local filesystem. If your installation allows this, you should deselect this box when needed. Otherwise, sourced scripts will be retrieved from the Deephaven controller. This setting is turned on by default.
When sourcing locally, the properties IrisDbGroovySession.defaultScriptPath and IrisDbPythonSession.defaultScriptPath control which paths to source from, delimited by semicolons.
Confirm Console Table Close
This setting allows you to control whether or not you want to have the system generate a confirmation window that you need to act upon before closing a table generated by the console. This setting only applies to newly created console tables. It is turned on by default.
Show Clock
Selecting Show Clock enables a clock to be shown in the top of the Deephaven interface. The clock is turned off by default.
Viewing Query Server and Worker Name
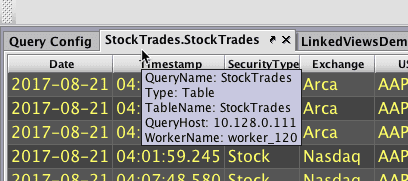
Deephaven allows users to quickly identify the Query Server and Worker that are producing a specific table or plot in their console.
To enable this feature, select Show Query Server/Worker Name in Table ToolTip as shown below.
To see the name of the query server or work for any given table or plot in the Deephaven console, simply hover your cursor over the tab representing that specific item in the Deephaven console. The tooltip for that item will include the following items:
- Query Name
- Type
- TableName
- QueryHost
- WorkerName
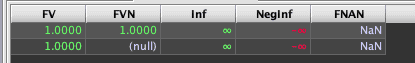
Show Null Values as...
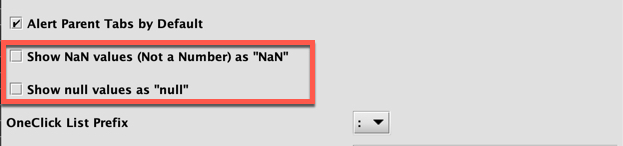
These settings determine how null values will display in your workspace. By default, null values will appear as blank cells. If Show NaN values (Not a number) as "Nan" is selected, null values will appear as Nan in your table. If Show null values as "null" is selected, null values will appears as (null) in your table.
OneClick List Prefix
The OneClick List Prefix is used to distinguish a OneClick List name from an individual value. The default value for the prefix is a colon (:). Other available values include the forward slash (/), the "at" sign (@) and the exclamation mark (!).
Note
Default OneClick Panel Column
When you first use the OneClick feature in Deephaven, the "USym" column is used as the default value in the Column drop-down menu. This setting enables you to change that default value.
Note
See: OneClick Settings
DateTime Format
This setting changes the default style of all DateTime formatting in tables. There are 26 different options from which you can select.
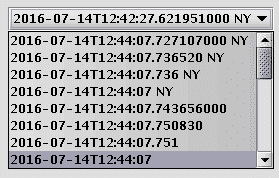
This setting only affects how the DateTime formats are presented in tables generated by Deephaven. When you are writing queries that include DateTime data, you must use a DateTime format that includes the date, the "T", the time and the timezone. As such, we encourage new users to keep one of the top four time formats as their default for this setting.
Timestamp Format
This setting provides the same 26 options as the DateTime formatting, but this setting only applies to the formatting of table columns that have the name "Timestamp".
Expiry Format
This setting also provides the same 26 options as the DateTime formatting. However, this setting only applies to the formatting of table columns that have the name "Expiry".
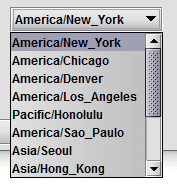
Time Zone
This setting allows you to change the time zone displayed for both the clock (if enabled) and the time-related columns in your data. This setting only affects the time zone displayed. It does not affect how the data is stored in Deephaven.
In the example shown below, America/New_York is the default setting and there are other time options from which to choose. However, the time zones presented may vary in other implementations of Deephaven.
Plot Theme
A theme can be viewed as a predetermined set of fonts, colors and other formatting you can use with any available chart type. Deephaven comes with three different themes, which are named for the background brightness in each: Light, Medium and Dark.
Note
See: Themes
Editor Tab Size
This setting allows you to customize the number of spaces rendered by the Tab key in the Notebook and Persistent Query Script Editor. The default tab size is 4 spaces. The minimum value is 1 space; the maximum value is 10 spaces. When the tab size is changed in Settings, all scripts will update accordingly.
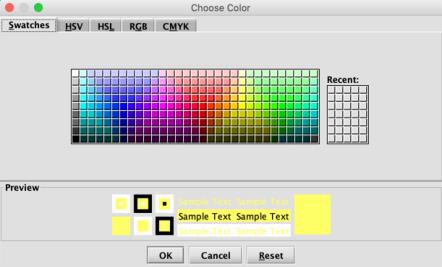
Color Chooser
This setting allows you to customize and personalize the Deephaven interface with color. Options include changing the color of table backgrounds, positive and negative numbers, text, gridlines, highlights and the viewport itself. To make a change, click on the colored box to the left of the label. A new dialog window will open, and you will be able to select a new color from swatches or by keying in values for other color models.
Font Chooser
This setting allows you to further customize and personalize the Deephaven interface. You can change the font for table headers or text, the menu bar, or that used in the console or log panels.
To make a change, click the Text Type drop-down menu, and select the text you want to change. Then select the desired font from the list of fonts available on your system. You can also change the font size and styles.
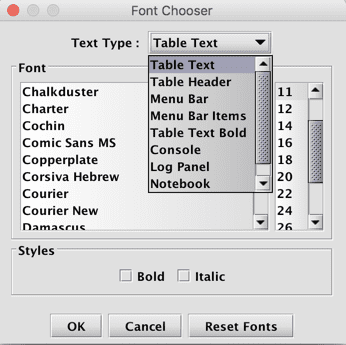
The following text type options are available:
- Table Text
- Table Header
- Menu Bar
- Menu Bar Items
- Table Text Bold
- Console
- Log Panel
- Notebook
- Live Query (Script)
Exception Handling
By default, when exceptions occur the relevant details will open in a dialog in the Deephaven console that must be dismissed. This setting allows you to choose whether or not to bypass the Exception Visualizer Dialog and automatically send exceptions to support. To enable this feature, click Exception Handling and select Automatically Send Exceptions to Support. A username and valid email address is required.
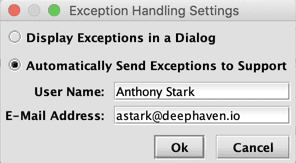
Note that once a ticket is sent, exceptions of the same type are suppressed for 10 minutes. These settings are saved and reloaded when opening your Deephaven workspace.
Help
Clicking Help opens a drop-down box with the following options:
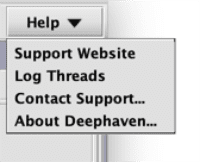
Support Website
Selecting Support Website will open a new browser session (using your default web browser) and load the web page at https://deephaven.io/help. Options for help on that web page include email, chat and a link to the Deephaven documentation.
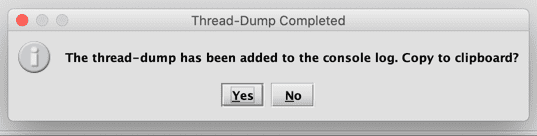
Log Threads
Selecting Log Threads will print a thread-dump (the current state of the system) to the Deephaven console log, and offer the user the option of copying it to the clipboard:
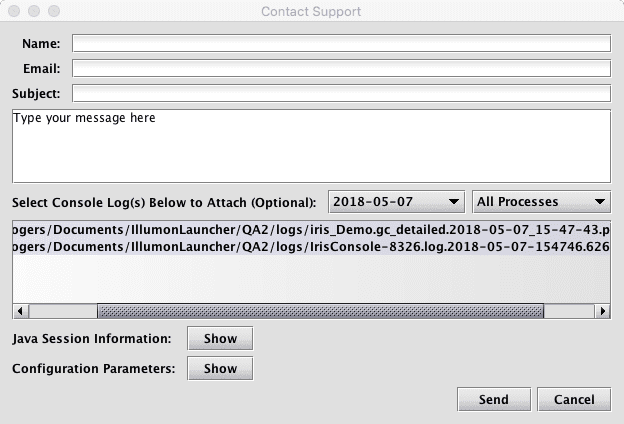
Contact Support
Selecting Contact Support will generate a support request with Deephaven Customer Support, and will present a dialog box similar to that shown below. It offers a convenient way for users to attach log files with their support requests, which, generally speaking, helps identify possible problems and expedite issue resolution.
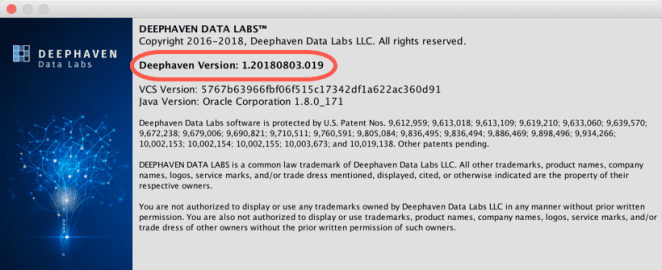
About Deephaven
When About Deephaven is selected, a panel similar to the following will present the version of Deephaven running at your enterprise, as well as various legal information.