Working with tables
Once a table has been created or opened in Deephaven, its content and layout can be further manipulated in the user interface. For example, users can choose to hide or show certain columns, change the column order, resize column widths, filter and/or sort the data in the columns, or add more columns to the table.
Adjusting Column Width
It is possible to adjust the width of individual columns within tables by hovering your cursor over the gap between columns. When you're at the correct location, the cursor will change to a horizontal double-ended arrow with a vertical crossbar. Simply click and hold the mouse to increase or decrease column width and release the mouse button. Columns will auto-size to fit their data, if not adjusted. Sizing a column down all the way will set the column to hidden.
Column Information
Basic information about the content of each column can be reviewed by hovering your cursor over the column name. For example, the screenshot below demonstrates the information available when hovering the cursor over the Ticker column:
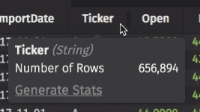
The tooltip shows the column name (Ticker), the data type (String) and the number of rows in the column (656,894). Additional information about this column is available by selecting the Generate Stats option. Generated stats will be calculated automatically for tables with less than 100,000 rows.
Generate Stats
When Generate Stats is selected, the tooltip expands to show additional information about the column:
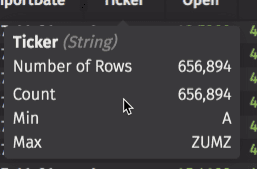
Because this column's data has a data type of String, the generated information includes the Count, Min, and Max values for that column. However, columns containing other data types will present different statistical information.
Renaming tables
You can rename any open table by right-clicking its tab:
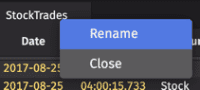
Table Options Menu
The Table Options menu can be opened from any Deephaven table by clicking the icon at the right of the header row:
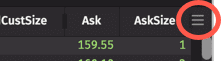
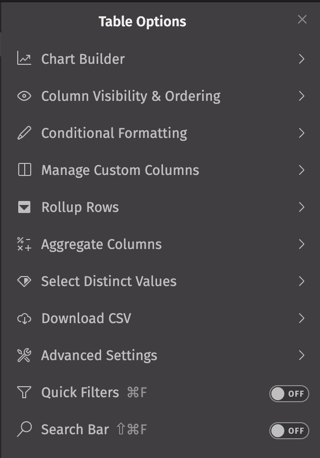
Chart Builder
The Chart Builder allows you to create applicable charts from the table data. This feature is covered in detail in the Working with Plots section.
Column Visibility & Ordering
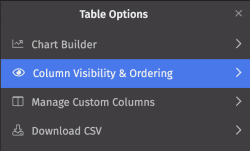
The Column Visibility & Ordering feature allows you to quickly hide/show, rearrange, and sort columns in one place.
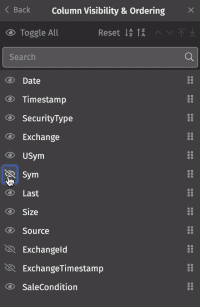
The dialog lists the columns in the table, and the eye icon next to each indicates which columns are visible. As shown below, clicking the icon will show/hide columns. The Sym column is being hidden, and the ExchangeId, and ExchangeTimestamp columns were hidden previously:
Columns can be reordered by dragging and dropping items in the list:
This can also be accomplished using the arrow buttons at the top of the dialog:
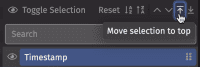
The toolbar includes additional buttons to sort the table in ascending or descending order, and a Reset button to restore the table to its default arrangement.
Conditional Formatting
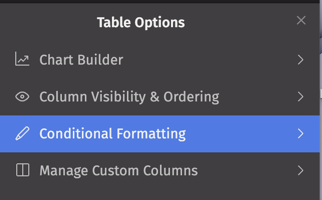
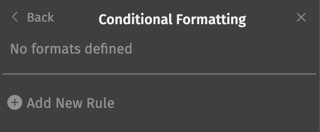
The Conditonal Formatting feature allows you to define conditional formatting of cells or rows by creating new rules.
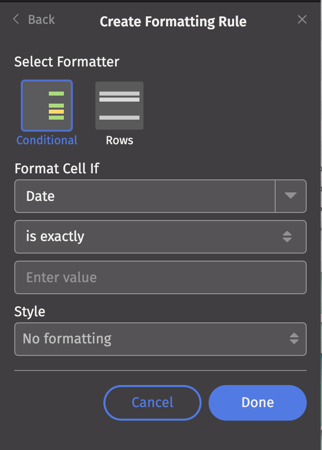
Select Add New Rule, then choose Conditional to format individual cells or Row to format specific rows.
-
Choose a column from the dropdown list provided.
-
Select the desired condition, such as "is exactly", "contains", "starts with", etc..
-
Select a style:
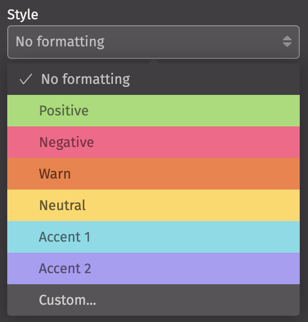
Note that six colors are available by default. The "Custom" option allows you to define your own color.
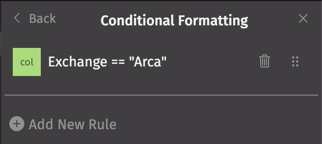
In the example below, all cells in the Exchange column containing the value "Arca" will be colored in the "Positive" style:
Your new rules can be deleted or re-ordered by returning to the Conditional Formatting dialog.
Manage Custom Columns
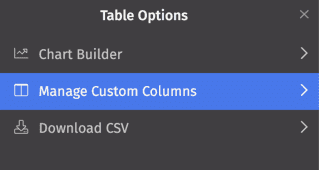
Manage Custom Columns is a feature that enables you to quickly add new columns to house custom calculations directly in the Deephaven interface, rather than updating a table's query.
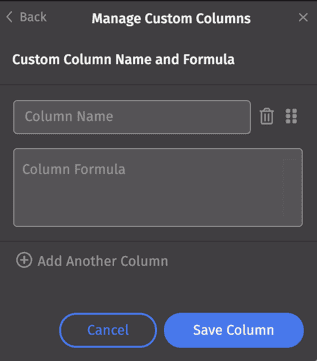
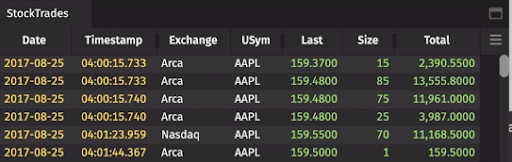
In the Manage Custom Columns dialog, enter the name of the new column, then write the formula below. Select Save Column to add the new column. For example, you could add a new column called "Total" that multiplies the last price and size for each row in the StockTrades table:

Reopen the dialog to edit your selections:
- Other columns and their respective formulas can be added by clicking the + Add Another Column button.
- It may be necessary to arrange the order of your custom columns for calculations to work correctly. To change the order of the new custom columns, click the drag icon (
 ) and drop the column information to the desired position.
 - To remove a custom column, click the trash can button (
 ) to the left of the column name, and select Save Column.
Rollup Rows
You can create a Roll-up Table from any table in Deephaven.
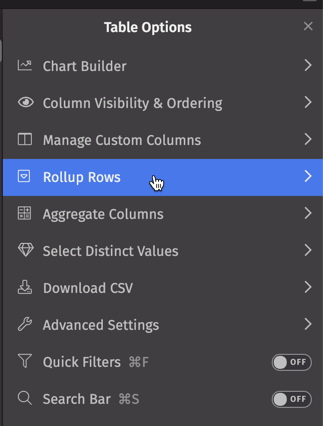
Select Rollup Rows from the Table Options menu, then drag the desired Grouping Column into the box at the top of the dialog:
Multiple grouping columns may be selected. These selections can be reordered or deleted using the icons to the right of the column name.
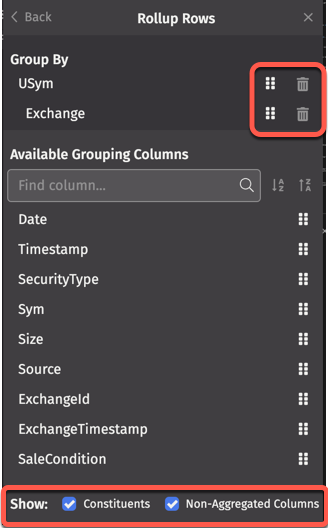
Two Show options are available:
- Constituents - When checked, the roll-up table will show what rows from the source table contributed to the hierarchy at the lowest level.
- Non-Aggregated Columns - When checked, the roll-up table will show all the columns in the source table. When unchecked, the roll-up table will only show columns with either a grouping or aggregation applied.
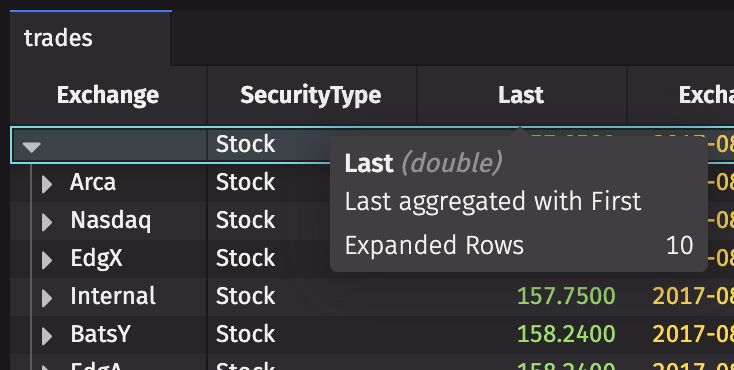
When hovering over a column header, a tooltip will display showing which aggregation has been applied to the column. For example, the tooltip for the Last column is shown below:
Aggregate Columns
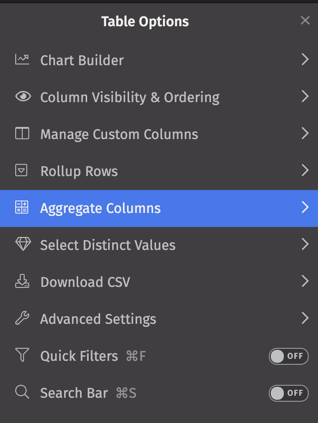
Aggregate Columns is a feature that adds a totals row to the selected Deephaven table, which can be configured to show one or more aggregations.
Select Aggregate Columns from the Table Options menu. The Aggregate Columns dialog allows you to choose among several aggregation operations. See below for details.
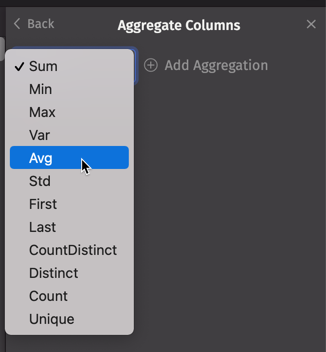
Choose an operation from the drop-down list, then click Add Aggregation. The totals row will automatically be added to the Deephaven table. In the example below, the Avg aggregation is selected.
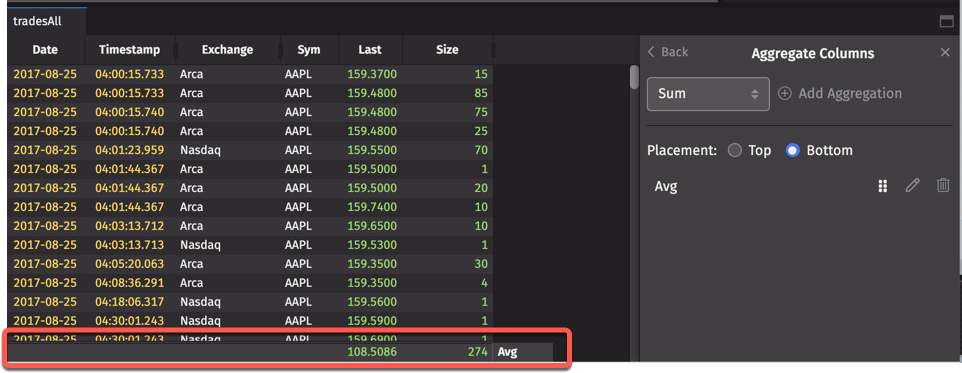
The row may also be placed at the top or bottom of the table.
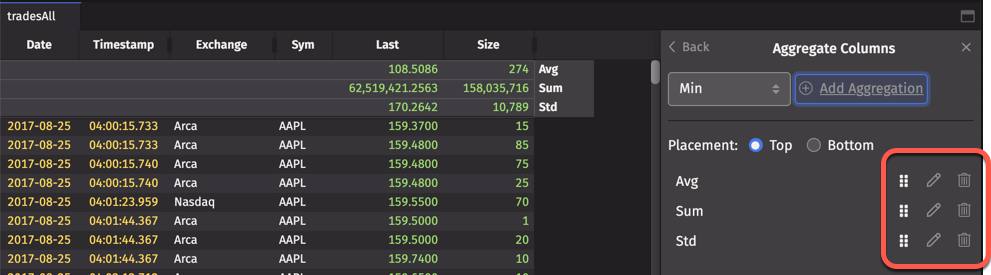
Multiple aggregations can be selected. These can be reordered, edited, or deleted using the icons at the right of the aggregation type.
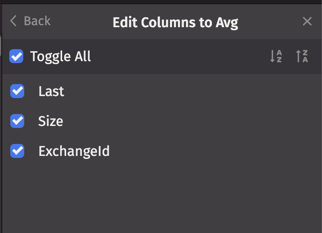
When the Edit icon is selected, users can choose which applicable columns to apply the aggregation to. For example, three columns were averaged in the example above, but a user can deselect (or reselect) columns to include in the totals:
Aggregated roll-up tables
The Aggregate Columns feature can be applied to any Deephaven table, including roll-ups. As shown below, the columns in the Roll-up table will identify which aggregation operation is being applied.
Available aggregations
| AggType | Description |
|---|---|
| Sum | Displays the total sum of the column |
| Avg | Displays the total average of the column |
| Min | Displays the minimum of the column |
| Max | Displays the maximum of the column |
| Var | Displays the variance of the column |
| Std | Displays the standard deviation of the column |
| First | Displays the first value of the column |
| Last | Displays the last value of the column |
| CountDistinct | Displays the number of unique values in each group |
| Count | Displays the number of non-null items present. Only available in roll-ups. |
| Unique | Displays the singular value from the column if it is unique, or a default value if none are present, or it is not unique. |
Select Distinct Values
The Select Distinct Builder modifies a table to show unique values from a selected column. This produces the same result as the query method .selectDistinct("Column").
Note that filters previously applied to the table will be reset.
Select Select Distinct Values from the Table Options menu. The dialog allows you to choose a column from which to display unique values. Additional columns may be added. Selections can be deleted using the trash icon to the right of its name. Deleting all selection restores the table to its original state.
Download CSV
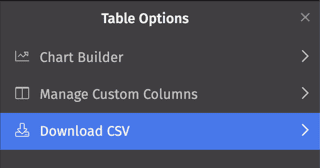
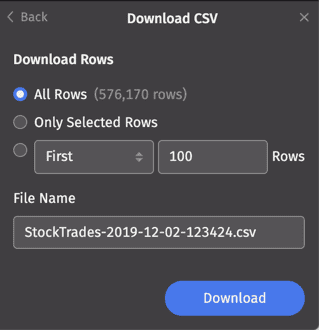
You can download all or some of the rows in a Deephaven table into a CSV file to save on your local computer.
Choose from the following options:
- All Rows - This downloads the entire table. The number of rows appears in parentheses.
- Only Selected Rows - This downloads only the rows you have highlighted in the table. When rows are selected, the number of rows appears in parentheses.
- First/Last - This downloads rows from the start or end of the table. Select First or Last from the drop-down menu and specify an amount of rows.
A file name is automatically generated, but you can rename the file in the File Name field. After you click Download, the CSV file will save into the default location on your local computer.
Advanced Settings
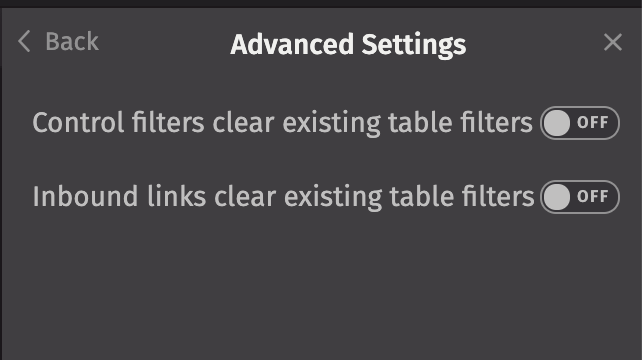
Under Advanced Settings, two options are available:
-
Control filters clear existing table filters - Control filters are applied by a control, such as an input filter or dropdown filter. Setting this button to "On" will allow control filters to clear / override any filters previously applied.
-
Inbound filters clear existing table filters - Inbound filters are applied to a table by the Linker tool. Setting this button to "On" will allow inbound filters to clear / override any filters previously applied.
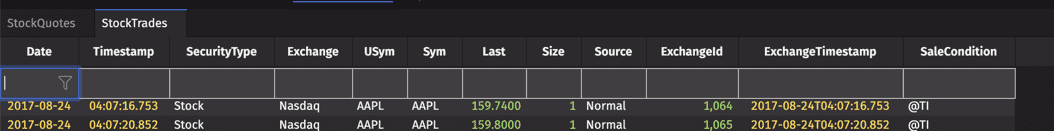
Quick Filters
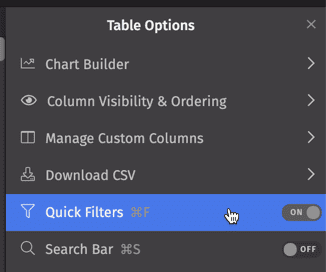
When the Quick Filters button is set to On, the Quick Filters bar will be added to that table:
Tip
You can also open or close the Quick Filters bar using the keyboard shortcut Ctrl+F or ⌘F.
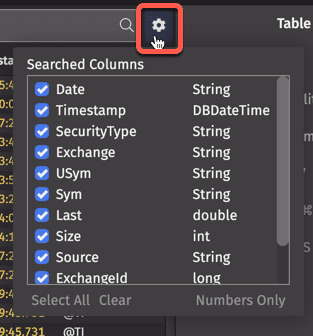
Search Bar
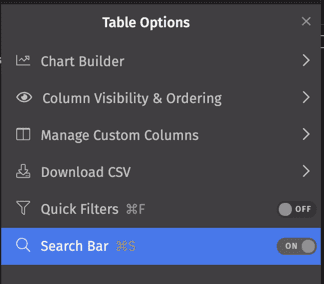
When the Search Bar button is set to On, the search bar will be added to that table:
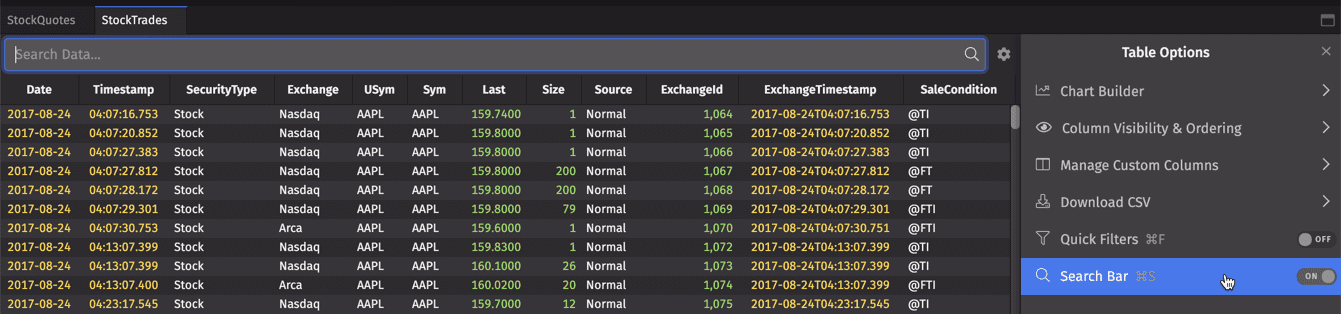
By default, all columns will be searched for your term. You can configure cross-column search using the Settings dialog at the right of the search bar:
Tip
You can also open or close the search bar using the keyboard shortcut Ctrl+S or ⌘S.
Table Context Menus
Dashboard tables contain several context menu shortcuts to help speed analysis. To access these menus, simply right-click on the applicable part of the interface, as described below.
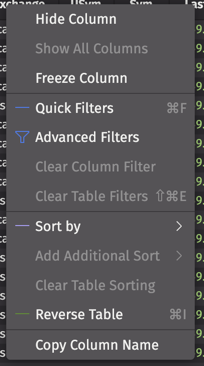
Column Headings Context Menu
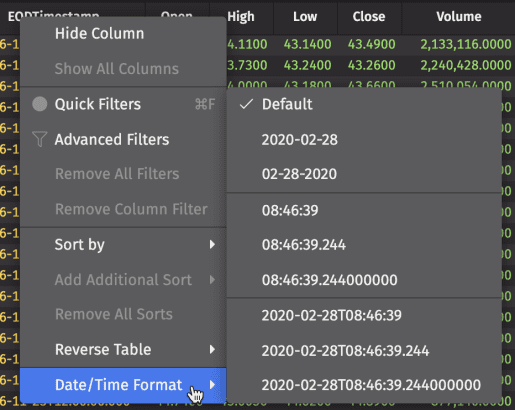
The screenshot below demonstrates the context menu revealed when a right-click is performed on a column heading. In this case, the EODTimestamp column was selected for the right-click.
-
Hide Column/Show All Columns - Selecting the Hide Column option removes that column from the table display. The Show All Columns option is only available when a column has previously been hidden from view. When selected, all hidden columns are returned to their original location in the table.
-
Freeze Columns - Selecting this option will freeze the column to the left side of the table so it will stay in view while scrolling horizontally.
-
Advanced Filters - Selecting this option opens the Advanced Filters dialog window. See Filtering Tables.
-
Quick Filters - Selecting this option opens a new toolbar on top of the table. See Filtering Tables.
-
Remove All Filters - Selecting this option clears any filters applied to the table.
-
Remove Column Filter - Selecting this option clears a filter applied to that individual column.
-
Sort by - Selecting this option provides sorting methods for that column. See Sorting Tables.
-
Add Additional Sort - Selecting this option adds an additional sort to that column. See Sorting Tables.
-
Remove All Sorts - Selecting this option removes all sorts applied to that table.
-
Reverse Table - Selecting this option reverses the entire table's order. See Sorting Tables.
-
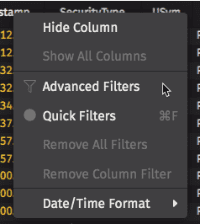
Date/Time Format - Because the selected column contains a DateTime data type, an option to set the Date/Time Format is also available from this context menu. When selected, the secondary context menu provides the following options:
If the right-click occurs on a column containing numerical data, the Number Format option becomes available from the context menu, as shown below:
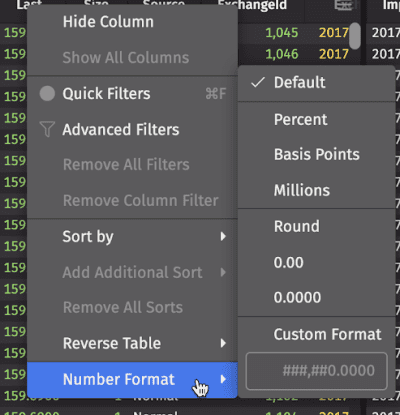
Table Data Context Menu Options
The following context menu shortcuts are available when you right-click on table data:
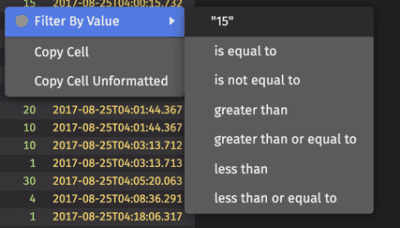
- Filter By Value - This context menu provides six options to filter the column based on the value of the table cell where the user right-clicked.
- Copy Cell/Copy Cell Unformatted - This option copies the cell's data with formatting to the clipboard.
- Copy Cell Unformatted - This option copies the cell's data without formatting to the clipboard.
Filtering Tables
Advanced Filters
As the name implies, the Advanced Filters feature provides advanced options to filter data in a table. The Advanced Filters dialog can be accessed through the right-click menu on column headings:
Tip
Note: Advanced Filters can also be accessed by clicking on a column's funnel icon within the Quick Filters bar. See Quick Filters below.
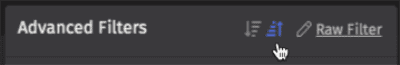
Sorting options
The top of the Advanced Filters window provides two buttons that allow users to sort the entire underlying table based on the column selected. You can sort the table in descending or ascending order by clicking the appropriate button:
Enter value(s)
Immediately below the name of the column being filtered is a selection menu that provides options for filtering the data in the selected column. The filtering options available in the Advanced Filters menu depend on the data type of the column selected.
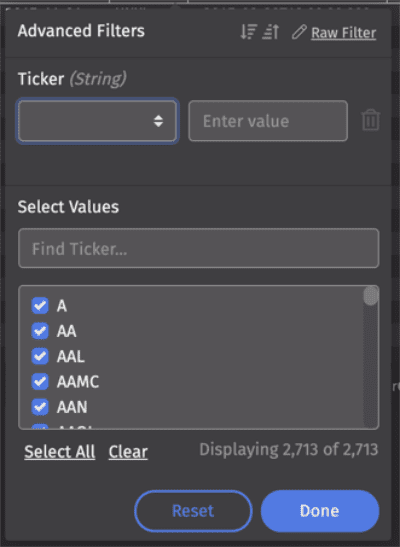
In this example, the Ticker column contains the String data type, as shown below:
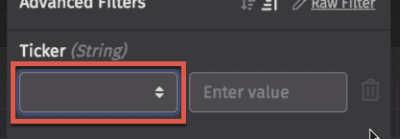
Clicking in the menu reveals the filtering options available for this column type (String):
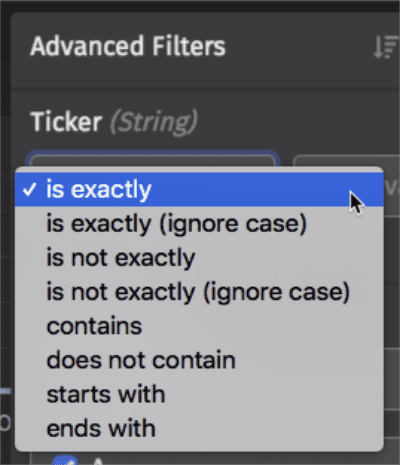
Note
The filter options for other data types may differ from the choices shown above.
Once the filter option has been selected, enter a value in the field to the right of the filter you just chose. In the example below, AAPL is the filter value.
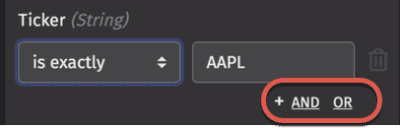
After the value is entered, the underlying table is filtered accordingly.
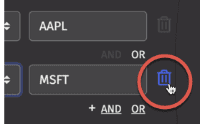
You can filter the table by a secondary value by clicking on the AND or OR buttons just below the value field (circled above).
Selecting either of them will add a new filter set to the dialog window. In the example below, a second filter has been added for MSFT using the OR option.
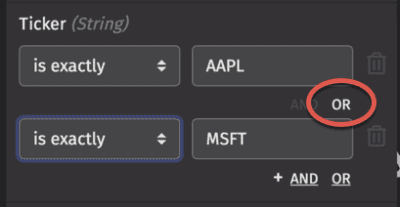
When this filter set is applied, the table will only present rows of data that include Ticker values equal to AAPL or MSFT.
Filters can be removed from the dialog by clicking the trash can icon to the right of the filter value:
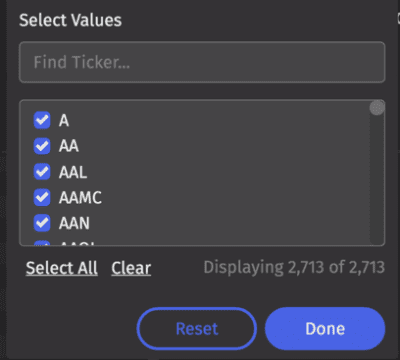
Select value(s)
The lower portion of the Advanced Filters dialog enables users to filter the underlying table by selecting specific values. Users can search for a value in the *Find Ticker... field, or scroll through to select or deselect specific values found in the column.
Ordering
The upper and lower portions of the Advanced Filter work conjunctively - they both filter the same column. However the upper portion of the Advanced Filter is processed first. Therefore, if you filter a table using the upper filter criteria, the filtering specified in the lower section will be applied to the table after it has been filtered by the upper portion.
Removing filters
- If you want to clear all filters, selecting the Reset button will remove all filters.
- You can also remove one or all filters by using the Column Header right-click menu.
Quick Filters
The Quick Filters option is available through the right-click menu on column headings, or by pressing Ctrl+F or ⌘F on the keyboard.
The Quick Filter bar is intended to be an easy way to create a simple column filter. It allows you to perform basic equal-to, less-than, greater-than, etc. types of filters in columns. Each field in the Quick Filter includes a text box and and a "funnel" icon. Simply enter any of the applicable filter statements into the text field at the top of the desired column.
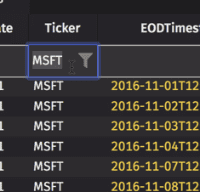
For example, typing MSFT into the text field at the top of the Ticker columns will filter that table to show only rows where the Ticker equals MSFT:
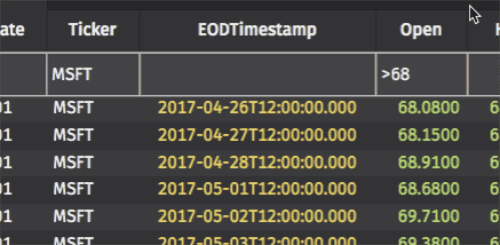
Multiple Quick Filters can be applied to the table by typing additional values into the text field at the top of other columns. For example, the image below shows the same table with a second filter statement in the Open column where the value is greater than 68. Only those rows meeting both of those conditions are returned in the table.
The filter statement options available in Quick Filters are based on the data types in each column being filtered. Please refer to the Quick Filter Statement Options in the Appendix for a complete list.
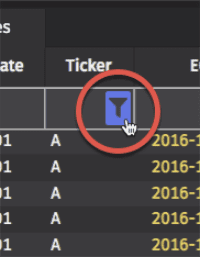
(More advanced filtering can be accomplished using Advanced Filters.) For quick access to the Advanced Filters menu, select the funnel-shaped icon in the column header field as shown below:
Sorting Tables
Values in a table can be sorted in ascending or descending order by clicking on a column heading:
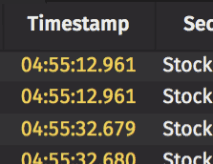
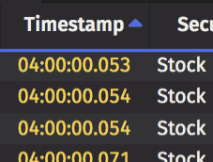
- Clicking once on a column heading sorts the table data in ascending order based on the content in the column selected. When the table is sorted in ascending order, a blue "up" arrow will appear to the right of the column name.
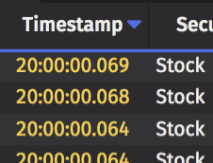
- Clicking again on the column heading changes the sort to descending order. When the table is sorted in descending order, a blue "down" arrow will appear to the right of the column name.
- To clear the sorting order, click the column header one more time.
A blue underline displays across the bottom of the column heading row anytime a table is sorted.
| Unsorted | Sorted Ascending | Sorted Descending |
|---|---|---|
 |  |  |
Sorting options are also available the in Advanced Filters dialog.
Sorting Menu
Sorting options can be accessed through the right-click menu on column headings. The example below shows options for a column named "Ticker":
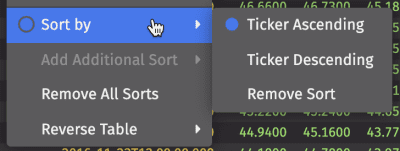
- If another column has already been sorted, the Add Additional Sort option becomes available on the remaining columns in the table.
- Selecting Remove All Sorts clears any sorts that have been applied to the table.
Reversing Table Order
Users can reverse the order of the rows in an entire table, where the last row becomes the first row and vice versa.
To reverse a table, right-click on any column header in the table and select Reverse Table from the sorting menu:
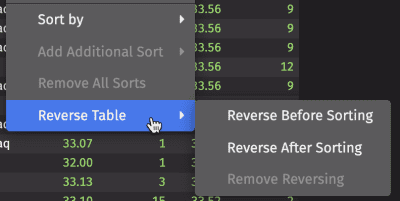
- Reverse Before Sorting - Selecting this option reverses the table order immediately. This reversed table can then be manually sorted as many times as needed.
- Reverse After Sorting - Selecting this option reverses the order of rows after manual sorting methods are applied. When more than one manual sorting operation is applied to the table, all sort operations are sequentially applied to the unaltered table before returning the rows in reverse order.
- Remove Reversing - Selecting this option restores the order of the original table. If manual sorting has been applied to the table before this option is chosen, those sorting results remain visible in the table.
In the example below, the StockQuotes table has been reversed as indicated by the green bar:
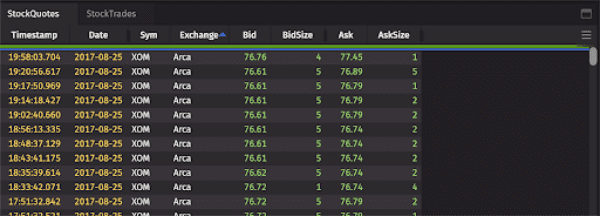
The table is also sorted on the Exchange column; the green reverse table bar sits above the blue sort bar to indicate the table was reversed before sorting. If the Reverse After Sorting option is chosen, the green reverse table bar would move below the blue sort bar.