Launch and learn the Swing GUI
Deephaven Classic (the Java Swing client) is a legacy user interface that some users still find valuable. New users should contemplate using the Swing client if:
- They have many data-onboarding tasks, as the ingestion wizards today exist only in Swing.
- They are responsible for changing Access Control configurations.
- They have a need to spread the UI across many monitors, as browser apps are awkward for that and use many local resources to support it.
- They are interested in using editable Input Tables and Pivot Widgets.
Installing Deephaven Classic
Deephaven Classic can be accessed via RDP to the provided virtual Windows Desktop.
The host will be provided to you. Once Deephaven Classic has been installed at that location, it can be launched by double-clicking the Deephaven icon in the upper left corner, as shown below.

Click Launch in the following window to access Deephaven.

After the appropriate files have been accessed and downloaded, you can login with your username and password.
Creating a Workspace
Deephaven Classic allows you to build customized workspaces. These are equivalent to "Dashboards" in the web version of Deephaven. In contrast to the web, however, users cannot inherit Dashboards “shared with me” in Swing.
After logging in to Deephaven, you'll see a completely blank workspace.
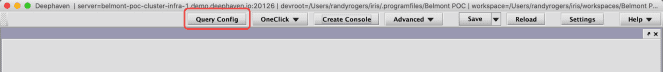
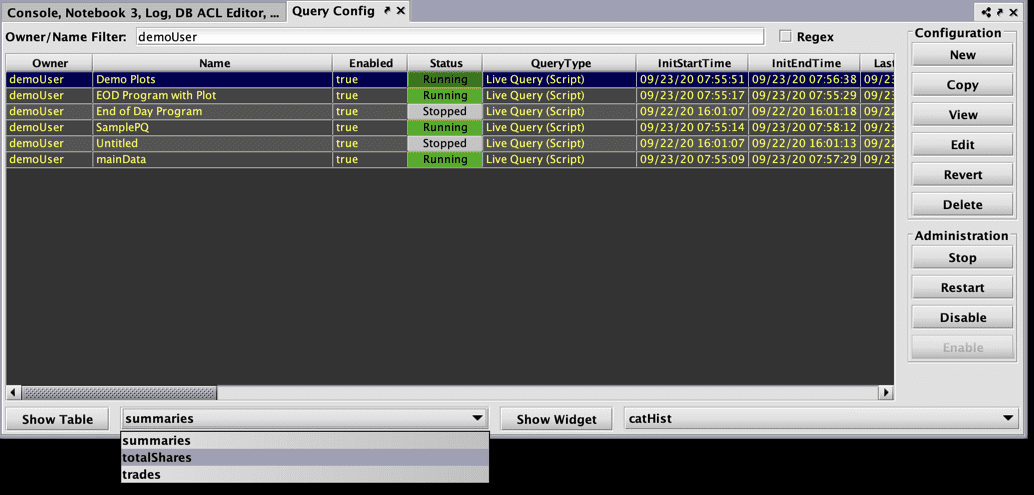
Click the Query Config button (highlighted above) to access the list of available Persistent Queries. Query Config allows you to open tables and plots to create your workspace. The buttons at the right make clear that from here one can also create, view, configure, and edit persistent queries.
To see the tables or plots associated with a Persistent Query, select the query name and then select Show Table and Show Widget buttons (at bottom of the UI) to display those objects in the workspace.
Launching a Console
Consoles are used to interrogate data, perform ad hoc analysis, and develop persistent queries. What Deephaven Classic calls a “Console” is fundamentally the same as the “Code Studio” in Deephaven's web interface.
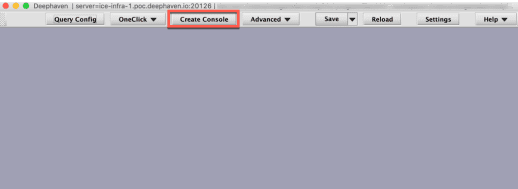
To get started, click Create Console at the top of the interface.
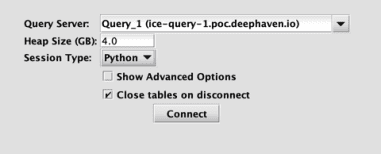
Choose the query server to resource, the amount of Heap (in GB) to allocate, and whether you want a Groovy or Python session.
Once connected, you can start writing queries in the Console:
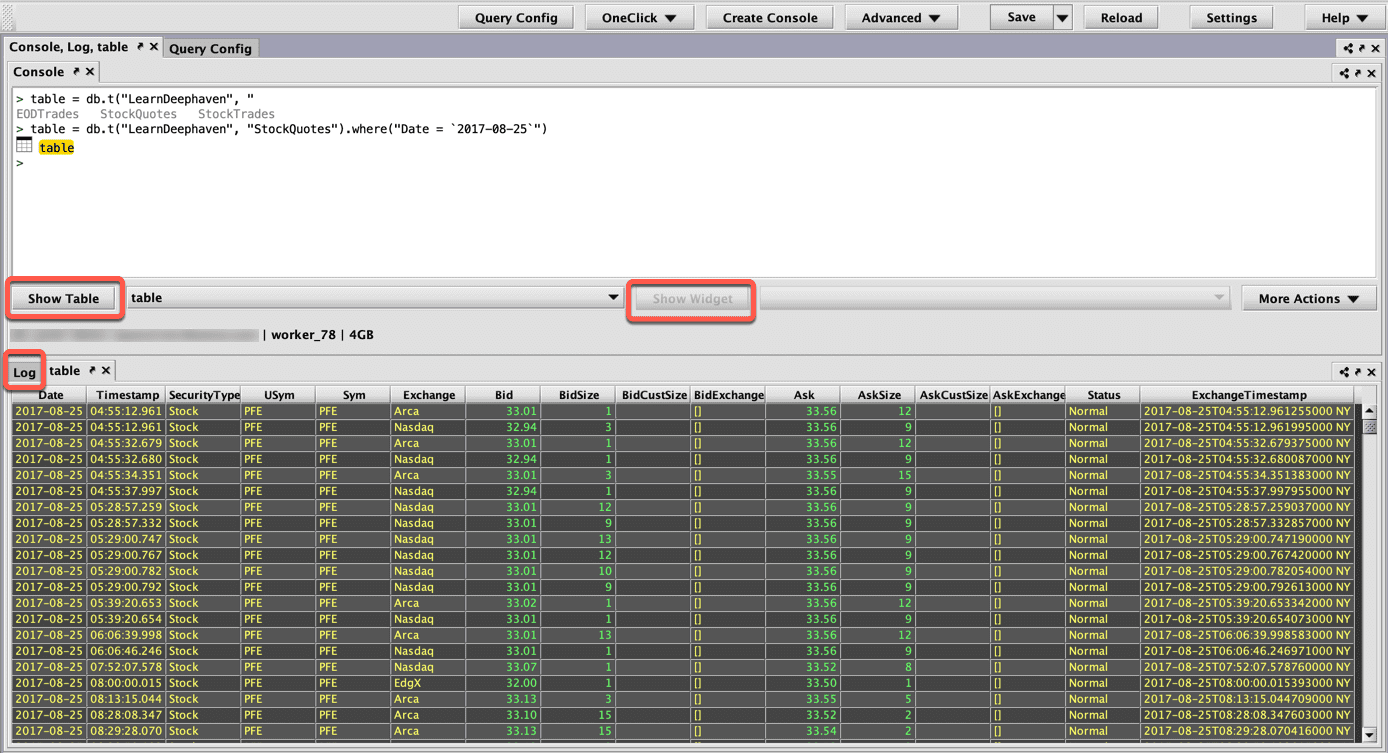
Just as in the Deephaven Code Studio, tables and charts generated by the queries you type render immediately in the Console window. Further, if you create a lot of tables and widgets, you can easily view any of them by using the Show Table and Show Widget buttons at the bottom of the Console window. The Log panel directly under the Console window records relevant details or error messages.
More Actions Menu
As the name suggests, the More Actions menu at the bottom right of the console gives you some shortcuts to common actions. Some highlights are listed below.
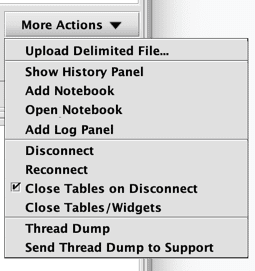
- Upload Delimited File: Upload a CSV or other delimited-type files (tab, pipe. etc.)
- Show History: See previous commands from this console session. Right-click one or more selected commands to copy them to your clipboard or notebook.
- Add or Open Deephaven Notebooks: The Deephaven Notebook serves as a "sandbox" where users can develop query components, stage draft queries, or simply store notes. There are buttons to either run full Notebooks or (just) selected lines.
- Disconnect or Reconnect: Reopen the initial Console settings.
- Add Log Panel: Reopen the log panel to see errors, etc.
Working with Tables and Plots
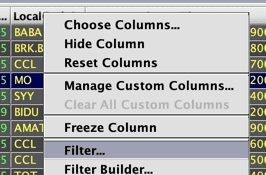
The column header menus and table context menus in Deephaven provide several options for manipulating your data directly in the user interface. You can sort and filter data, create custom columns, freeze columns, link tables and plots, or quickly roll-up your data or create plots.
| Column Header Menu | Table Data Menu |
|---|---|
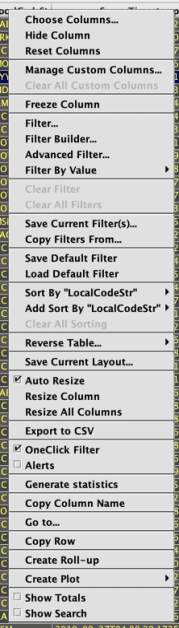 | 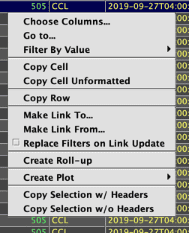 |
Right-click on any table header or within the table itself to see the available options.
Please review the full documentation to learn about all right-click table shortcuts.
Sort
To sort a column, click the column header once for ascending order, a second time for descending order, and a third time to return to the original order.
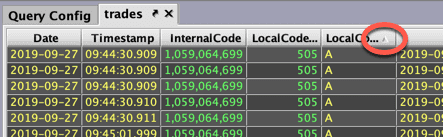
Once a table has been sorted in this fashion, an "up" arrow or "down" arrow will appear to the right of the column name to indicate the sort and the order. See below:
Filter
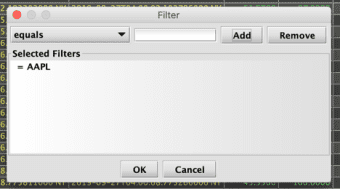
To apply a simple filter, right-click on that column's header and select Filter to open the configuration dialog. In this example, we've right-clicked the LocalCodeStr column header, which contains the symbol column.
In the Filter dialog, select the filter type from the drop-down menu, type a value in the text field (e.g., "AAPL"), and select Add. When you're done adding filters, click OK.
Plot
Users can create plots directly in the user interface using the Create Plot option in the right-click table data menu. These plots can be saved as part of your workspace and will reappear when you open a saved workspace.
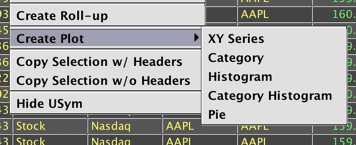
To learn more about each option, see Working with Plots.