Aggregate with Pivot Widgets
Deephaven's built-in Pivot Widget feature enables you to rearrange and aggregate a large detailed dataset into an at-a-glance summary with one straightforward line of code. Within a single query you can display multiple values, embed auto-filters, and include Grand Totals of your chosen aggregations. Pivot Widgets are only available in Deephaven Classic at this time.
Creating Pivot Widgets Programmatically
The simplest Pivot Widget shows aggregated values from a particular column chosen from the source table. However, there are several ways to customize your Pivot Widget, including additional value options, grand totals, auto-filters, and sorting options.
The following query creates a Pivot Widget that shows a breakdown of the prices or size of trades for each underlying security based on the Exchange on which they were traded, with optional Grand Totals and embedded auto-filters.
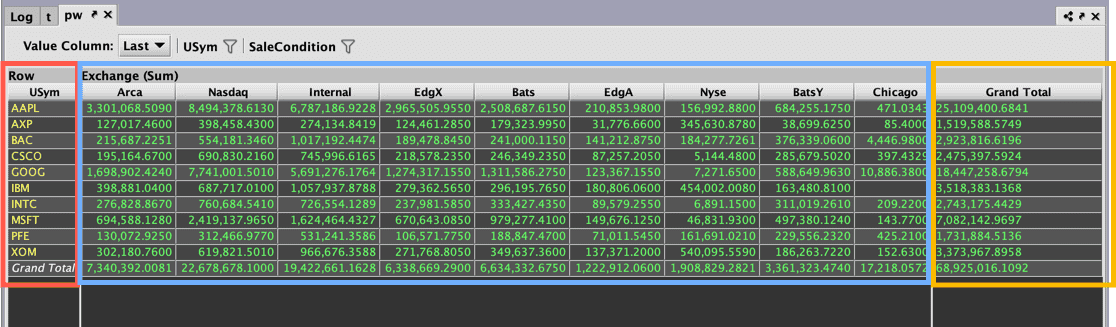
As you can see below, the drop-down menu next to Value Column changes which source column is aggregated, and two auto-filters are available. The Grand Totals also update accordingly.
To learn more details about Pivot Widgets and the arguments available, see Pivot Widgets in the Writing Queries Guide.