Launch and use a GUI
Launching the web GUI is as easy as pasting the link given to you into your browser, and logging in.
Usually you'll be taken to your last opened tab, but if it's your first time on our system, you'll land in the Code Studio.
For now, click the New+ button in the navigation bar:

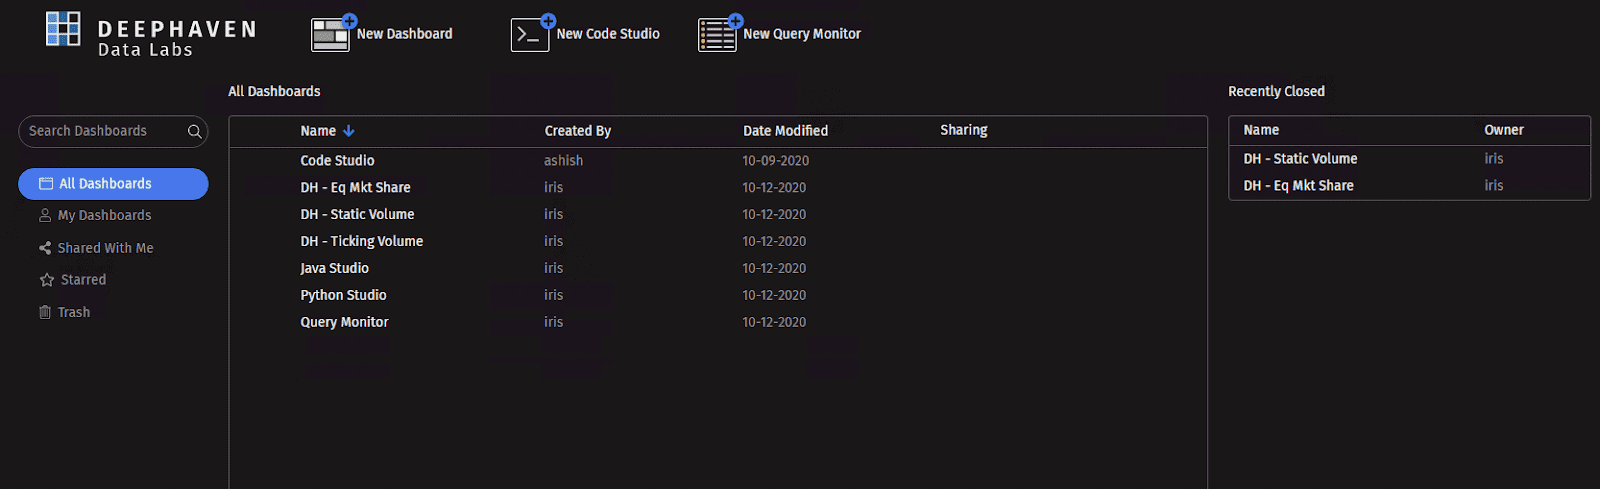
All the dashboards and Code Studios available to you will be presented in the list, with other display options to the left. Along the top are options to create new workspaces; more about those later.
Dashboards
Dashboards are customized collections of content including tables, plots and/or sets of nested panels. You can manipulate tables and plots in dashboards by dragging and dropping, as you’d expect. Using, creating, and sharing dashboards is fundamental to the value of the experience.
Open an Existing Dashboard
From the All Dashboards list, click on “DH - Eq Mkt Share”.
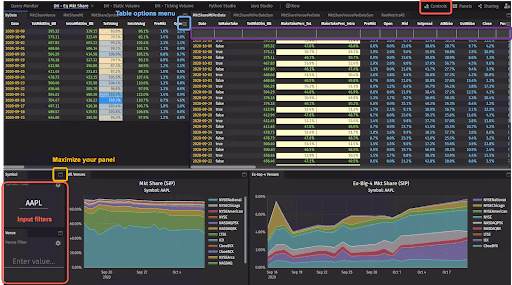
This is one of the example dashboards we've built for you that highlights some cool formatting options and plotting features. You can manipulate the dashboard yourself using the interface menus.
Some key features:
- The Table Options menu (highlighted in blue) is available on all tables, and provides access to the Chart Builder, Custom Columns, filtering and search options, etc. These features will be covered in Manipulate tables in the GUI.
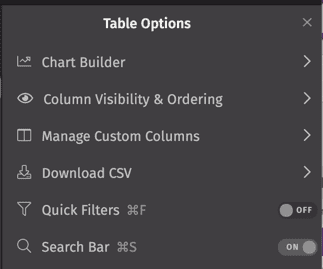
- A Quick Filters bar is already present (highlighted in purple) on the MarketShareMtPerDate table.
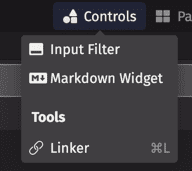
- Access the Controls menu (highlighted in red) to open the Input Filter and Linker tools (covered in the next section):
- Two Input Filters are included in this dashboard (highlighted in red) on the bottom left.
- You can maximize any panel (highlighted in yellow), resize, move, and nest any panel in the workspace.
Now, build your own using the Panels menu.
Create a New Dashboard
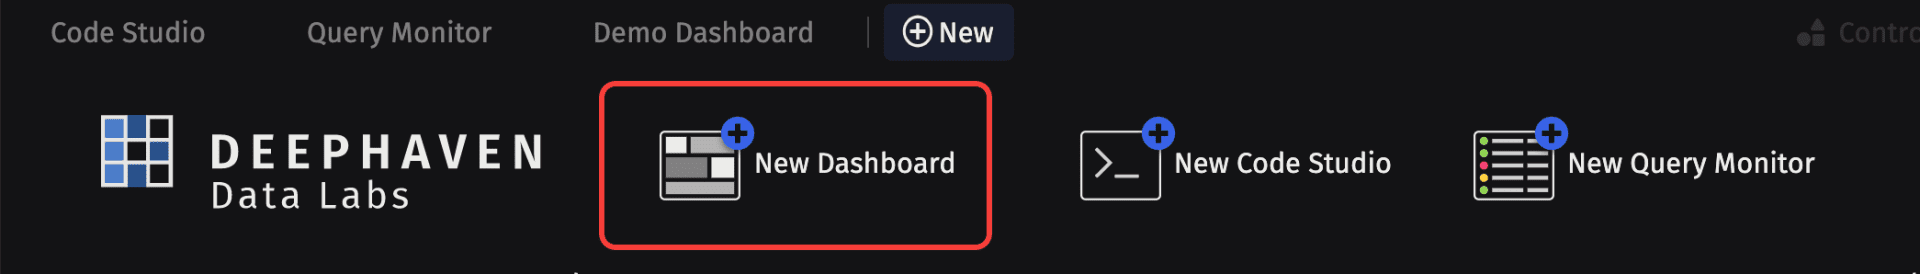
To create a new dashboard, click the +New button at the top of the Deephaven interface, and then select New Dashboard:
This opens an empty dashboard window.
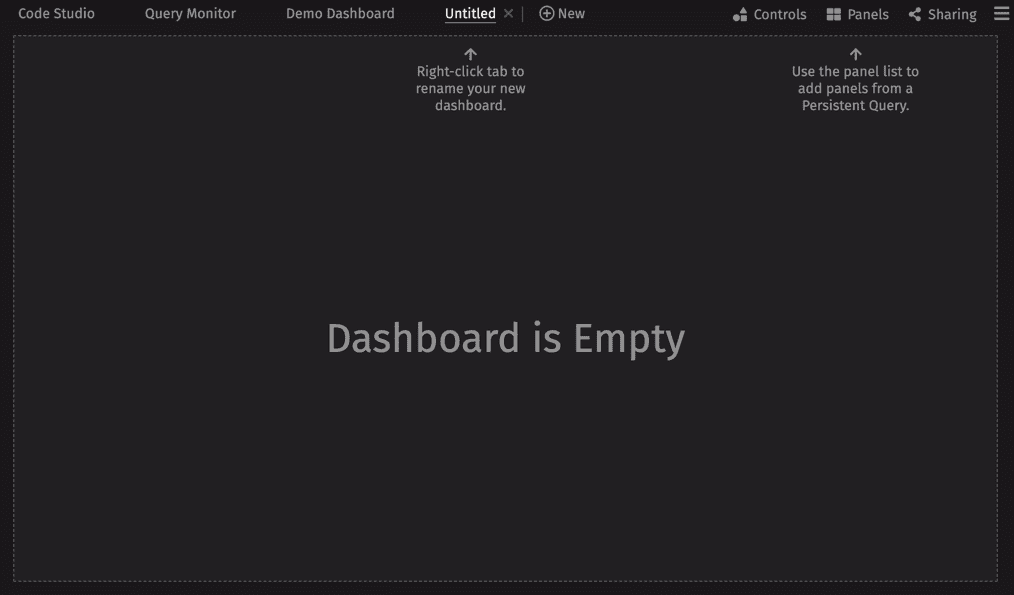
Start to add content using the Panels menu, which provides a list of Persistent Queries available to you. Persistent Queries are essentially applications and analytics running on the platform. These queries generate tables and/or plots that you can add to your dashboard(s) or consume via APIs.
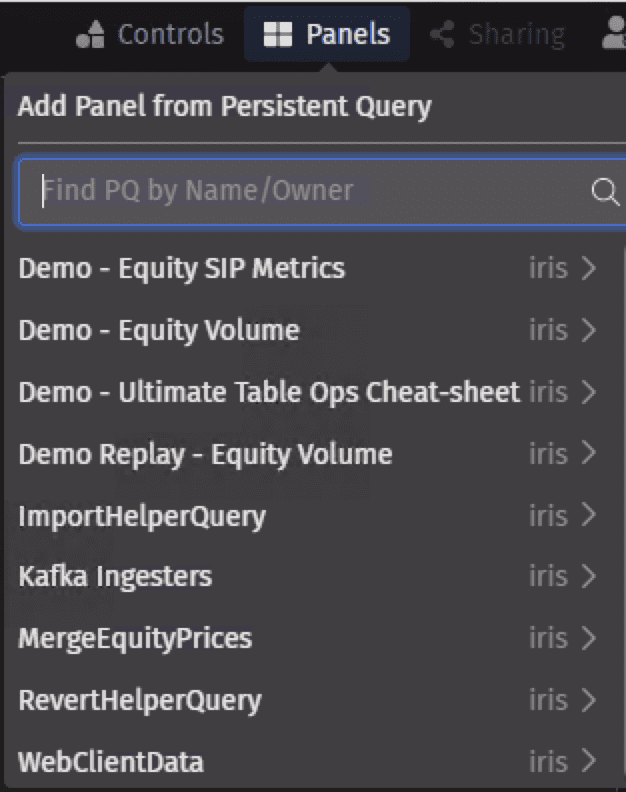
Click on any PQ to see the associated tables and plots and add them to your dashboard. You can also use the search field to filter your options.
Code Studios
The other primary interface is the Deephaven Code Studio, a workspace for writing queries and code to interrogate and manipulate data. It can serve as an ad hoc console or REPL.
Multiple Code Studios may be open simultaneously, including those using different programming languages. This is especially beneficial if you have a variety of independent, ad hoc analyses or development projects underway at the same time.
Connect
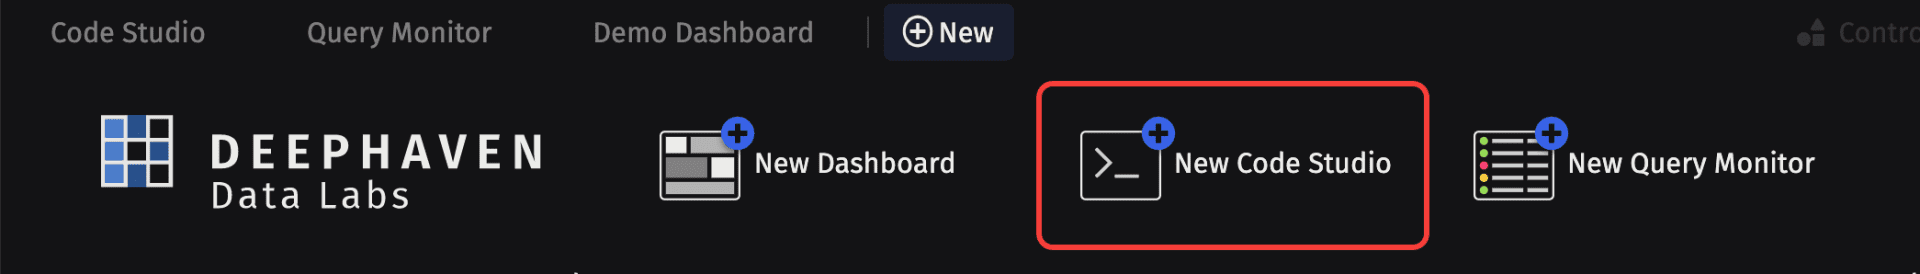
To launch a new Code Studio, click +New, then select the New Code Studio button.
After the Code Studio window opens, choose the query server on which to run this worker, the Heap Size (in GB) needed to provision the pending work, and your preferred scripting language (Groovy or Python).
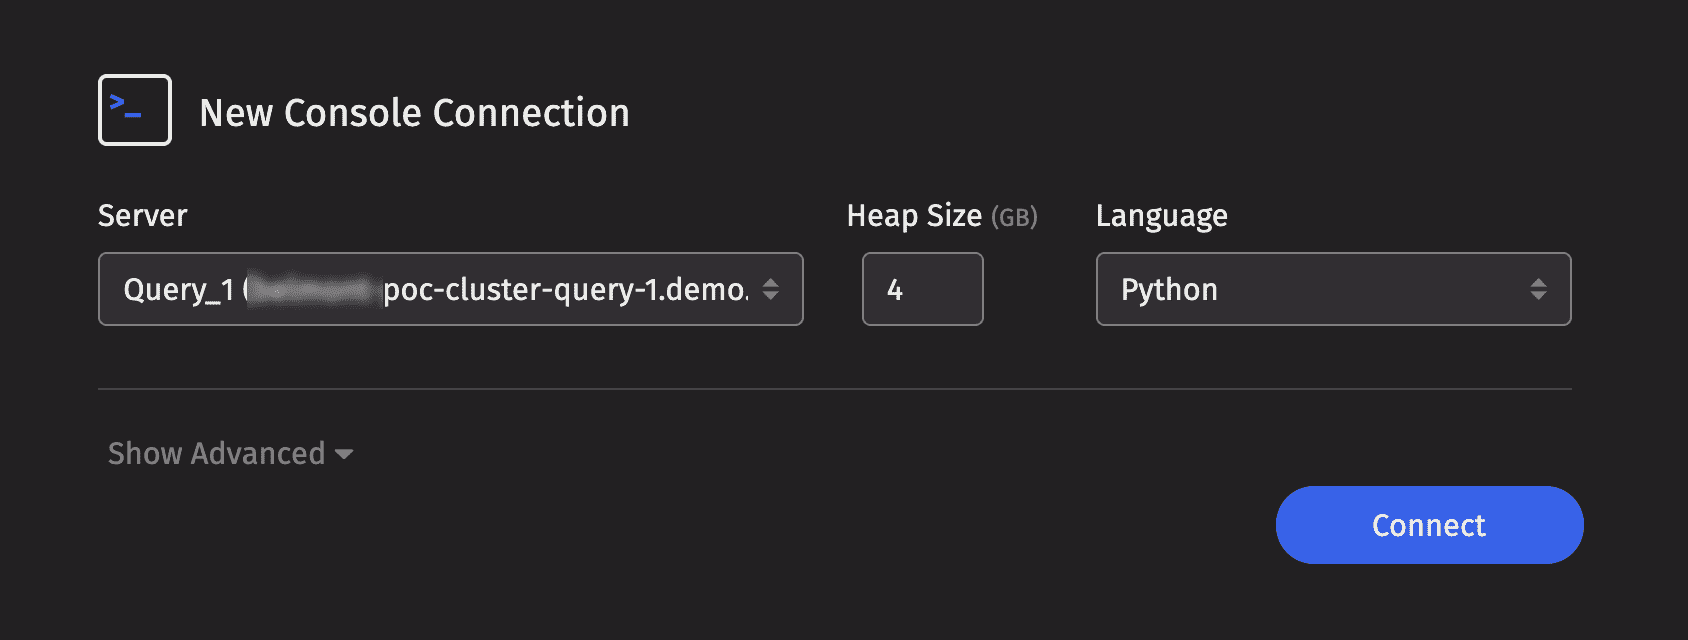
After you make your selections, click Connect.
Console / Log
The Code Studio provides a powerful editor experience for seeing and working with data, by using both the Deephaven table library operations and combining them with Python (or Java).
The tables, plots, and widgets your scripts produce will immediately render at the bottom of the experience. This real-time feedback loop (on all sorts of data) is great for on-the-fly analysis, debugging, and development.
Let's see how the Code Studio works by writing a simple query. Either copy and paste or type the following query immediately after the flashing cursor in the Console section of your new Code Studio, then select the Enter or Return key on your keyboard:
trades = db.t("LearnDeephaven", "StockTrades").where("Date=`2017-08-22`")
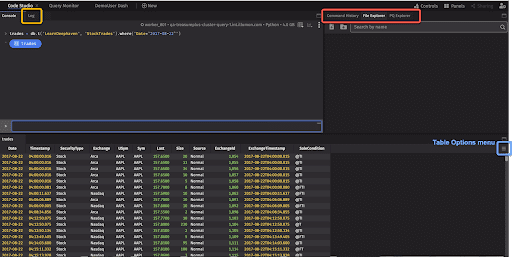
Just as in the "DH-Eq Mkt Share" dashboard, you'll see the Table Options menu (highlighted in blue) on the "trades" table we opened.
To the right of the Console tab is the Log tab (highlighted in yellow), which records what your query/code is doing, including data input/output, and processing. This is primarily intended for advanced programmers, but the Log will record errors that may occur to help find and resolve problems when query writing.
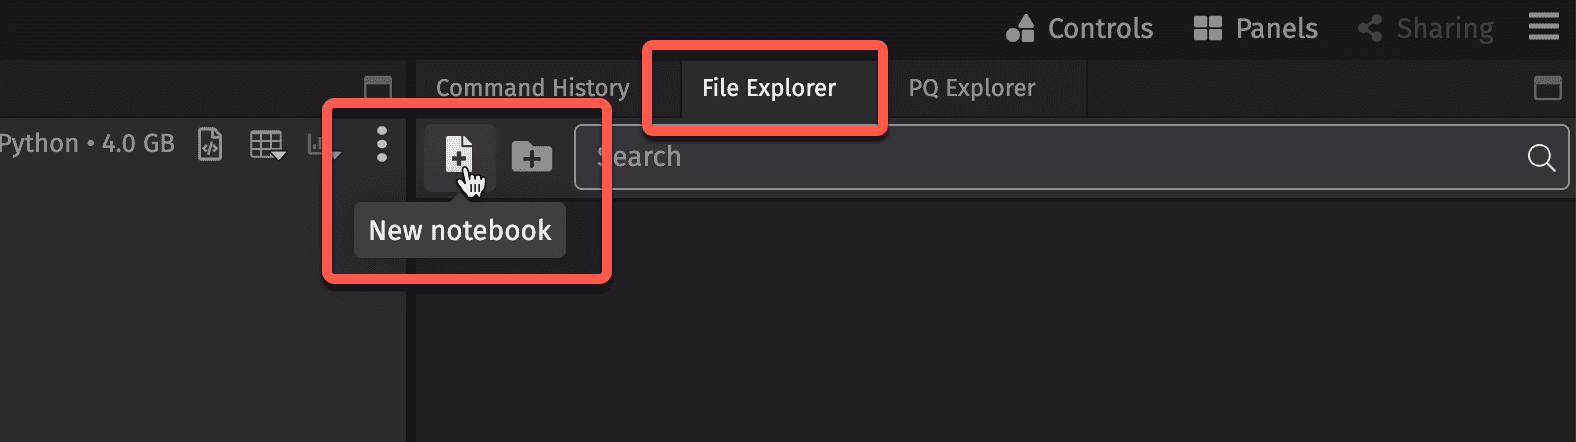
File Explorer / PQ Explorer
The File Explorer tab (highlighted in red above) organizes your Deephaven Notebooks.
The Deephaven Notebook is a valuable feature in which users can develop query components, stage draft queries, or simply store notes. Moreover, it can be used as a "sandbox" in which queries can be developed and refined, and then easily executed in Deephaven.
You can open a new Notebook experience by selecting the New notebook button. The File Explorer also allows you to search for and open saved notebooks.
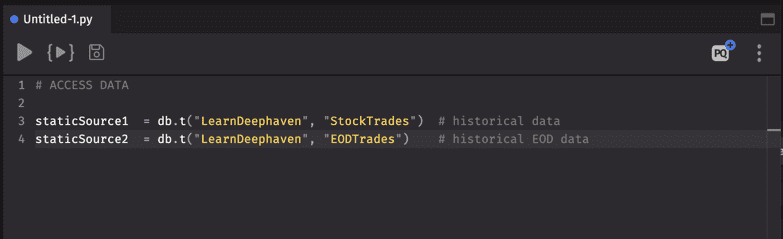
For example, the following screenshot shows a Notebook with two lines of a Python query script (borrowed from the Ultimate Table Operations Cheat Sheet.
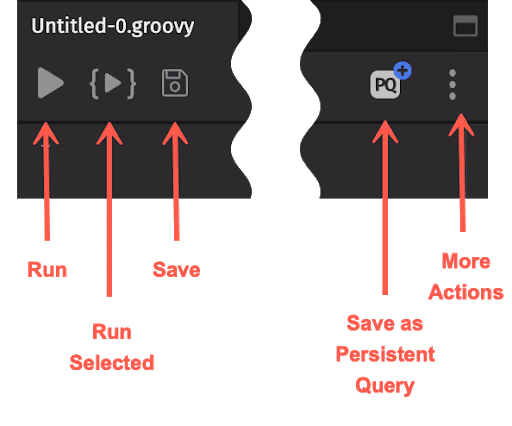
You can run all or just a portion of the script in the Notebook by using the buttons at the top left of the Notebook. To save your work as a persistent query use the PQ button at the top right. The More Actions menu provides options to Copy, Rename, or Delete your file.
The PQ Explorer tab at the right of the Code Studio lists all the persistent queries available to you, as well as some status information. As shown below, the green circle indicates that DemoQuery is active, while DemoQuery1 is not.
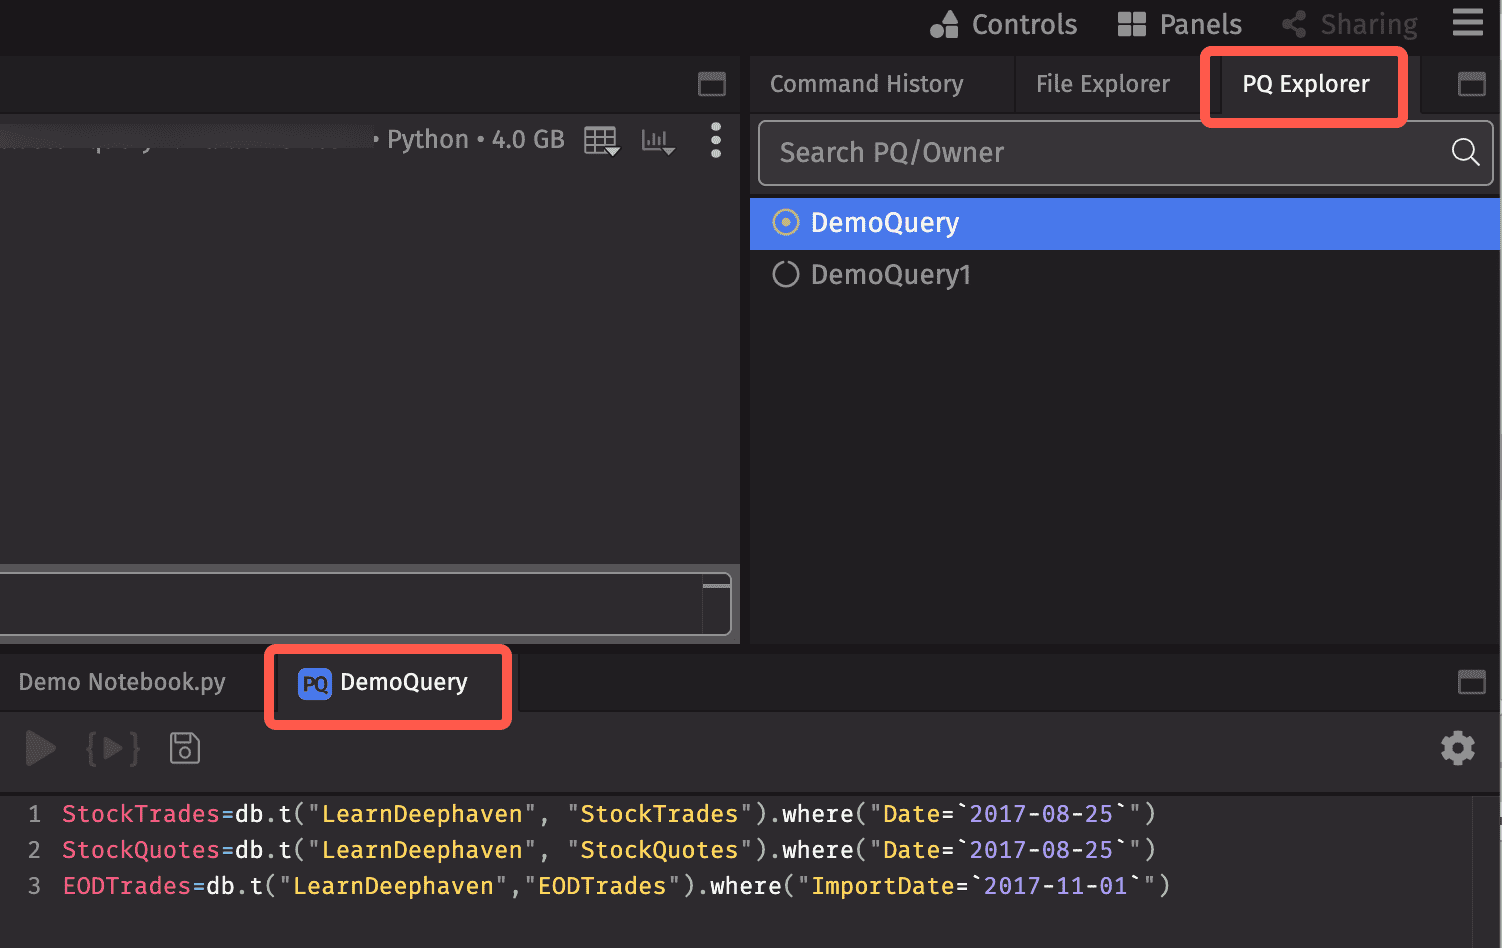
Selecting any query automatically opens its script in a new notebook panel.
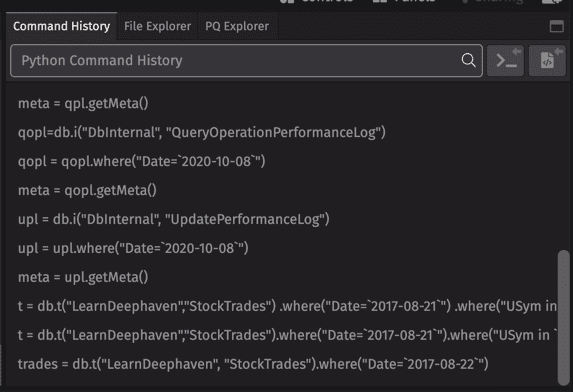
Command History
The Deephaven Command History can be used to review, retrieve and rerun queries in the console. The most recently used commands are shown at the bottom of the list. The history will show as much of the line as fits the window width. Hovering over that line will open a flyout menu to the left with the full query and its runtime.