Group data and perform aggregations
One of the powerful capabilities of any database is its ability to quickly associate similar data and perform various aggregations on respective subsets.
Grouping and aggregation are fundamental operations.
Grouping data
Data within a table can be grouped based on any similar attribute, or key.
- “I want to group a tradelog by Account... or by Symbol... or by Account & Symbol.”
- “I want to group signals by Factor... or by PM-Group & Factor.”
- “I want to group slippage calculations by Sector, Vintage, and Exchange destination.”
In Deephaven, one needs only to use the by() method. Very simply:
sourceTable.by(“GroupingKey”)
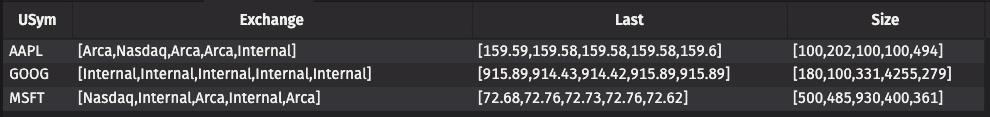
When a user groups data, all fields other than the grouping column will be presented as arrays of the data from the corresponding rows in the source.
Example
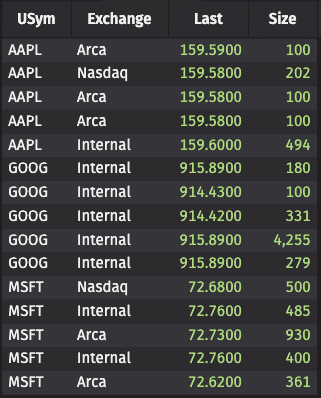
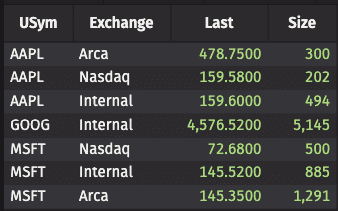
Create a simple table of 5 records for each of 3 Symbols:
Group the data by USym:
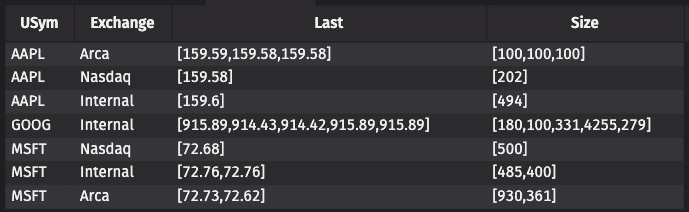
Group the data by USym and Exchange:
Un-grouping data
As you would expect, ungroup() performs the opposite operation. It scours the table for any array fields and expands them into a respective row for each array element. All other columns (that are not arrays) will remain the same in the expanded table.
Example
Create a single-row table:

Ungroup that newTable to create a row for each data record.
Caution
The array sizes must be the same for respective columns.
To come full circle in these examples, the script below ungroups the data that we grouped earlier (remember, using a by()), bringing us back to the original 15-row table.
Performing Aggregations
Aggregations are essentially an extension of grouping. They allow you to easily find sums, counts, variances, etc. of records within a group.
Use cases:
- “I want the sum of TradeSize by Account... or by Symbol... or by Account & Symbol.” “I want the max of SignalMagnitude by Factor... or by PM-Group & Factor.” “I want the average of slippage by Sector, AgeOfTrade, and Exchange.”
Aggregation operations:
- group the values of multiple rows based on the key,
- return a calculation on the arrays of all the non-key columns in those groups.
There are two ways to perform aggregations programmatically:
- Single, dedicated aggregations
- Combined aggregations
The syntax for each is slightly different.
Since this is Deephaven, do know all aggregations update in real time as new (and relevant) data becomes available!
Single (dedicated) aggregators
Regular aggregations are simple once one has mastered the grouping method described above -- i.e., by(“SomeKey”).
The syntax for single aggregations is very similar:
agg = sourceTable.aggtypeBy("SomeKey")
aggType can mean:
- first
- last
- min
- max
- sum
- avg
- var
- std
- median
Caution
Since the aggregation calculation will be performed on all non-key columns, math-driven methods (like sumBy, avgBy, etc.) will trigger an error if string, char, boolean types are represented in the non-key fields.
Let’s again use that 15-record table from the grouping example:
Calculating the sum of Last (price) and Size is straightforward:
Note that inside the parentheses one identifies the grouping keys, then all remaining columns are aggregated.
All of these other aggregation operations would produce the outcome you’d expect:
firstExample = table.firstBy("USym", "Exchange")lastExample = table.lastBy("USym", "Exchange")minExample = table.minBy("USym", "Exchange")maxExample = table.maxBy("USym", "Exchange")avgExample = table.avgBy("USym", "Exchange")medianExample = table.medianBy("USym", "Exchange")stdExample = table.stdBy("USym", "Exchange")
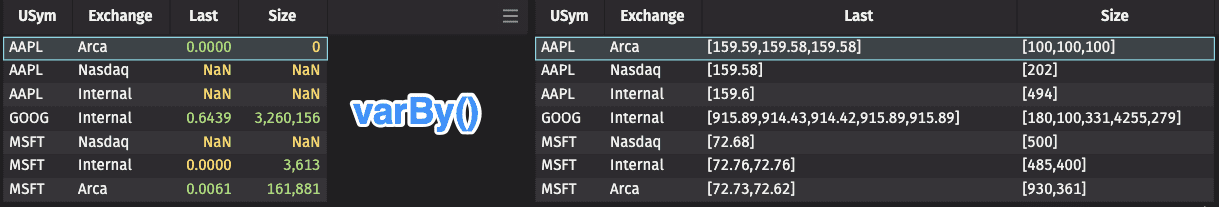
Here is the result of varBy(), shown to articulate how single-array variances are calculated.
Nulls and NaNs
Nulls are generally ignored in the aggregations. So, for example, a null record will not taint the avgBy() calculation.
NaNs:
- NaNs in the input generally pollute the output of the aggregation defining it to be a NaN.
- Positive infinite has an average of positive infinite. Similarly with negative infinite.
- Having both positive and negative infinities in the input produce an average of NaN.
- There is a filter available to remove NaN’s: .where("!isNaN(FieldName)")
Good to Know: Keyless aggregations
To perform an aggregation over the whole table, one can use any of these aggBy() functions without identifying a key.
For example the max record for each column in (the above) table is:
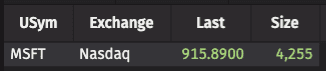
Note that the USym and Exchange (string) columns return their alphabetical maximum.
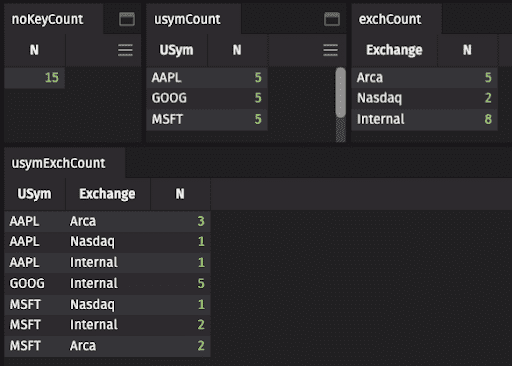
Special Case: countBy()
Performing a no-key countBy() will cause an error. One needs to label a new Column name for the count. [Examples below use “N”.] These produce the output you see in the image:
Important
Very important to know related to countBy: The count aggregation simply counts rows. It does not in any way review the data. Therefore nulls and NaNs will be included in the count!
If you do not want nulls and NaNs to be included, simply add:
followed by:
More special cases: headBy() and tailBy()
As you would expect, this query
produces a table (“headEx”) that is the first 10 rows from biggerTable for each respective USym, and a table (“tailEx”) that is the last 10 rows from "biggerTable" for each respective USym-Exchange combination.
Last special case: wavgBy()
To use the weighted average aggregation, you need to identify the weighting factor. This script gives the weighted average of Price by USym, with Size as the weighting factor.
User-defined aggregations
You can create your own user-defined aggregators using applyToAllBy(), as documented here.
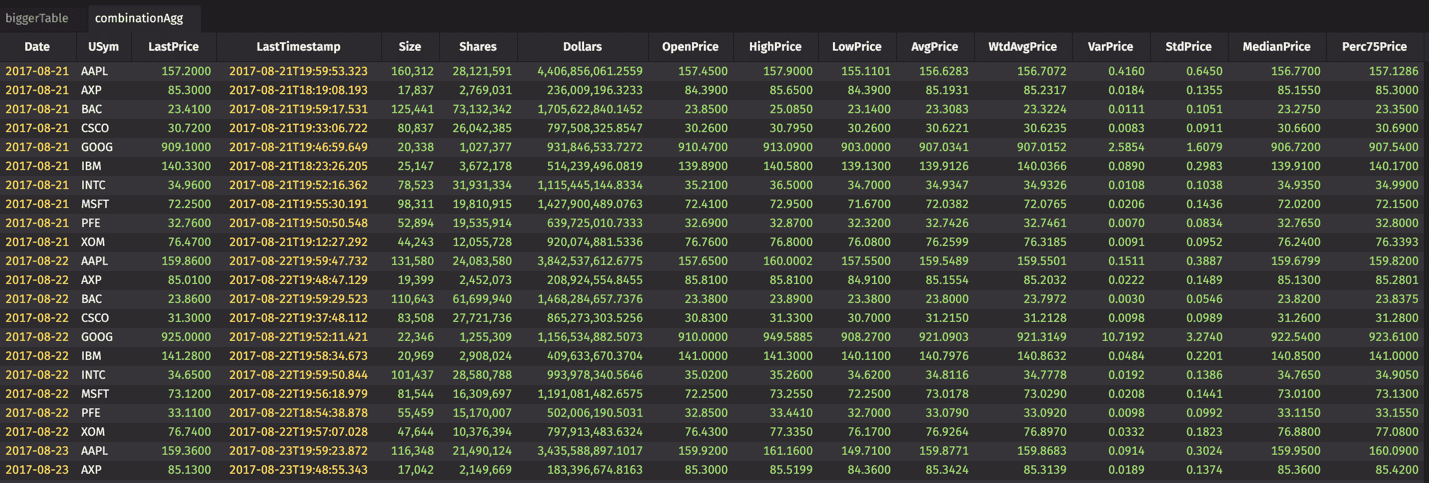
Combined Aggregations
Combined aggregations let you perform multiple operations at once.
The following syntax should be self-evident, producing the table below.
Important
To use these, one needs to import the Python module that supports them, delivering ComboAggregateFactory as caf.
A few things to note:
- See the
.by(caf.AggCombo(STUFF), "Key(s)")syntax. - The key(s) of the aggregation are identified at the end - in this case, "Date", "USym".
- In using
AggCombo, each field to be aggregated must be itemized. - A particular field from the source table can be represented in multiple aggregations.
- You can rename the aggregation column easily.
- Observe
caf.AggPctas well, which is supported incomboAgg.