Using Deephaven's Array Operations
When data is stored in a tabular format like in Python or Deephaven, we can use the columns of these tables to group rows together, perform intricate calculations, or define new columns from parts of old columns. All of these operations utilize arrays, a data structure that stores data in sequential elements that can be individually accessed, like books on a bookshelf. However, arrays can sometimes be finicky when they’re nested inside tables, and if you aren't careful, you could easily dismantle the structure of your data when working with them. Fortunately, Deephaven has several intuitive methods for working with arrays, and understanding them can make your data manipulation tasks remarkably easy.
The i in Deephaven
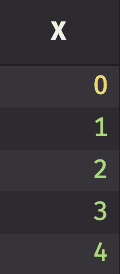
In Deephaven, i is a special column that implicitly references the corresponding row number in a non-ticking table. For example, we can build an empty table and fill it with the corresponding row indices using i:
This will output the following table:
You can see that although i is not displayed as its own column, it’s readily available for use in queries like any other data column, and can be used in calculations:
Which gives:
In almost all cases, the i column is used as an index to access row data. Unfortunately, in order to maintain high performance, ticking tables do not support the i column. Continuously updating i while a table ticks can be very computationally expensive.
Accessing Arrays in Deephaven
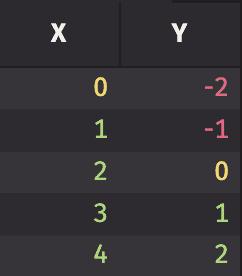
If we want to use the elements of the column X to build a new column Z, we can reference the elements of X, as an array, with the following syntax (note that the trailing underscore is used to access the column as an array):
This will yield:
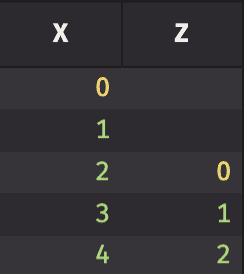
This exemplifies the relationship between X and X_ in Deephaven: X_ is an array of the column X that can be indexed by the i column, much like in a Python for loop. While X and X_[i] have the same values, X_[i-2] accesses previous rows in X. When there are no previous rows to access, X_[i-2] returns null, which is why the first two rows of Z are null.
Array Slicing in Deephaven
We can use the syntax described above to perform operations on subsets of columns. If we wanted to take three consecutive elements in a column and add them together to get a new element, we could do the following:
This outputs:
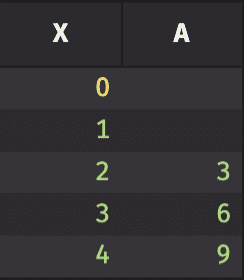
We can again see that the first two rows of A are empty, because for those rows, we do not have the previous elements in X needed to perform the calculation. This is easy enough, but if we needed to use more elements in X, such equations would quickly grow unwieldy. Fortunately, there is a simple syntax to retrieve any subset of consecutive elements:
This will give us:
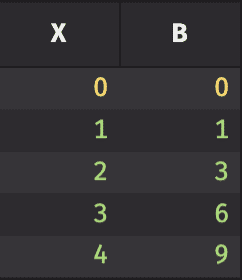
Since subArray is creating a slice of X_ from i-2 to i (leaving off the endpoint), when the slice exceeds the range of available rows, we will have nulls in our slice. However, the sum function ignores these null values, so the first two rows of B are not null, but are the sums of the last three consecutive values ignoring those that are null.
Lastly, there is one more important array operation that will not be used in the example at the end: by. This is an extremely useful tool that can make a lot of data analysis easier, so let’s have a look.
The by Function in Deephaven
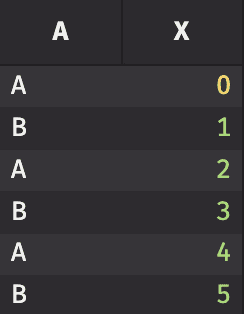
Data often requires some kind of aggregation to perform calculations. Deephaven makes this simple with the by function. by will aggregate any column in a table by set of key columns that divide the data into categories. For example, let’s construct a table with numbers 0-5 using the above methods, and label them by their parity:
This code will output the following table:
Now, we have a categorical column A and a column of values X, so we can use by to group elements in X by their labels in A:
This code will return:
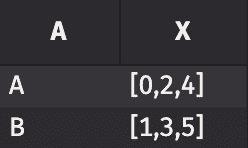
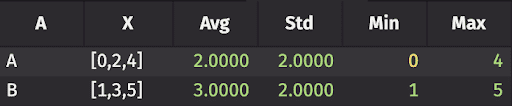
We can see that all of the elements that were labelled ‘A’ are now grouped together into one array, and likewise for ‘B’. Finally, this functionality can be used to perform calculations on our new groups:
This outputs:
With larger datasets and more complex labelling, this kind of simplicity is invaluable. By also works for ticking tables.
We can combine all of the ideas presented so far into a real-world example derived from a larger work on market volatility (See my blog post, Exploratory Analysis on Market Volatility.)
In Practice
We are interested in computing rolling statistics for a table called "stocks" with the format:
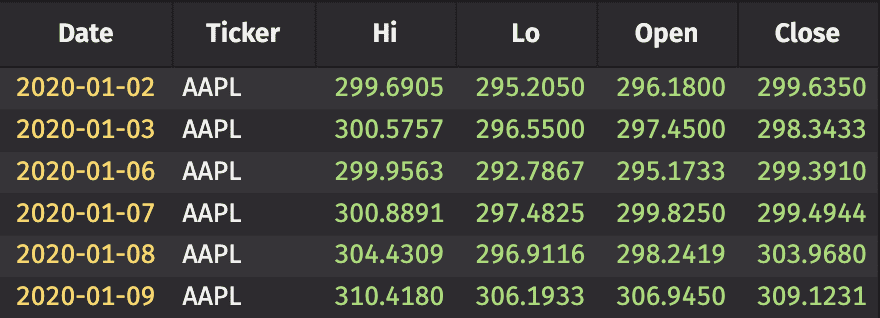
Here, each stock in our table has its highest, lowest, opening, and closing price for each day. First, we need to compute a column called ‘Returns’. Returns are defined as the natural logarithm of the ratio of closing prices from consecutive days. We need to first order our table by stock Ticker and Date. We also need to ensure that we only compute ‘Returns’ where consecutive rows are from the same stock. We can use the syntax for array access to accomplish this:
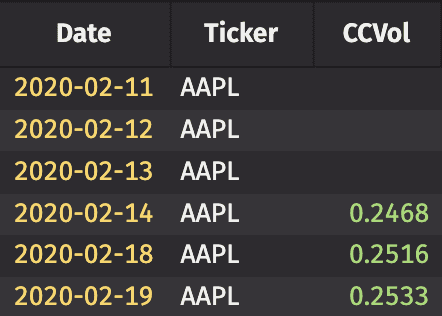
Next, for each day, we want to compute the annualized standard deviation of returns over the previous 30 days, and store the results in a column called ‘CCVol’. This is where array slicing will be immensely useful. It would be painful to manually write a function to calculate standard deviation for 30 different elements in the array. Again, we have to make sure that all 30 days in the calculation come from the same stock. If 30 days of data are not available, the value is set to null.
Observe how we made use of array slicing to easily compute a rolling standard deviation. When all issaid and done, we get the following table for each stock:
Summary
In this short example, we used array indexing in three different ways:
- to find a ratio of consecutive days,
- to compare the stock name of a row to the stock name 30 days prior,
- and to find a standard deviation for each day using only the last 30 days.
Without Deephaven’s array functionality, this would have been a nightmare. Since these kinds of problems are common in data science and programming, we’ve already crafted an easy and intuitive solution to take you past the grunt work of coding into the land of analysis and insight.