Monitoring Ingestion Performance

Overview

While Deephaven provides a rich set of tools to monitor the performance of a query it is also very useful to be able to measure the performance of the ingestion pipeline. A row of data will flow from your logger process into a Binary log file, then be consumed by a Tailer and sent to the Data Import Server, which will persist the data then serve it out to queries.

Deephaven provides query methods to add instrumentation to these two steps of the process.

Ingestion instrumentation is configured on a table-by-table basis. When enabled through the Schema, the system will provide three additional values that can be included in your table.

  • Tailer Transmission Time - When the Tailer sends a block of data to the DIS for processing, it attaches the timestamp immediately before transmission, accurate to microseconds.
  • DIS Receive Time - When the DIS receives blocks of data from the tailer, it immediately records the receipt time, also accurate to microseconds.
  • Row Size (Bytes) - The size of the row in bytes received from the Tailer.

These two values, combined with an update() statement in a query, can be used to compute log-to-query latency for each row.

Configuration

To enable instrumentation you must update the schemas for the tables you want to instrument. For example, consider the following schema:

<Table name="SimpleQuote" namespace="Market" defaultMergeFormat="DeephavenV1" storageType="NestedPartitionedOnDisk">
    <Partitions keyFormula="__PARTITION_AUTOBALANCE_SINGLE__" />

    <Column name="Date" dataType="String" columnType="Partitioning" />
    <Column name="Timestamp" dataType="DateTime" />
    <Column name="Sym" dataType="String" columnType="Grouping" />
    <Column name="Bid" dataType="Double" />
    <Column name="BidSize" dataType="Integer" />
    <Column name="Ask" dataType="Double" />
    <Column name="AskSize" dataType="Integer" />

    <LoggerListener logFormat="0" loggerClass="SimpleQuoteLogger" loggerPackage="com.mycompany.market" rethrowLoggerExceptionsAsIOExceptions="false" tableLogger="false" generateLogCalls="true" verifyChecksum="false" listenerClass="SimpleQuoteListener" listenerPackage="com.mycompany.market">

        <SystemInput name="ts" type="long" />
        <SystemInput name="sym" type="java.lang.String" />
        <SystemInput name="bid" type="double" />
        <SystemInput name="bidSize" type="int" />
        <SystemInput name="ask" type="double" />
        <SystemInput name="askSize" type="int" />

        <Column name="Timestamp" intradayType="Long" intradaySetter="ts" />
        <Column name="Sym" dataType="java.lang.String" intradaySetter="sym" />
        <Column name="Bid" dataType="double" intradaySetter="bid" />
        <Column name="BidSize" dataType="int" intradaySetter="bidSize" />
        <Column name="Ask" dataType="double" intradaySetter="ask" />
        <Column name="AskSize" dataType="int" intradaySetter="askSize" />
    </LoggerListener>
</Table>

First, augment the schema with three more columns.

Note

You can name them whatever you like, however they must be a long type.

  <Column name="TailerTxTime" dataType="Long" />
  <Column name="DisRxTime" dataType="Long" />
  <Column name="InstRowSize" dataType="Long" />

Next, add the attribute instrumented=true to the LoggerListener element. This tells Deephaven to include the instrumentation properties when listeners are generated.

<LoggerListener logFormat="0"  loggerPackage="com.mycompany.market" listenerPackage="com.mycompany.market" loggerClass="SimpleQuoteLogger" listenerClass="SimpleQuoteListener"
                instumented="true">

Now augment the LoggerListener element with three more columns, using the instrumentation getter methods.

  • getInstTxTime() retrieves the transmit time for the block.
  • getInstRxTime() retrieves the DIS receive timestamp for the block.
  • getInstSize() retrieves the byte size of the row.

Caution

The intradayType for all of these columns must be none, otherwise the system will expect the data to appear within the binary log files!

  <Column name="TailerTxTime" intradayType="none"  dbSetter="getInstTxTime()" />
  <Column name="DisRxTime" intradayType="none"  dbSetter="getInstRxTime()" />
  <Column name="InstRowSize" intradayType="none"  dbSetter="getInstSize()" />

Now that the schema modifications are complete, deploy the schema to the database. Note that if the system has received Intraday data for this table within the current partition, you will need to delete that partition and restart the DIS for the new listener to take effect.

The final schema

<Table name="SimpleQuote" namespace="Market" defaultMergeFormat="DeephavenV1" storageType="NestedPartitionedOnDisk">
    <Partitions keyFormula="__PARTITION_AUTOBALANCE_SINGLE__" />

    <Column name="Date" dataType="String" columnType="Partitioning" />
    <Column name="Timestamp" dataType="DateTime" />
    <Column name="Sym" dataType="String" columnType="Grouping" />
    <Column name="Bid" dataType="Double" />
    <Column name="BidSize" dataType="Integer" />
    <Column name="Ask" dataType="Double" />
    <Column name="AskSize" dataType="Integer" />
    <Column name="TailerTxTime" dataType="Long" />
    <Column name="DisRxTime" dataType="Long" />
    <Column name="InstRowSize" dataType="Long" />

    <LoggerListener logFormat="0" loggerClass="SimpleQuoteLogger" loggerPackage="com.mycompany.market" rethrowLoggerExceptionsAsIOExceptions="false" tableLogger="false" generateLogCalls="true" verifyChecksum="false" listenerClass="SimpleQuoteListener" listenerPackage="com.mycompany.market" instrumented="true">

        <SystemInput name="ts" type="long" />
        <SystemInput name="sym" type="java.lang.String" />
        <SystemInput name="bid" type="double" />
        <SystemInput name="bidSize" type="int" />
        <SystemInput name="ask" type="double" />
        <SystemInput name="askSize" type="int" />

        <Column name="Timestamp" intradayType="Long" intradaySetter="ts" />
        <Column name="Sym" dataType="java.lang.String" intradaySetter="sym" />
        <Column name="Bid" dataType="double" intradaySetter="bid" />
        <Column name="BidSize" dataType="int" intradaySetter="bidSize" />
        <Column name="Ask" dataType="double" intradaySetter="ask" />
        <Column name="AskSize" dataType="int" intradaySetter="askSize" />
        <Column name="TailerTxTime" intradayType="none" dbSetter="getInstTxTime()" />
        <Column name="DisRxTime" intradayType="none" dbSetter="getInstRxTime()" />
        <Column name="InstRowSize" intradayType="none"  dbSetter="getInstSize()" />
    </LoggerListener>
</Table>

A simple query

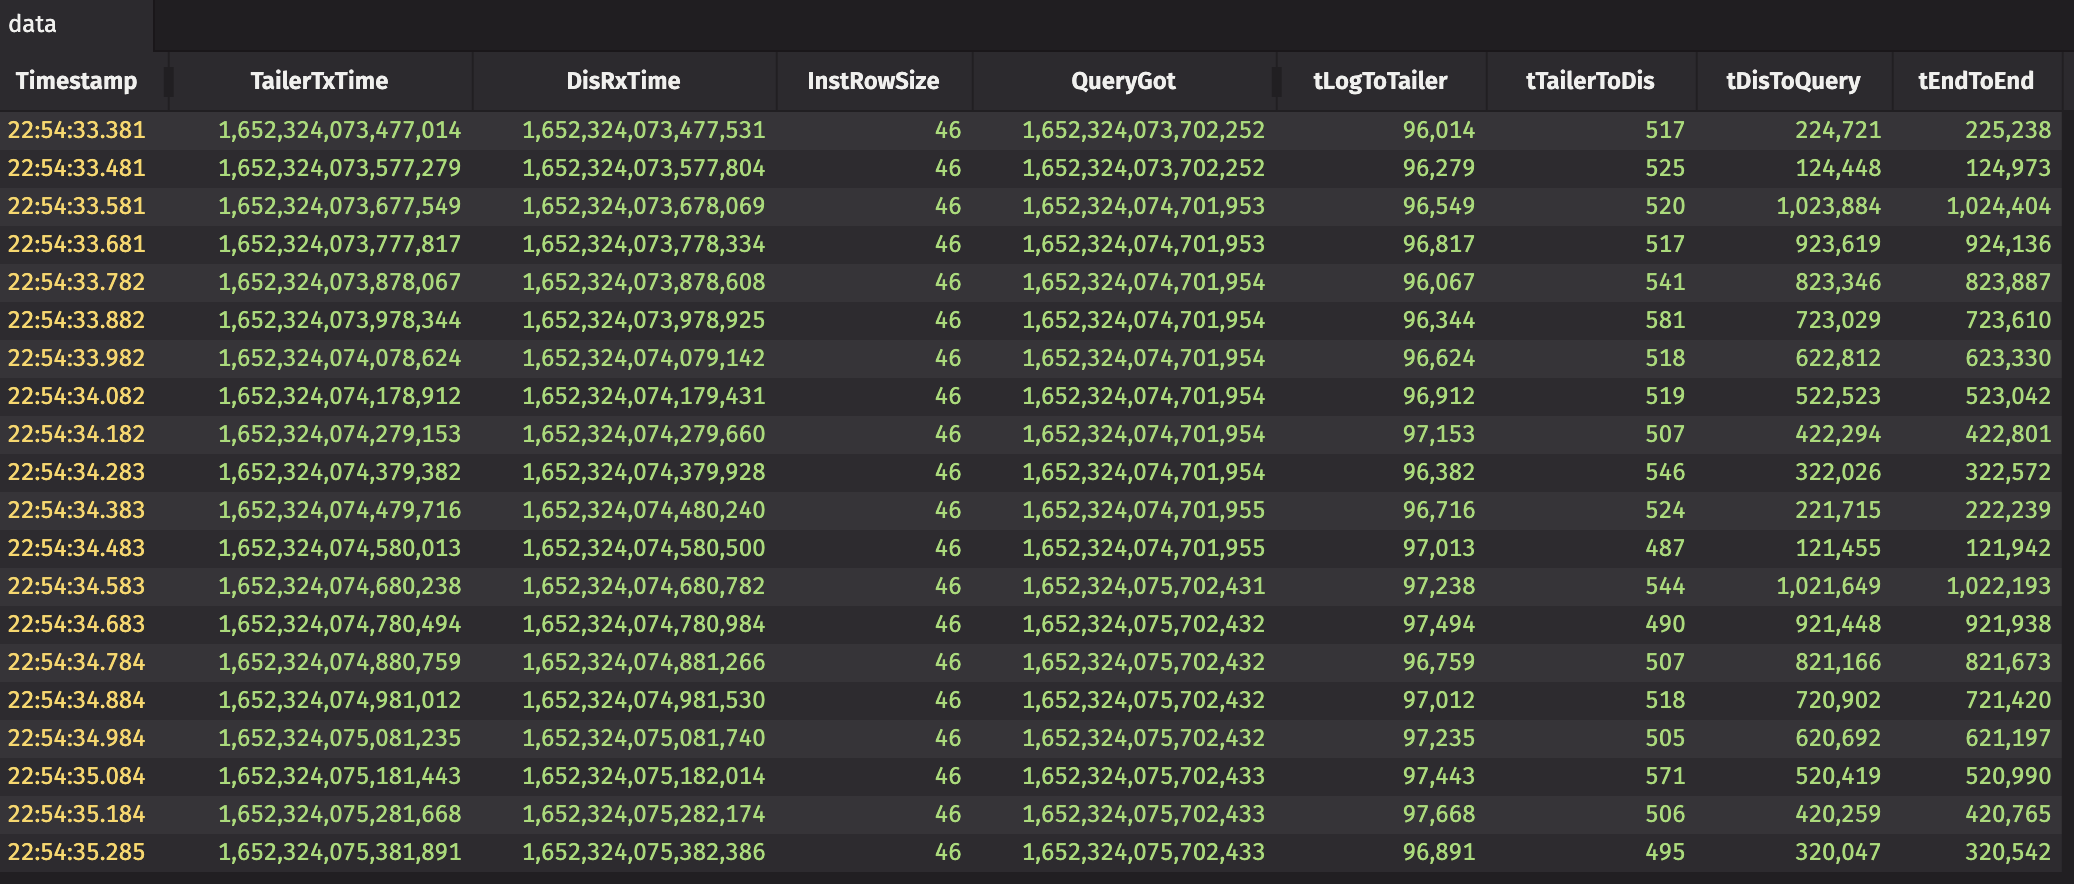
Now that the table is set up for instrumentation, all that needs to be done is to write a query to inspect the data. Keep in mind that all the recorded times are at microsecond resolution.

data = db.i("Market", "SimpleQuote")
         .where("Date=currentDateNy()")
         .update("QueryGot=DBDateTime.now().getMicros()")
         .updateView("TSN=Timestamp.getMicros()",
                     "tLogToTailer=TailerTxTime-Timestamp.getMicros()",
                     "tTailerToDis=DisRxTime-TailerTxTime",
                     "tDisToQuery=QueryGot-DisRxTime",
                     "tEndToEnd=QueryGot-TailerTxTime")
data = db.i("Market", "SimpleQuote") \
         .where("Date=currentDateNy()") \
         .update("QueryGot=DBDateTime.now().getMicros()") \
         .updateView("tLogToTailer=TailerTxTime-Timestamp.getMicros()", \
                     "tTailerToDis=DisRxTime-TailerTxTime", \
                     "tDisToQuery=QueryGot-DisRxTime", \
                     "tEndToEnd=QueryGot-TailerTxTime")

img

Considerations

There are a few things to be aware of when interpreting and drawing conclusions from the instrumentation data:

  • Synchronization - The accuracy of the measurements are dependent on the quality of the synchronization of clocks between the hosts that the DIS, Tailer, and Query are running on. For unsynchronized, or poorly synchronized hosts no conclusions can be drawn from this data.
  • End-to-end Latency - When looking at the total end-to-end latency, that is, the latency from when the logger wrote the row to when a query actually sees the row is dependent on the LTM cycle and therefore overall load of the query. The end-to-end number is only useful as a hint that something may be amiss and only then, if the query is not under load.
  • Logger to Tailer - The latency measurement between the when the logger wrote a row, and the tailer sent it to the DIS is dependent on the watch configuration of the tailer. Tailers that are watching files via inotify or equivalent will show much better numbers here than ones that must use polling. If polling is used, the polling interval must be factored into the measured latency here.