Memory Tuning Persistent Queries
What information is available to help me adjust the heap size (memory requirements) for my persistent queries?
Deephaven provides two built-in methods to facilitate memory tuning for Deephaven workers and persistent queries:
These lines can be run in the console to pull up several tables that allow you to monitor you queries throughout the day, providing performance information to help identify any potential problems and to offer insight on how to re-allocate memory if necessary. The persistentQueryStatusMonitor() method provides an overview of how all your queries are running, while performanceOverview() provides information about a single query or worker. Each method is discussed in detail below.
The tables generated by each method let you look at how much memory a query is using. If the query/worker is using only a small percentage of its max heap size, you should reclaim some of that memory for other queries. On the other hand, if a query is requiring almost all the memory allocated, you should increase the heap size to prevent underperformance or failure.
If you are investigating a specific query and have concerns about heap, we recommend turning on detailed GC logging in the Persistent Query Editor, under Advanced Options (this is enabled by default in Deephaven v.20181212). You can also turn on detailed GC logging when you create a new console by selecting Advanced Options and selecting Enable detailed GC logging. This creates additional lines in the Process Event Log, which can be used to analyze performance or failures.
Persistent Query Status Monitor
Typing persistentQueryStatusMonitor() into a console gathers and aggregates performance data pertaining to your persistent queries and opens 14 tables that show you if your queries are running properly and provide various metrics related to their performance (See Troubleshooting Queries to learn more). You can also create a persistent query from the persistentQueryStatusMonitor() script for easy access to these tables.
Below, we will spotlight three tables that directly relate to memory tuning:
- Update Aggregate: This table compiles aggregated performance data for each worker to show the amount of memory being consumed by each worker versus the amount of available heap space allocated for that worker.
- State Log: This table joins the aggregated performance data from Update Aggregate onto the Persistent Query State Log so you can see performance data about your persistent queries alongside their respective current status.
- Total Memory: This table is the sum of all of the memory currently being utilized by workers. It is useful when trying to determine if you are approaching the memory capacity of your system.
These tables give you an overview of how much heap all your persistent queries are using. An example of the StateLog follows:
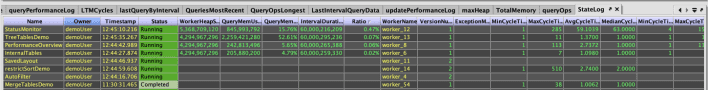
Note: Some columns in the table have been hidden to better demonstrate the references discussed below.
The StateLog table above has been filtered to one owner, and sorted in descending order by Ratio. As you can see, some of the persistent queries do not contain information in every column. If a query is not using any live or ticking operations, there will not be any update data.
Let's take a look at the notable columns in the table.
- The WorkerHeapSize column tells you how many bytes are in the worker's allocated heap. Sorting the table by this column quickly identifies the queries that are using large amounts of memory. If you're looking for places to reclaim memory, target the largest to memory tune. Since you need to choose a maximum heap size when you create a persistent query, you're essentially guessing how much you need. However, Java will never shrink heap allocation - once the JVM has it, it keeps it. Giving your query too much heap wastes resources.
- The next column in the table, QueryMemoryUsedPct, can help you adjust the max heap size once the details are collected for your queries. It displays the memory used by a query as a percentage. If the percentage is very low, you may be wasting heap that could be allocated to other jobs/threads. On the other hand, if this percentage is very high, you may risk running out of memory. As long as GC is possible, a high number is not necessarily problematic.
- The Ratio column approximates how much of the available CPU was used by a given operation. Sort descending by ratio to frontload queries that are underperforming, as in the example StateLog above. The higher the number, the more utilized the query is. However, if the ratio for a single thread query gets too high, it may become slow or unresponsive. The Steps for Reducing Ratio section of the Deephaven Troubleshooting Query Guide provides detailed guidance to improve the performance of your query.
- The IntervalDuration column shows the length of the performance monitoring interval and the corresponding ratio. This interval is about 60 seconds in a default configuration, but it can be tuned by adjusting this property:
UpdatePerformanceTracker.reportIntervalMillisIf the value in the IntervalDuration column significantly exceeds the configured amount, it implies that your Live Table Monitor (LTM) is not keeping up. These can be reconfigured on a per worker basis.
- The right side of the StateLog table includes a number of columns with information about the LTM. The cycle time is how long (in milliseconds) the LTM loop took to execute, or, in other words, how long it took Deephaven to process all the tables that need to be updated. You can look at the Average Cycle Time over the lifespan of the query (AvgCycleTimeLifespan) or in the previous 10 minutes (AvgCycleTimePrev10Min), as well as the minimum, maximum, and median cycle time for each respective timespan. A long cycle time is cause for concern. To learn more about troubleshooting the LTM, see Controlling Table Update Frequency.
In general, persistentQueryStatusMonitor() gives you an overview of the entire system to assess how much ratio and heap all your persistent queries are using. Starting here, you can determine which query you might want to memory tune. Turning next to performanceOverview() will give you more information on that particular query.
Performance Overview
Typing performanceOverview() into the console opens performance data about the current worker. You can also type performanceOverviewByName("queryName", "userName") to filter to data related to a specific query. This method provides simple and immediate access to performance logs and tables sorted in various ways, such as to show the operations taking the longest.
To learn about the other arguments available, see Performance Overview in the Troubleshooting Queries guide.
For example, running the following query performanceOverviewByName("InternalTables", "demoUser") opens a view similar to the image below:
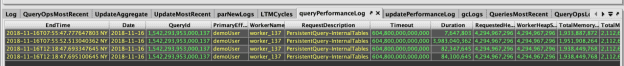
Let's take a look at three of the most important tables:
- Query Performance Log: This table contains data on how long each query takes to run and provides information similar to the StateLog discussed above, such as QueryMemUsedPct. For example, if you want details about a specific query and pull up these tables at the end of a busy day, the currently allocated heap size in QueryMemUsed or QueryMemUsedPct provides an accurate indication of how much heap the query needs. You can then adjust the max heap size accordingly.
- Update Performance Log: This table describes what the query spent time on during its data refresh cycle and includes the Ratio column.
- GC Logs: Garbage collection is a memory management process that automatically collects unused objects created on the heap and deletes them to free up memory. The JVM's GC logs contain information about how often GC is performed and other details of the collection process. This table shows every time GC runs, for queries with GC logging enabled. If you have frequent GC, you should increase heap size because GC is "stop-the-world". This means that threads other than those needed for GC cannot run simultaneously. If GC is properly reclaiming memory, your heap is large enough.
In a nutshell, these performance tables quickly inform you if your heap needs to be larger to perform its internal structures. Referring to these metrics helps you prevent problems and keep your queries running smoothly.