How to monitor Deephaven Processes with VisualVM
VisualVM is an open source project developed by Oracle that allows monitoring of resource and object utilization by Java applications. It can be run locally on a machine where the Java processes are running, or it can connect to remote processes to monitor server side components where no UI is available.
To learn more about VisualVM or to download the tool, visit VisualVM on Github.
Local Use
When launched, VisualVM will show local Java processes. If it is being run on the same system that is running the Deephaven processes to be monitored, then VisualVM can directly attach to those processes with no other setup required.
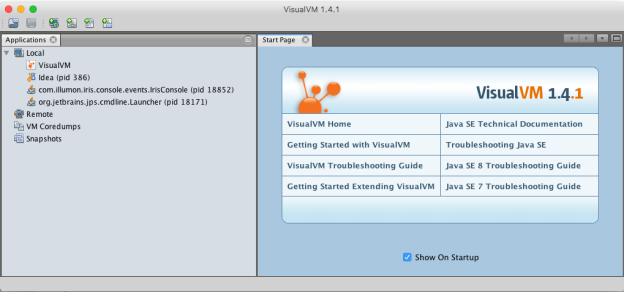
In the above example, there is a Deephaven console running under pid 18852.
Note
Because VisualVM is a Java application, it can also "see" and monitor itself.
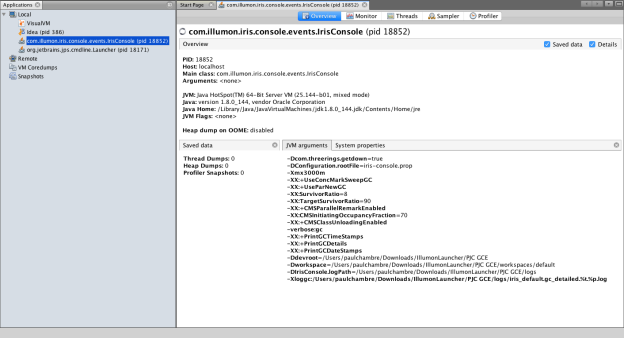
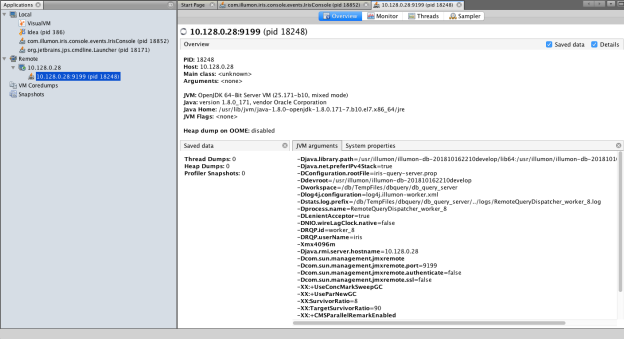
Double-clicking on the com.illumon.iris.console.events.IrisConsole entry attaches VisualVM to the Deephaven console process, and displays details about it in the right pane, as shown below:
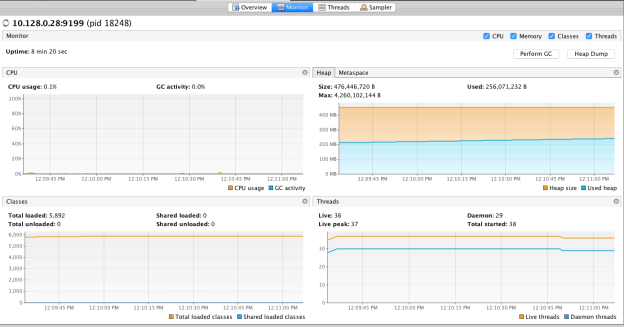
Content shown in the Monitor tab window is often the most interesting/useful for monitoring Deephaven processes. This tab shows such things as CPU utilization, heap utilization, and garbage collection.
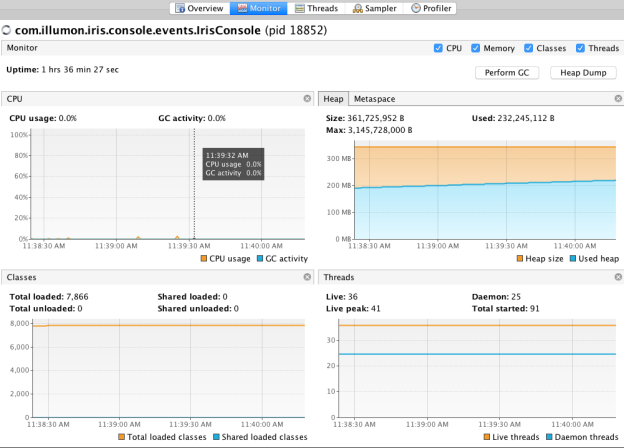
The Monitor window also allows the user to interactively force a full garbage collection with the Perform GC button or to dump the content of the heap (which can be very large) with the Heap Dump button.
Note
The example above shows activity associated with a Deephaven console process, which performs little of the work associated with the Deephaven application. Activities such as charting or file download/upload might consume memory and processing time in the console application, but the bulk of work occurs at the Deephaven query server in the worker process. Worker processes will not show up in the local processes list of VisualVM unless VisualVM is actually run interactively on the Deephaven query server itself.
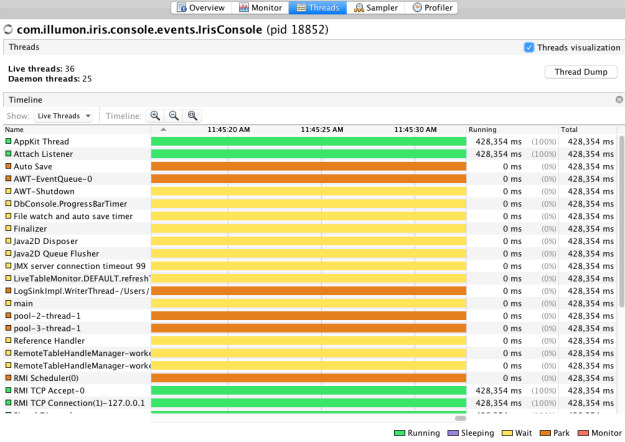
The Threads tab provides a view of the threads that are running within the application, the threads' states, and how much time each thread has been active.
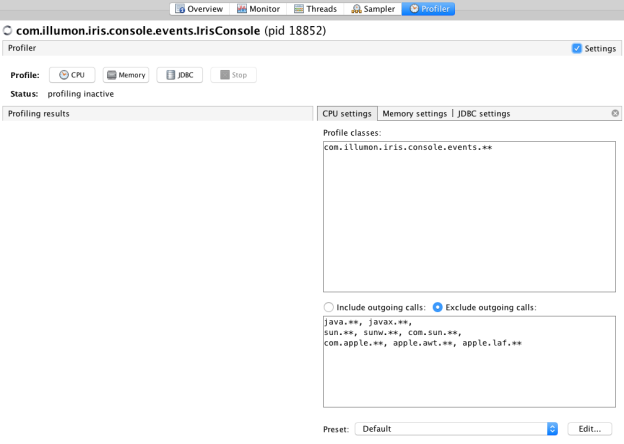
For local processes only, the Profiler tab allows detailed profiling of particular activities within the application. (See the VisualVM documentation for more details on use of Sampler and Profiler tabs.)
Remote Use
Most processing "work" in Deephaven happens in workers. Workers are separate processes spawned off by a Remote Query Dispatcher (Query Server or Merge Server). Interactive queries, persistent queries, and remote DB sessions launched from Python or R, all run in worker processes.
For VisualVM to be able to connect to a remote Java process, that process needs to have been started with the following extra arguments sent to its JVM:
-Djava.rmi.server.hostname=<host name or IP address where the JVM is running>-Dcom.sun.management.jmxremote-Dcom.sun.management.jmxremote.port=<port to connect to for this process>-Dcom.sun.management.jmxremote.authenticate=false-Dcom.sun.management.jmxremote.ssl=false
When launching a console connection, or configuring a persistent query, there is an option to provide additional arguments to the JVM process that will run the worker. See Advanced Options to learn more about adding these arguments when creating a console connection, and the Persistent Query Viewer/Editor to learn more about adding these arguments in the Settings tab of a persistent query's process.
For example, the screenshot below shows the additional arguments added to the Extra JVM Arguments field when launching a console in Deephaven Classic:
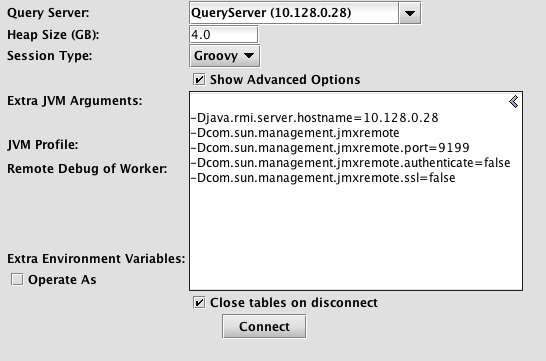
These arguments will allow VisualVM to connect to server 10.128.0.28 on port 9199 to monitor the console's worker. In this case, 9199 is an arbitrary port, which is not already in use for other processes on that server. Any available number in the range 1025 to 65535 can be used.
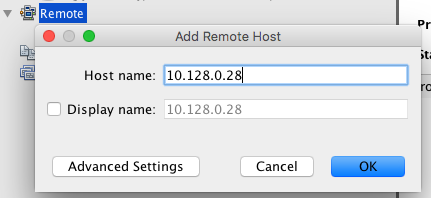
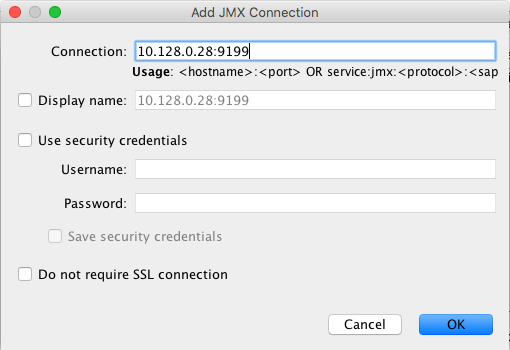
From the VisualVM application, a connection can then be added for the remote server:
Then a Java Management Extension (JMX) connection can be made to the worker process itself:
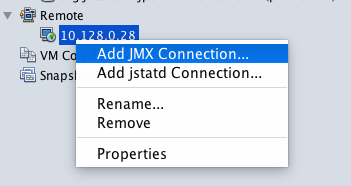
Once this connection has been made, the remote process will show under the remote server in the Remote node of the VisualVM tree, and can be connected to by double-clicking, similarly to how local processes can be monitored.
Like the information shown in VisualVM Monitor tab for local processes, this remote JMX monitoring connection allows viewing of CPU and memory utilization, gathering a heap dump, or forcing garbage collection.
Monitoring a worker like this allows an easy view into how much heap is being used for a query, and how different parts of the query impact the heap allocation. By monitoring a query in console's worker, or running a query in a persistent query's worker, it is easier to determine how much heap space needs to be allocated for the worker. This helps ensure the query does not run out of memory, and that extra memory is not allocated to it when it is not needed.