Metrics and monitoring
Understanding the state of your Deephaven deployment is essential for ensuring the reliability and stability of the system. Metrics provide the raw data measurements of system usage for an external monitoring system that can gather and visualize metrics, and send out alerts.
Monitoring
Monitoring is the process of collecting, aggregating and analyzing metrics. Raw metric data from various parts of the system should be collected into a monitoring system such as Grafana, DataDog, New Relic, etc.
The monitoring system is responsible for aggregation, visualization, and initiating alerts when the values meet certain thresholds.
Deephaven Process Monitoring
Basic monitoring for all Deephaven processes can be implemented by examining the servers process list for each of the Deephaven processes listed above or by using Monit output to see the process health. In general, Monit will attempt to restart any failed processes until successful.
Alarms should be set up for any processes not running when they should be and combined with examination of the application logs to get the root cause.
Deephaven performance and event information
The Deephaven DbInternal namespace provides several tables containing performance and event data that can be used for monitoring purposes. (See: Internal tables) Queries can be written to analyze Deephaven's internal state and performance by using these tables. The performance records are recorded on disk in the binary logs listed below and are then processed into the database. Although some of the Deephaven processes do not run under the irisadmin account (for example the RemoteQueryDispatcher and worker processes), their binary logs are still written to the irisadmin directory as they are sent through the Log Aggregator Service.
Binary logs
| Table Name | Processes | Log Names |
|---|---|---|
AuditEventLog |
| /var/log/deephaven/binlogs/DbInternal.AuditEventLog.System.<internal partition>.<date>.bin.<date.timestamp> |
PersistentQueryConfigurationLogV2 | PersistentQueryController | /var/log/deephaven/binlogs/DbInternal.PersistentQueryConfigurationLogV2.System.<internal partition>.<date>.bin.<date.timestamp> |
PersistentQueryStateLog | PersistentQueryController | /var/log/deephaven/binlogs/DbInternal.PersistentQueryStateLog.System.<internal partition>.<date>.bin.<date.timestamp> |
ProcessEventLog |
| /var/log/deephaven/binlogs/pel/DbInternal.ProcessEventLog.System.<internal partition>.<date>.bin.<date.timestamp> |
QueryOperationPerformanceLog | Workers (RemoteQueryProcessor) | /var/log/deephaven/binlogs/perflogs/DbInternal.QueryOperationPerformanceLog.System.<internal partition>.<date>.bin.<date.timestamp> |
QueryPerformanceLog | Workers (RemoteQueryProcessor) | /var/log/deephaven/binlogs/perflogs/DbInternal.QueryPerformanceLog.System.<internal partition>.<date>.bin.<date.timestamp> |
UpdatePerformanceLog | Workers (RemoteQueryProcessor) | /var/log/deephaven/binlogs/perflogs/DbInternal.UpdatePerformanceLog.System.<internal partition>.<date>.bin.<date.timestamp> |
WorkspaceData | WorkspaceHelper worker (RemoteQueryProcessor) | /var/log/deephaven/binlogs/DbInternal.WorkspaceData.System.<internal partition>.<date>.bin.<date.timestamp> |
Log-related properties
Logging of the main processes is handled through a standard set of properties. Properties are defined by <property prefix>.<property name suffix>. The property prefixes enables default values to be supplied for all processes, with overrides for individual processes. Each property can be defined multiple times, and when a process starts the appropriate values will be found and used. Prefixes are defined and searched for in the following order:
- Process name - the name of the process, as defined by the process.name property passed in to the process. For example, the query server is usually defined as
db_query_server. This is the most specific level at which a property can be defined. - Main class name - the main class that is used for the process, defined by the call to the JVM. For example, the query server runs the
RemoteQueryDispatcherclass. IrisLogDefaults- if a property is not found with the process name or main class name prefix, the prefixIrisLogDefaultswill be used.
An example of searching for a property is given after the list of properties presented below.
The following is a list of all the properties that can be defined for the processes. The default value is in iris-defaults.prop and can be changed in any configuration by updating the default configuration file.
| Property Name Suffix | Explanation | Default Value |
|---|---|---|
aliveMessageSeconds | If defined to a value greater than zero, an alive message will be written to the event logs periodically, with the interval between messages defined (in seconds) by this value. | 0 (no keepalive message) |
binaryLogTimeZone | Defines a time zone ID to be used in the creation of binary log filenames. | <none - uses the system's default time zone> |
captureLog4j | Defines whether to capture Log4j output and send it to the text logs, including the ProcessEventLog if it is configured for the process. By default, log4j is not installed on Deephaven and this property is false. If third-party products are installed that use log4j, it may be useful to change this to true. This property only works with log4j2 configurations; if it is set to true and the jars are not available, logs will not be captured. | true |
captureDelegatingLogger | Defines whether to capture delegating loggers. Some Deephaven classes use a delegating logger to log behavior, and these log entries are written to sysout. This property causes these log entries to be captured and written to the process default logs, including the ProcessEventLog for workers. | |
captureSyserr | Defines whether or not to capture system error writes from the process and write it to the event logs, including the ProcessEventLog if it is configured for the process. | false |
captureSysout | Defines whether or not to capture system output writes from the process and write it to the event logs, including the ProcessEventLog if it is configured for the process. | false |
logLevel | Defines the level of messages that are written to the event logs. This applies to both the text logs and the ProcessEventLog for each process. See the log levels section below. | INFO |
takeTimeoutMillis | When logging resources are exhausted, the time in milliseconds to wait for resources to become available. -1 means wait forever. | -1 for non-worker processes; 60000 (one minute) for workers. |
useLogAggregatorService | Whether to write audit event logs and process event logs through the log aggregator service. This must be set to true if multiple instances of the same class will run on a server. | false, except for the query workers and remote query dispatcher. |
useMainClassNameForLogs | If this is true, the class name is used when writing log files; otherwise the process name is used. While most times the class name is sufficient, defining this to false can be useful in cases where the same class runs for multiple processes, such as the RemoteQueryDispatcher, which is used for both the db_query_server and db_merge_server processes. | true |
writeDatabaseAuditLogs | Defines whether or not to write audit events to Deephaven. A standard set of audit events is provided; see the standard log messages section below. | false, except for the authentication server, Deephaven controller, ACL write server, query workers and remote query dispatcher. |
writeDatabaseProcessLogs | Defines whether or not to write process events to Deephaven. A standard set of audit events is provided; see the standard log messages section below. | false, except for the query workers and remote query dispatcher. |
For example, the query server will look at the following properties to determine whether to write database audit logs. Once a matching property is found, that value is used. This allows the definition of the property at the individual process level (e.g,. db_query_server vs db_merge_server), the class level (in this case the RemoteQueryDisptacher class runs both the query and merge servers), and at a default level.
db_query_server.writeDatabaseAuditLogsRemoteQueryDispatcher.writeDatabaseAuditLogsIrisLogDefaults.writeDatabaseAuditLogs
By default, all binary logs are written to the binlogs subdirectory under the root directory, usually resolving to /var/log/deephaven/binlogs. See Log files for details on changing this location.
Log levels
The following log levels can be defined in the logLevel property:
FATAL- Any message logged at this log level should indicate that the process is beginning to shutdown due to an error.ERROR- A message of this level indicates that an error has occurred, but these errors may not be critical. Examples of error-level messages include failed connections and authentication issues.WARN- These are warning messages which may indicate a possible issue with the application, but not generally a problem that directly affects operation.INFO- These indicate informational-level messages, typically for operations such as successful connections to remote servers.DEBUG- This log level is for debugging-level messages. Messages of this level will not usually be visible in production logs.
Standard log messages
All processes will have a standard set of messages that are logged. They are defined as follows.
Text messages
The following text messages will be written. If the process is configured to write to the Process Event Log, then they will also be written there.
<process name> INITIALIZING- The process has begun its initialization.<process name> RUNNING- Initialization has completed, and the process has entered normal running state.<process name> ALIVE- If the aliveMessageSeconds property indicates to write alive messages, then this message will be written to the event logs at the specified interval. It means that the process continues to be available, logged on a configurable cycle<process name> SHUTTING_DOWN- This indicates the process is terminating.
Audit Event Log messages
If a process is configured to write to the Audit Event Log, then a standard set of audit events will be written. Some processes provide additional audit events. Following is a list of the standard values in the Event field; the values have the same meaning as the text entries with the same names explained above. Alive messages are not written to the Audit Event Log.
INITIALIZINGRUNNINGSHUTTING_DOWN
Data Import Server log message definitions
Rejecting and closing channel- This should occur seldom, if at all. This message generally points to a configuration issue to which DBAs should be alerted.DataImportStreamProcessor-.+WARN- (regex) If a high rate of warning trace messages are seen from this component (other than during tailer restarts) it may point to a system issue.
Monitoring process startup logs
The application startup logs contain the initial start of the Deephaven java services for each process. Due to these commands producing output to standard out, these logs contain only the start-up commands and any failures before the process is actually running.
Alarms should be raised if the logs contain any message containing the word FATAL or ERROR.
Any change or modification would indicate an application restart is needed. Several alarms over time would indicate repeated process start failure.
Common startup and shutdown logging
Most or all Deephaven processes use an internal library for logging their lifecycle, which can be monitored externally. Monitoring tasks can look for the following strings:
EventLogProcessName INITIALIZING- This is logged very early in startup, as the logging framework is initialized.ProcessMainClassName starting up- This is also logged very early, as part of the environment is initialized.EventLogProcessName RUNNING- This is logged when process-specific initialization is complete and the process is ready.ProcessMainClassName shutting down- This is logged when the environment shutdown is triggered.EventLogProcessName SHUTTING_DOWN- This is logged as one of the initial operations during shutdown processing.
Shutdown processing has a little more structure to it, if that is necessary to monitor. Each process has three ordered groups of shutdown tasks, denoted first, middle, and last. The logging around this process looks like:
Initiating shutdown processingStarting to invoke FIRST shutdown tasksDone invoking FIRST shutdown tasksStarting to invoke MIDDLE shutdown tasksDone invoking MIDDLE shutdown tasksStarting to invoke LAST shutdown tasksDone invoking LAST shutdown tasksFinished shutdown processing
During shutdown processing, Deephaven processes attempt to log as much usable information as possible in order to report on exceptional conditions or errors during cleanup, although this becomes error prone as the logger framework itself must ultimately be shutdown during the last phase, truncating some of the final messages.
Worker logging resource starvation
There are cases where a user’s script may starve a worker of logging resources indefinitely, typically by explicitly using the worker’s log instance to log an extremely long message (approximately 2MB by default). Simply sending text to stdout will not exhaust these resources -- it must be a direct logging call. To avoid hanging the worker, if logging resources are exhausted for a specified timeout (by default 60 seconds), the worker will terminate. This timeout can be configured with the takeTimeoutMillis logging property. See the table above.
Monitoring process run logs
The application run log contains entries of the current activity of the given process. The entries in the run logs are categorized into: DEBUG, INFO, WARNING, ERROR, and FATAL.
Alarms should be raised if the logs contain:
- Any message containing the word
FATAL. - Any message containing the word
shutdown.
Statistics that may be useful:
- Log entries per time interval.
ERRORlog entries per time interval.
- Ratio with total log entries.
- Startup/shutdown messages
Monitoring the Data Buffer Pool
The DataImportServer, LocalTableDataServer, TableDataCacheProxy, and query worker processes (including those used for merge) all operate around an internal pool of 64KB binary buffers used to read, write, and cache binary data. While buffer size is technically configurable, it must be globally consistent for the entire data pipeline, and Deephaven has found that 64KB strikes a good balance between read/write throughput and read/cache amplification.
This pool is highly configurable.
Note
See: See the JavaDocs (com.illumon.iris.db.util.caching.redesign.DataBufferConfiguration) for documentation of the options available.
Most processes only adjust the total size of the pool, which is controlled by one of the following properties (or by the Data Memory Ratio field for a Persistent Query:
DataBufferPool.sizeInBytes(deprecated in Deephaven v1.20200331 and after)DataBufferConfiguration.poolSize- allows more fluent specification (e.g. 24g), rather than simple a raw number of bytes.
Pool sizing is very important for cache performance in workers, especially for the merge operations that re-write intraday data in a historical format.
Pool sizing is even more important at DataImportServer instances. A DIS must be able to allocate one buffer per column file per for each open partition (i.e., partitions with a connected tailer). If a DIS cannot make progress because it has completely exhausted the buffer pool, and it cannot free up any buffer space with a synchronous cleanup, the process will terminate.
Key log lines to look for:
AutoReclaimingObjectPool-DataBufferPool: Failed to take() an item for thread=<thread name>, initiating synchronous cleanup- This means a thread was unable to acquire a buffer in a lock free manner, and will wait and attempt to reclaim space on the current thread. It generally means that the pool is under pressure, and may indicate that the configuration should be changed to increase the pool size or the frequency and aggressiveness of concurrent cleanup.AutoReclaimingObjectPool-DataBufferPool: Unable to take() an item for thread=<thread name>, yielding (<#>/<#>)- This means that a thread was unable to acquire a buffer even after performing synchronous cleanup. This means that all buffers are actively in use and none could be freed. The thread will yield the CPU in order to allow other threads to make progress and hopefully release one or more buffers.AutoReclaimingObjectPool-DataBufferPool: Unable to take() an item for thread=<thread name> after <#> yields- This means that a thread was unable to acquire a buffer after multiple attempts to synchronously clean up and yield the CPU. This is a fatal error, and will be followed by anObjectPoolExhaustedErrorwith messageAutoReclaimingObjectPool-DataBufferPool: Yield limit encountered - no pooled objects available!Subsequent threads that might encounter this scenario during shutdown will instead throw anObjectPoolExhaustedExceptionwith messageAutoReclaimingObjectPool-DataBufferPool: Yield limit previously encountered - no pooled objects available!
Monitoring TableDataException Logs
Many errors in reading data will result in a log message including a TableDataException. While these will often occur in workers, it may be worthwhile to monitor for them in all system processes that are part of read flow in the data pipeline, i.e., DataImportServer, LocalTableDataServer, TableDataCacheProxy.
Generally these will include the name of the service that could not provide data, an explanation of the exception, and details that may aid in investigations. They almost always point to a problem in the system, either due to data buffer pool exhaustion, invalid caches due to data deletion outside of Deephaven-internal mechanisms, software issues, or underlying issues with hardware or file systems.
The key to investigating these issues and reaching a speedy resolution is checking the logs of the process that originated the chain of errors. Often for intraday data reads, this is the DataImportServer.
Resolving cache invalidity issues, which often show up as failures to read an offset past the end of a file, usually requires a restart of the impacted processes. This typically means the DIS or LTDS serving the data, any intervening TDCPs, and the query worker(s) accessing the data.
An example of such an error follows:
Monitoring schemas
At startup, the DIS reads schemas from the configuration service, and loads listener classes needed to parse binary log data received from tailers. If the schema or a listener for a tailed data stream changes while the DIS is running, that stream will stop receiving updates. The details of the problem will be listed in the DIS and tailer logs, and will usually be in the form of IllegalStateExceptions, RuntimeExceptions, or IllegalArgumentExceptions stating that a column did not match a name, did not match a type, or was not found, or that the version number of a binary log file did not match the version numbers of available listener classes.
Correcting such a situation may require:
- Deploying updated schema
- Regenerating loggers and listeners
- Updating remote loggers to use latest schemata and logger classes
- Restarting loggers
- Restarting the DIS process(es)
The most common scenario is that schemas must be deployed, the DIS needs to be restarted, or the schema change needs to be properly managed to not happen intra-partition.
Log messages related to this will generally include text along the lines of:
Channel handling error while processing stream: java.lang.IllegalArgumentException: Unknown column- This means that a column in the data received from the tailer is not found in the schema that the DIS has available to it. Likely needs to be resolved with a schema deployment.Channel handling error while processing stream: java.lang.RuntimeException: Can not find schema Listener element- This means the DIS cannot find the listener code; either it was not deployed, or the DIS must be restarted to find it.Channel handling error while processing stream: java.lang.IllegalStateException:- Often this is going to be an error wherein some binary log files for a partition were written with a newer schema version, and cannot be imported to the same partition without manual intervention.
That said, not all channel handling errors are of severe nature; the impact depends on the nature of the error and the importance of the data.
Metrics
Host metrics
The Operating System records metrics about the usage of the host's underlying physical resources, such as disk space, CPU load, swap usage, etc.
Host metrics are important to evaluate the health or performance of an individual machine, regardless of the Deephaven components and services. The host metrics that should be collected are mainly comprised of usage or performance of the operating system or hardware, such as:
- CPU
- Memory
- Disk space
- Processes
Collecting these metrics will determine a node's health and ability to perform meaningful work in your Deephaven cluster.
General host metrics
- General System Health
- CPU errors
- Memory errors
- SAR data collection or similar for historical performance trending
- Status of all disk drives and/or built-in RAID including battery cache
- CPU Utilization
- Usage break down: %user, %system, %idle, %iowait
- Any blocked processes or any in IO Wait
- System load
- Memory/Swap Utilization
- Any swap utilization should raise an alarm
- Disk Utilization
- Root disk (
/) - General Deephaven database disk (
/db) - Deephaven Intraday disk utilization (
/db/Intraday) - Deephaven Historical disk utilization (
/db/Systems) - Data Import Server (DIS) or any servers performing batch data imports.
- All hosts in the Deephaven cluster or storage server itself
- Root disk (
- Network Utilization
- Bandwidth utilization of network interfaces
Deephaven metrics
Deephaven also records many metrics and events about the internal workings of the system. These metrics cover performance, audit events, system state, etc.
Deephaven metrics are stored in the Deephaven database and can be queried just like any other Deephaven table.
Performance metrics
Deephaven query performance metrics are recorded in the following tables:
| Table Namespace | Table Name | Description |
|---|---|---|
DbInternal |
| Records a large variety of performance metrics about Deephaven queries, including timing measures, memory usage, duration, as well as information about the client. |
Sample queries
Status metrics
| Table Namespace | Table Name | Description |
|---|---|---|
DbInternal |
| Records configuration and state of Persistent Queries along with any exceptions or errors the query may have encountered. |
Sample query
Alerts
Alerting is part of the monitoring system that performs actions based on changes in metric values. The main purpose of alerting is to bring human attention to investigate the current status of your systems. Monitoring systems integrate with Slack, Email, SMS and other communication mechanisms.
Critical email alerts
Deephaven does some internal monitoring and will send email alerts for certain critical errors, such as when Garbage Collection is taking too long, or a reporting job is hung, etc.
Administrators should configure the appropriate email address as to where these critical errors are sent. This could be to an internal group email address or the email can be submitted directly into your monitoring system.
Edit the following properties in the iris-common.prop file:
- Prop filepath -
/etc/sysconfig/illumon.d/resources/iris-common.prop
smtp.mx.domain=- e.g.,mycompany.comcritEmail=- e.g.,on-call-team@mycompany.comsmtp.defaultDomain- Defines the domain in the sender field; if not defined, it is the host name.
Administrating and monitoring Web Server
The Data Import Server (DIS) is used to ingest real-time data into Deephaven. At any given time, it can be handling many different real-time data feeds, and it can be useful to be able to view these feeds and where they originated from. The Remote Query Dispatcher (RQD) launches all query workers, and handles connections from various clients such as Deephaven controllers and consoles. Visibility into these operations can help an administrator understand current load.
Both the DIS and RQD can provide their current status through built-in Web servers. These options are turned off by default and must be enabled by changing the appropriate properties (see the Web Services Properties section below for details on how to do this).
To connect to a Web service, connect to the appropriate port on the server. If the Web service is configured to require SSL, use "https"; otherwise use "http". Depending on the configuration, a password may be required.
For example, if the Data Import Server is running on dataimportserver.host with SSL on port 8086 (its default), its Web server can be accessed from a browser with:
https://dataimportserver.host:8086/
If the Remote Query Dispatcher is running on remotequerydispatcher.host on port 8084 (its default), its Web server can be accessed from a browser with:
https://remotequerydispatcher.host:8084/
Authentication
The Web servers can be optionally configured to require authentication; if this is not turned on, then anybody with access to the server and port can see the details.
If authentication is turned on, then the Web service will use the Deephaven Authentication Server to determine if the user is an authorized Deephaven user. Once this is confirmed, the user's ACLs will be checked.
Configuring ACLs
The ACLs used to validate whether an authenticated user is allowed to access a Web server can be configured with the Deephaven ACL Editor. If a user is a member of the appropriate group or is a superuser, then the user can access the Web server. A user can be allowed to view all Web servers or only a specific one by making them a member of one or more of the following groups.
iris-Webviewers- a member of this group can access any of the available Web servers.<Service name>.iris-Webviewers- a member of this group can access that service's Web server.DataImportServer.iris-WebviewersRemoteQueryDispatcher.iris-Webviewers
Web Servers
Each Web server provides different status pages. It will first show a home page, and the user can click on the available options to see further details.
Data Import Server (DIS)
The Data Import Server provides two options: Server Configuration and Tailer Connections.
The example screenshot below shows the server configuration with which the DIS was started.
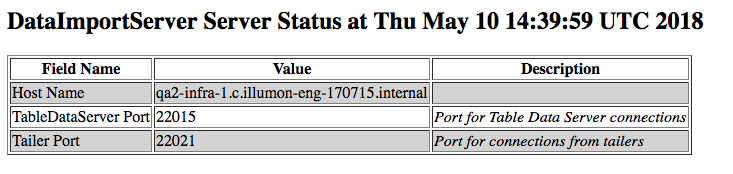
The following columns are displayed.
- Field Name - the name of the server configuration field
- Value - the value for the field
- Description - a brief description of the field, if available
The example screenshot below shows the current tailer connections (i.e., every tailer connection for which this DIS is processing data). Every connection is specific to a namespace/table/column partition value/internal partition value.
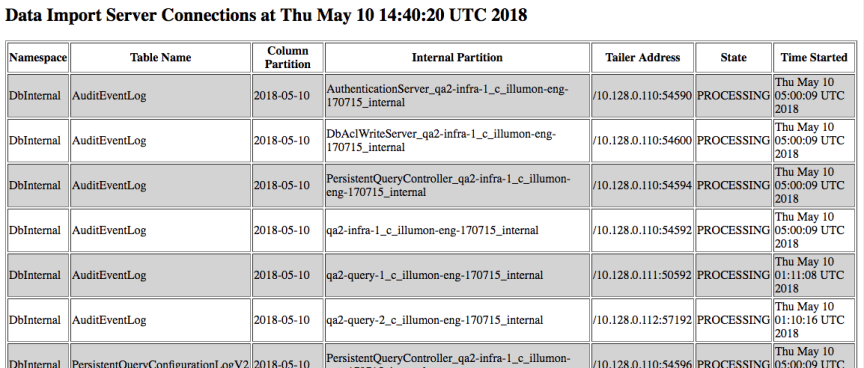
The following columns are displayed for each tailer connection.
- Namespace - the connection's namespace
- Table Name - the connection's table name
- Column Partition - the connection's column partition value, frequently the date
- Internal Partition - the connection's internal partition value
- Tailer Address - the IP and port of the remote tailer
- State - the current state of the connection: -
NEW- a new connection has started but is not running -REGISTERING- a new connection is registering -INITIALIZING- a new connection is initializing -PROCESSING- the connection is processing - Time Started - the time this connection was started
Remote Query Dispatcher
The Remote Query Dispatcher provides three options: Server Configuration, Usage and Job Queue.
This shows the configuration with which the dispatcher was started.
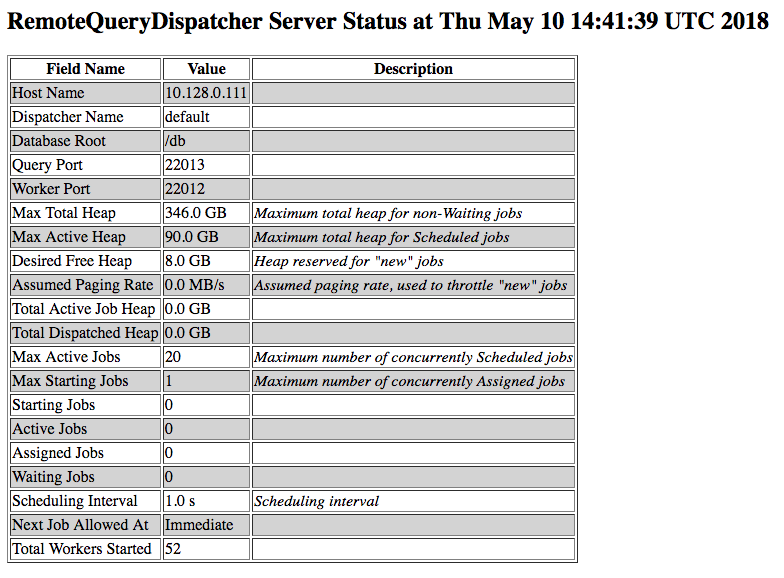
The following columns are displayed.
- Field Name - the name of the server configuration field
- Value - the value for the field
- Description - a brief description of the field, if available
This shows the active client connections to the dispatcher. These will usually indicate Deephaven controller or console processes.
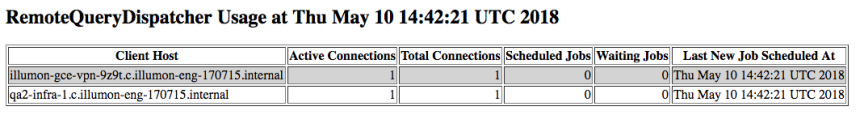
The following columns are displayed.
- Client Host - the host name of the client
- Active Connections - the number of active connections for this host
- Total Connections - the total number of connections received for this host
- Scheduled Jobs - the number of jobs (workers) scheduled (running) for this host
- Waiting Jobs - the number of jobs (workers) waiting to be started for this host
- Last New Job Scheduled At - the last time a new job was scheduled
This displays the active jobs (i.e., worker processes).
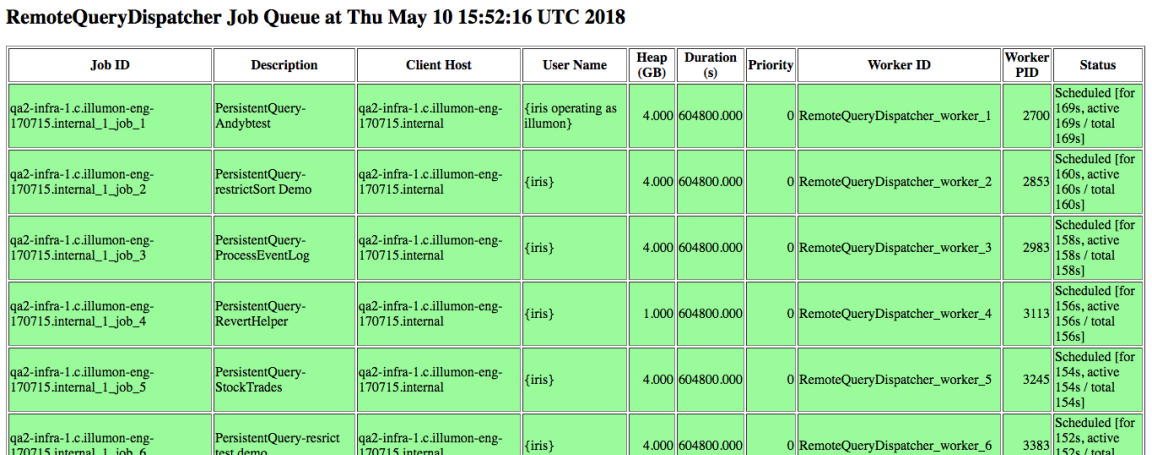
The following columns are displayed.
- Job ID - the internal dispatcher job ID
- Description - a brief description of the job
- A description that starts with "Console-" indicates it's a console
- A description that starts with "PersistentQuery-" indicates that it is a persistent query and is followed by the persistent query name
- Client Host - the host of the client that started the job
- User Name - the user that is running the query
- Heap (GB) - the job's heap usage in GB
- Duration(s) - the maximum duration of the query in seconds
- Priority - the job's priority (a lower number indicates a higher priority)
- Worker ID - a friendly name for the worker, beginning with
worker_followed by an increasing integer. It may be useful to specify the starting worker ID for different remote query dispatchers. For example, starting query worker IDs with a large number on a merge server will allow easier distinction between query and merge workers. In the dispatcher’s appropriate stanza, use the propertyRemoteQueryDispatcher.startingWorkerIdto specify the starting worker ID. The following example, if added to thedbmergestanza, would cause merge servers' worker IDs to start at 1000000:RemoteQueryDispatcher.startingWorkerId=1000000
- Worker PID - the PID of this worker, if available
- Status - the job's current status
- Assigned - the job is assigned to a worker but is not yet running
- Cancelled - the job has been cancelled but has not yet stopped
- Finished - the job has completed
- Scheduled - the job is actively running
- Waiting - waiting to be started
Web Services properties
For the Remote Query dispatcher, the following properties define how the web server runs:
| Property Name | Meaning | Default Value |
|---|---|---|
RemoteQueryDispatcher.shutdownGracePeriodMS | Optional; when set, the dispatcher should try to terminate all workers and wait up to a specified timeout to accumulate logs before going down when possible. | None |
RemoteQueryDispatcher.webserver.enabled | If this is defined as false, the RemoteQueryDispatcher will not provide information about worker status and queues via the web server. | false |
RemoteQueryDispatcher.webserver.port | The port to be used for the Jetty server for the Remote Query Dispatcher. | 8084 |
RemoteQueryDispatcher.webserver.sslRequired | If this is defined as true, an SSL certificate will be required and used for the Remote Query Dispatcher's Web services, and the connection will be over https. | true |
RemoteQueryDispatcher.webserver.authenticationRequired | If this is true, users will be required to authenticate to access the Remote Query Dispatcher's Web services. If authentication is required, then sslRequired must be true (i.e., credentials are not allowed to be sent over an insecure connection). | true |
The following parameters apply to the Remote Query Dispatcher web servers:
| Property Name | Meaning |
|---|---|
RemoteQueryDispatcher.tls.keystore | If SSL is being used, the keystore to be searched to find the certificate for the encrypted https connection. |
RemoteQueryDispatcher.tls.passphrase | If SSL is being used, the passphrase to be used to verify the integrity of the keystore. This string is base64 encoded to prevent accidental exposure; or, alternately, and recommended, this passphrase can instead be stored in an external file. See RemoteQueryDispatcher.tls.passphrase.file. |
RemoteQueryDispatcher.tls.passphrase.file | If SSL is being used, the passphrase to be used for the encrypted https connection. This string in the file is base64 encoded to prevent accidental exposure. The file name and path are not base64 encoded. This property can be and is recommended to be used instead of RemoteQueryDispatcher.tls.passphrase. |
The Data Import Server web server is configured through the data routing service YML configuration file. The following parameters apply to the Data Import Server web servers. Note that db_dis prefix is a default. This prefix must match the DIS name in the data routing service YML configuration file. See Data Routing Service Configuration via YAML for further details.
| Property Name | Meaning |
|---|---|
db_dis.tls.keystore | If SSL is being used, the keystore to be searched to find the certificate for the encrypted https connection. |
db_dis.tls.passphrase | If SSL is being used, the passphrase to be used to verify the integrity of the keystore. This string is base64 encoded to prevent accidental exposure; or, alternately, and recommended, this passphrase can instead be stored in an external file. See db_dis.tls.passphrase.file. |
db_dis.tls.passphrase.file | If SSL is being used, the passphrase to be used for the encrypted https connection. This string in the file is base64 encoded to prevent accidental exposure. The file name and path are not base64 encoded. This property can be and is recommended to be used instead of db_dis.tls.passphrase. |