Deephaven System status and troubleshooting
This section outlines system architecture and resources, along with management tools, logs, troubleshooting, and common failure modes. It is intended as a central point for topics relevant to diagnosing unexpected behaviors, failures, and system availability issues.
Most of the topics in this section are covered in more detail in the Operations guide section of the Deephaven Enterprise documentation.
Quick check of system operation
Details of these commands and underlying processes are in the sections below.
-
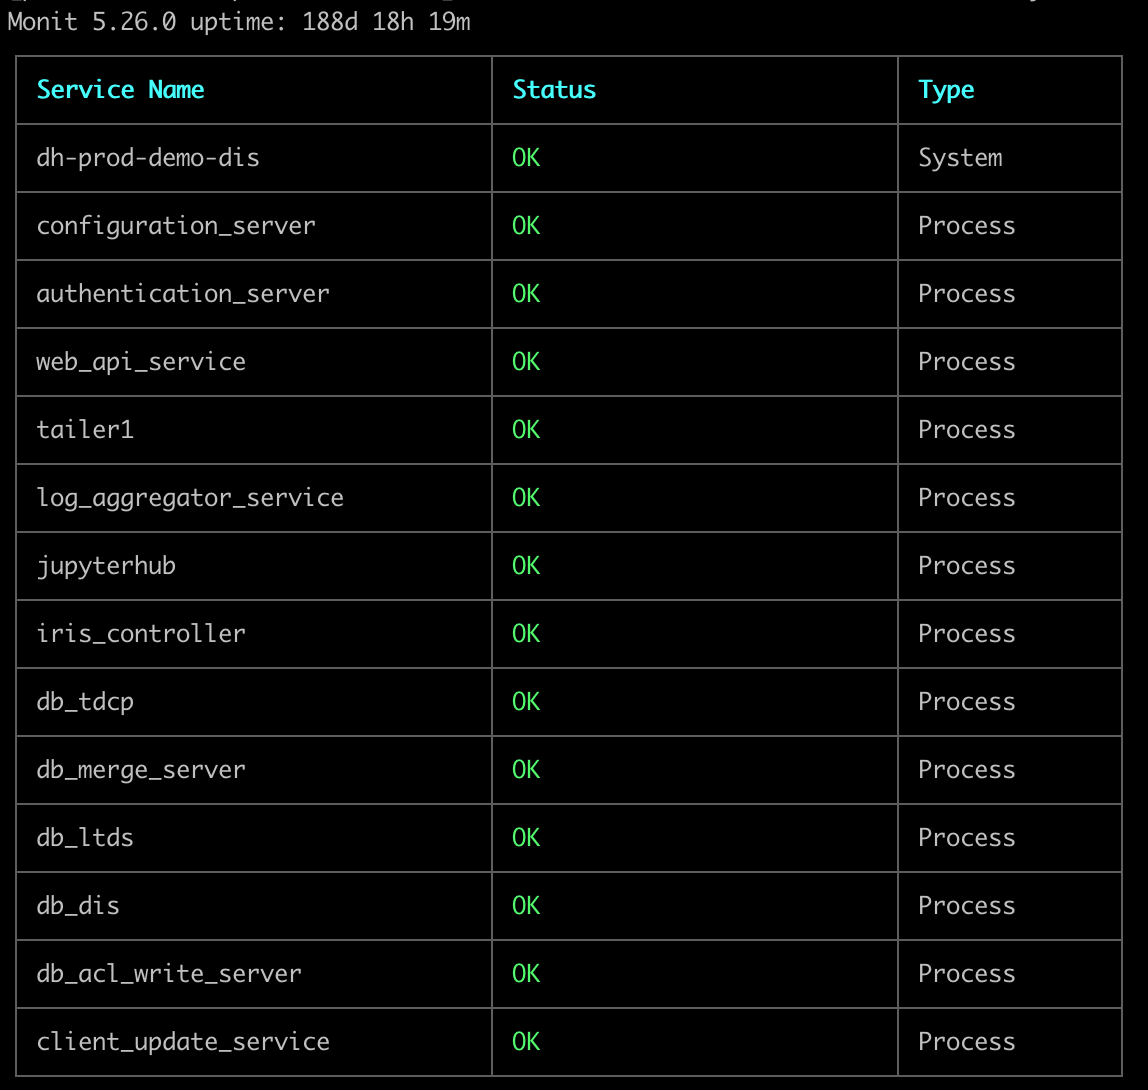
Check for running processes (on each server):
This should report all processes with a green OK status. The number of processes listed will vary depending on server configuration.
-
Attempt to start a Web console session: from a Chrome, Firefox, or Edge browser, go to
https://<your_deephaven_fqdn>:8123/iriside(default port without Envoy) orhttps://<your_deephaven_fqdn>:8000/iriside(default port with Envoy). This should bring up a Web client login dialog. -
Attempt to log in (credentials will vary based on your environment's setup). This should show
Loading Workspaceand eventually bring up a Web Console. -
Click on Query Monitor. Clear any filters on this page. This should show the status of persistent queries runnning in the cluster. At the least the
ImportHelperQuery,RevertHelperQuery, andWebClientDataqueries should be in Running state. If you see "Query Failed", select safe mode from the gear icon.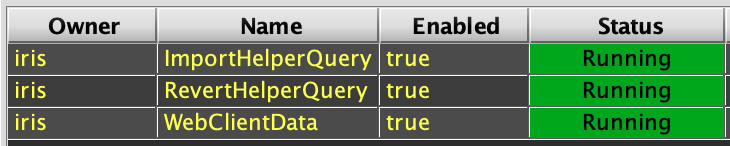
-
Click on an existing Code Studio, or click on (+) New and New Code Studio. This should bring up a New Console Connection dialog.
-
Attempt, one at a time, to start Consoles using each available Query Server, a reasonable amount of heap (e.g., 4GB), and with Groovy and/or Python depending on what is used in your environment.
-
For each Console connection, attempt simple queries to validate that data can be retrieved and displayed:
-
Note
The second query in the above example requires that the LearnDeephaven namespace and data set has been installed. See: Install LearnDeephaven
Common causes of outages
Disk space
Probably the most common cause of outages is an out of disk space condition on one of Deephaven's volumes. See the File system section below for details of different storage areas and their uses, and tips for checking usage.
Expired certificate
An expired certificate will block connection to the Web UI and updating from the Deephaven Launcher tool. An expired certificate will also cause workers to fail after launch since they will not be able to authenticate with their dispatchers. See Checking certificates and Replacing certificates
System (re)configuration
This can happen in particular when configuration management tools are used, which may reset settings, such as sudoers permissions.
- OS settings such as resource limits
- Required sudoers permissions
System services, components, and configuration
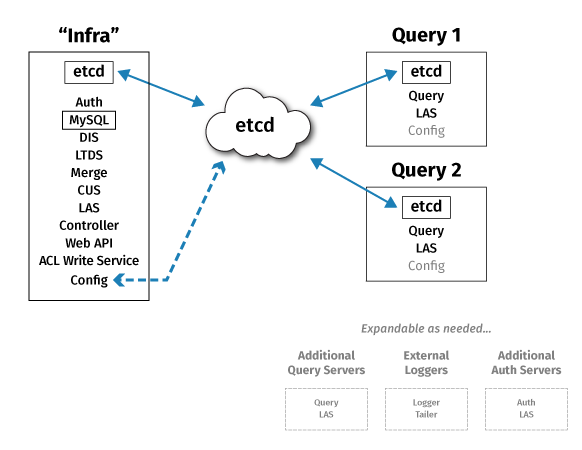
A Deephaven installation consists of a set of Java processes running on one or more Linux servers. Production installations typically have three or more nodes. Most of the systems' configuration is stored in etcd; having three (or more, but always an odd number) of etcd nodes provides high availability access to configuration data, and protects the configuration data in case of the loss of one of the nodes. For example, an overview of a three-node cluster:
Processes
Deephaven servers will generally have three or more Deephaven processes running as services. Most of these processes are interdependent. The one exception is the client update service, which is largely stand-alone, and supports download of files and configuration for the Deephaven Launcher and client application.
Details about Deephaven processes, including the ports on which they communicate, can be found in our Deephaven process ports, Deephaven services, and Runbooks sections of the documentation.
Deephaven application processes
Deephaven uses M/Monit to manage system services. There is a wrapper script for its use (to allow non-root users to use it with sudo) at /usr/illumon/latest/bin/dh_monit.
Monit uses process PID files stored in /etc/deephaven/run to track the running status of the processes it manages. It will try periodically to start a process that failed to start. The update process for status is also rather slow, so it may be a minute or two before services being started show an OK status.
Common commands with /usr/illumon/latest/bin/dh_monit are:
/usr/illumon/latest/bin/dh_monit summaryto show a list of processes and their statuses./usr/illumon/latest/bin/dh_monit startfollowed byallor a process name, to start a process or all processes./usr/illumon/latest/bin/dh_monit restartfollowed byallor a process name, to restart a process or all processes./usr/illumon/latest/bin/dh_monit stopfollowed byallor a process name, to stop a process or all processes./usr/illumon/latest/bin/dh_monit statusto see detailed status information, such as uptime, for all processes, or, if specified, for a particular process./usr/illumon/latest/bin/dh_monit reloadto reload the configuration of M/Monit. This is normally needed only after adding or removing a process (conf files in/etc/sysconfig/deephaven/monit). It does not affect processes managed by M/Monit.
To see a list of processes and their uptime:
etcd
etcd is a dependency for Deephaven, and may be installed on Deephaven server nodes, or on servers that are not part of the Deephaven cluster. If etcd is inaccessible, no Deephaven services, other than the client update service, will be able to start.
etcd is not normally managed by M/Monit. etcd's status can be checked with:
Or, if a generic etcd is used instead of the Deephaven build:
The health of the etcd cluster can be checked by logging in (ssh) to a Deephaven server that is running the configuration_server process, and executing:
This should return a table showing all the nodes in the etcd cluster and some details about their roles and DB size. Something like:
If any nodes instead show context deadline exceeded, that likely indicates that the node is down or unreachable.
MariaDB / MySQL
Earlier versions of Deephaven always used a SQL database hosted in MySQL or MariaDB to store internal application users and permissions. In this version of Deephaven, the access control list (ACL) data can be stored in a SQL database or, optionally, in etcd. If SQL ACL storage is used, then the MariaDB or MySQL database service is a core dependency for Deephaven processes. If the ACL database is not available, no processes other than the client update service will be able to start.
When SQL ACL storage is used, the ACL DB process is not normally managed by M/Monit. MariaDB's status can be checked with:
Or, for MySQL:
Envoy
Envoy is an optionally installed reverse proxy used to allow access to Deephaven services over a single port. It is often run in a Docker container, but can be run as a regular service on a Deephaven server. If Envoy is configured, but not working correctly, Deephaven server side processes will generally appear to be in a good state, but users will not be able to connect to these services from client applications.
The Envoy process is not normally managed by M/Monit. If it is being run as a Docker container, it should be visible running in the output from:
Configuration
Details about Deephaven configuration are available in the Configuration Overview. That topic discusses all aspects of Deephaven configuration. More specifically to startup of service processes, though, processes get their launch configuration (run as, heap allocation, etc.) from files in /etc/sysconfig/illumon.confs, and then read the rest of their configuration settings from properties served by the configuration server, or, for the configuration server itself, from etcd.
Server process startup configuration
If a process configuration problem is related to the process's Java JVM arguments, or the account under which the process runs, those settings can be viewed in /etc/sysconfig/illumon.confs/hostconfig.system and can be modified/overridden by editing /etc/sysconfig/illumon.confs/illumon.iris.hostconfig.
Property file configuration
Property file settings control a significant portion of Deephaven behavior. A large number of the possible settings are controlled by defaults coded in the property file iris-defaults.prop, which is stored in etcd, but is also accessible from /usr/illumon/latest/etc/iris-defaults.prop. These settings can be overridden in install-specific property files, such as iris-environment.prop.
For example, the total heap that a single dispatcher allocates for workers is in the property RemoteQueryDispatcher.maxTotalQueryProcessorHeapMB.
The default for this can be seen by running:
If a configuration change is needed to a setting that a process reads during its initialization or while it is running, there are a few steps that must be followed:
-
Export the configuration property file from etcd, using:
Most installation-specific property changes should go into the
iris-environment.propproperty file. You should not edit theiris-defaults.proporiris-endpoints.propfiles. The next Deephaven installation and upgrade process will overwrite changes toiris-defaults.propandiris-endpoints.prop. -
Edit the exported file and make the needed changes. Potentially, make a backup of the original version that was exported, in case settings changes need to be rolled back.
-
Import the updated file into etcd, using:
You must provide authentication to import properties, either by specifying a key or user and password, or by using
sudoto run this command asirisadminor another Deephaven admin service account.
In most cases it will be necessary to restart or reload processes that use the new/modified property. The authentication server (sudo -u irisadmin /usr/illumon/latest/bin/iris auth_server_reload_tool) and the iris controller can have their configuration reloaded, without having to restart the process itself.
Data routing configuration
The other main configuration data set that might need to be modified to address a problem is the table data services routing YAML. Editing this file is similar to editing properties files:
-
Export the configuration property file from etcd, using:
-
Edit the exported file and make the needed changes. Potentially, make a backup of the original version that was exported, in case settings changes need to be rolled back.
-
Import the updated file into etcd, using:
You must provide authentication to import the routing file, either by specifying a key or user and password, or by using
sudoto run this command asirisadminor another Deephaven admin service account.
Note
This file is in YAML format and has specific white space and delimiter formatting requirements. General YAML can be validated in online YAML validation tools and in some editor utilities. Deephaven-specific validation can be accomplished by adding --validate to the dh_config arguments, or by using the dhconfig routing validate command.
Process dependencies
From a dependency perspective, etcd is a required dependency for all Deephaven server services.
The configuration server (there can be multiple instances of this service in the cluster) is then the next one to start, and is a dependency for all other services except the client update service.
The authentication server is also a common dependency for most other services. There is a co-dependency between the configuration server and the authentication server; when the configuration server starts, it will attempt repeatedly to contact the authentication server, while the authentication server will fail to start if the configuration server is not running or is not yet accepting connections.
Workers are processes that are launched by dispatchers. Workers require a local log_aggregation_server in order to start.
File system
Within the cluster, there are several types of data and product files, which may be on separate volumes.
| Type | Purpose | Typical Path |
|---|---|---|
| Logs | Text and binary logs from Deephaven processes | /var/log/deephaven |
| Intraday | Appended data from Deephaven processes and external streams | /db/Intraday |
| User | Tables created and managed by users. Often shared across servers with NFS. | /db/Users |
| IntradayUser | Ticking/appending tables managed by users | /db/IntradayUser |
| Ingester | Appended data from in-worker data import processes such as Kafka (optional) | /db/dataImportServers |
| Historical | Organized data in Deephaven or Parquet format - usually shared to query servers with NFS | /db/Systems |
| Product Files | Binaries and default configuration files | /usr/illumon/version with a link from /usr/illumon/latest |
| Configuration Files | Installation-specific files and binaries | /etc/sysconfig/deephaven with links from /etc/sysconfig/illumon.d and illumon.confs |
| TempFiles | Service account home directories and storage of cached per-worker classes | /db/TempFiles |
| VEnvs | Virtual environment directories for different Python installations | /db/VEnvs |
Free and used disk space by volume can be seen using the df Linux command:
This is a fairly healthy system, in that, even on the / mount point, which is hosting all Deephaven paths, only 15% is used.
To view disk space used by directory, the du utility provides many options.
In this example, -h is for "human readable" output, and -d1 is to limit depth under /var/log/deephaven/ to one level. The result is space used by subdirectory under /var/log/deephaven/, and a summary of total space used by /var/log/deephaven/.
The /var/log/deephaven/ path is one where it is generally safe to delete old data.
Note
Because of the number of files that typically exist under /var/log/deephaven, rm often cannot be used to delete files. Instead, find must be used to find files to delete, and these can then be passed one at a time to rm.
For example, find /var/log/deephaven -type f -mtime +7 -exec rm {} \; will find all files older than 7 days and remove them.
Warning
Data under /db/Intraday may include data older than 1 day, if the data has not been through a merge and purge process. /db/Intraday/DbInternal is used for Deephaven internal tables, most of which are logs such as the ProcessEventLog and AuditEventLog whose retention is more a concern of policy than of system functionality.
The critical exception to this is the WorkspaceData table, which is stored under /db/Intraday/DbInternal/WorkspaceData. This table maintains all Web user dashboards and notebooks. Unless a merge job has been set up for this table, all of its history must be maintained under /db/Intraday to preserve Web user content which may have been created or last updated some time ago.
See table storage and merging data for more infomation about setting up historical data storage and merge processes to manage data stored in /db/Intraday.
See the WorkspaceData tool for details of how to export and import the contents of the WorkspaceData table.
Troubleshooting tools, tips, and resources
Tools
vi,vim, etc - used to view and edit text files.less- also can be used to view text files.tail -f- to see new rows as they are appended to a watched file.telnet- can be used to verify connectivity to a port endpoint; e.g., to verify that a service is listening and the port is not blocked by a firewall.iriscat- Deephaven tool to dump a binary log file as text.crcat- Deephaven tool to view the details of a table partition on disk.kill -3andjstack- Tools to generate a Java process thread dump.ps- Shows running processes on a Linux system.top- Shows resource utilization information for a Linux system.openssl- Can be used to initiate SSL connections and examine certificates.curl- Can retrieve data from web servers.
Text logs
Deephaven processes that are controlled by M/Monit, and some utilities and stand-alone tools, generate text logs which are usually a good starting point when a server process is failing or is not operating correctly.
These logs are written to sub-directories under /var/log/deephaven.
Binary logs
Some Deephaven processes, especially workers (which are used in consoles and also behind persistent queries), log their details to binary log files, which are then loaded by the data import server into DbInternal tables. See Deephaven internal tables for more details about these tables.
When the system is functional enough that a console can be launched, a user with Deephaven sysadmin access (see Deephaven permissions), can query the ProcessEventLog table to view log output from a worker. When consoles are not functional, iriscat can be used to view binary log files.
Workers are identified by an id, such as worker_2. The ids are assigned by the dispatcher process, starting with 1 for the first worker launched by a dispatcher since it was started. As such, these ids are not sufficient to distinguish a particular worker process. To better identify a particular execution of a worker, workers are also identified by a UUID stored in the ProcessInfoId column of the various DbInternal log tables.
Note
A UUID (universally unique ID) is a value generated using unique hardware details of the machine on which a generator algorithm is running, in conjunction with date and time at which the ID is generated. UUID ProcessInfoIds within Deephaven's scope will always uniquely identify one specific run of a worker process.
From a troubleshooting perspective, the most commonly used internal table is the ProcessEventLog (often shorthanded to PEL). One common scenario is that a Persistent Query has failed, but the last exception which is displayed in the Query Monitor or Query Config panel does not provide sufficient information about the cause of the failure. Another common scenario is that a console dies/disconnects without reporting an exception about what caused the failure (this can happen when a process runs out of heap, or attempts an operation that causes a fatal exception to be thrown).
The first step to read PEL data for a process is to find its worker_id:
- Middle of the console window for a Swing console
- Top right of the console windows for a Web console
WorkerNamecolumn in aQuery MonitororQuery Configpanel
For a Persistent Query that ran previously and no longer shows the WorkerName for the execution event being investigated, the PersistentQueryStateLog table can be queried to find the worker_id and the ProcessInfoId.
This query gets details, including assigned worker ids in the WorkerName column and process UUID in the ProcessInfoId column, for all executions of the Import 12 Persistent Query on February 2nd, 2023.
Once the worker id is known, the PEL can be queried to get all details logged by the worker, from startup through shutdown - although, if shutdown was unexpected/ungraceful, there may be only a fatal message, or possibly no data at all at the end of the log.
This query gets all PEL entries for all workers that were assigned the id worker_263 on on February 2nd, 2023.
Note
This may include worker_263 workers that ran on different servers in the cluster and at different times of the day. It may be necessary to further filter by time and/or Host, to limit to just the one worker_263 instance that is of interest.
If the ProcessInfoId is known, this can be used to more selectively query the PEL, ensuring the results include only events from one particular worker process instance:
The .sort("Timestamp") is necessary because a process may have multiple loggers writing to the PEL, and those messages will be appended to the log in the order in which they arrived. Especially in the case of a fatal exception handler, the messages may arrive before the main log queue is flushed to the binary log file.
The ProcessInfoId for a console worker can be obtained by querying the AuditEventLog. For example, to get the worker startup audit details for query worker "worker_337":
In cases when it is not possible to start a console to query the PEL, the iriscat utility can be used to dump binary log files from disk to a text format where they can be read. The binary logs on each Deephaven server are written to /var/log/deephaven/binlogs/pel.
For example, to dump the contents of a particular PEL binary log file to STDOUT:
The -l directive here is to format the data as a log file, including formatting long epoch offsets to datetime values for easier reading.
Worker launch troubleshooting
Workers are launched by dispatcher processes; these are typically either the db_query_server process, which runs as the db_query user (optionally using a different name) or the db_merge_server process, which runs as the db_merge user (optionally using a different name).
During the initial part of the worker launch process, logging will be to the text dispatcher log under: /var/log/deephaven/query_server or /var/log/deephaven/merge_server. This log will also capture STDOUT and STDERR from the new worker process. Once the worker has started, it will start writing its own binary logs to the ProcessEventLog. See binary logs above for detail about how to query or dump these logs.
Between these two logs, it should be possible to find details of why workers are failing to start.
Process startup troubleshooting
When processes are failing to start, they will usually show status in /usr/illumon/latest/bin/dh_monit summary that cycles between Does not exist, Initializing, and Execution failed. When investigating the cause of startup failure, start with the most underlying dependencies first (see Process dependencies above). For example, if the configuration_server does not start, nothing else can start.
For the particular process being investigated:
- Start with the process's launch log:
/var/log/deephaven/<process_name>/<lowercase_process_name>.log.<yyyy-mm-dd>- There will be one process launch log per date, which will have all launch activity for that process appended to it.
- Look for the last attempt to start the process at the end of the log, or delete the log file and try to start the process again to get a fresh file with only the most recent launch activity.
- If the process starts (as indicated by the launch log), but then dies/restarts, check the process's detailed log:
/var/log/deephaven/<process_name>/<uppercase_first_character_)process_name>.log.current.currentis a link to the most recent log file for this process.- Normally these log files roll every 15 minutes.
- Older logs can be found at:
/var/log/deephaven/<process_name>/<uppercase_first_character_process_name>.log.<date_and_time_when_the_file_was_started>
In the rare case where a process fails to launch and there is little or no information in the launch log, it may be possible to learn more by interactively launching the process.
Process launch commands are stored in .conf files in /etc/sysconfig/illumon.d/monit. For example:
Running "as irisadmin", with sudo su - irisadmin, the iris_controller can be interactively started with:
This will echo to STDOUT all the details as the iris script attempts to launch the iris_controller process.
Deephaven Launcher and Swing console troubleshooting
The Deephaven Launcher is a Java class (com.illumon.iris.bootstrap.IrisConfigurationLauncher) launched by a shell script on macOS and Linux, or by a shortcut on Windows systems. The launcher connects to the Client Update Service of the Deephaven cluster and downloads binaries and configuration files needed to run the Deephaven Swing client.
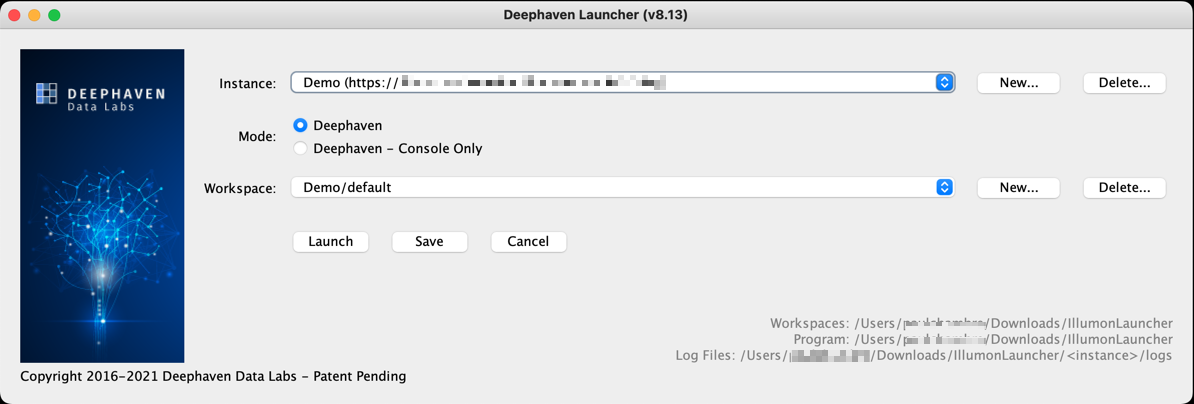
When the launcher is started, it will display paths to where the program's root path is (Program:), and where console instance log files will be written (Log Files:). The launcher may use several properties filesto configure its behavior.
By default, program files and log files are stored under the following locations:
- Windows: %LOCALAPPDATA%/illumon
- macOS and Linux: ~/iris/.programfiles
The launcher handles:
- Adding or selecting a Deephaven cluster (instance) to connect to.
- Connecting to the Client Update Service of the instance.
- Updating the client with the latest versions of binaries and configuration from the instance.
- Selecting a Java JDK installation that matches the version of Java used by the instance.
- Launching the Deephaven Swing client.
The launcher process itself will write a launcher log file to the logs directory under its program path, and will log the details of the above steps there. Once the Swing client has been launched (the dialog shown below), the launcher will terminate, and logging of the Swing client application will be written to an IrisConsole log in a logs subdirectory in an instance directory. The instance directory will have the same name as the nickname given to the instance when creating it.
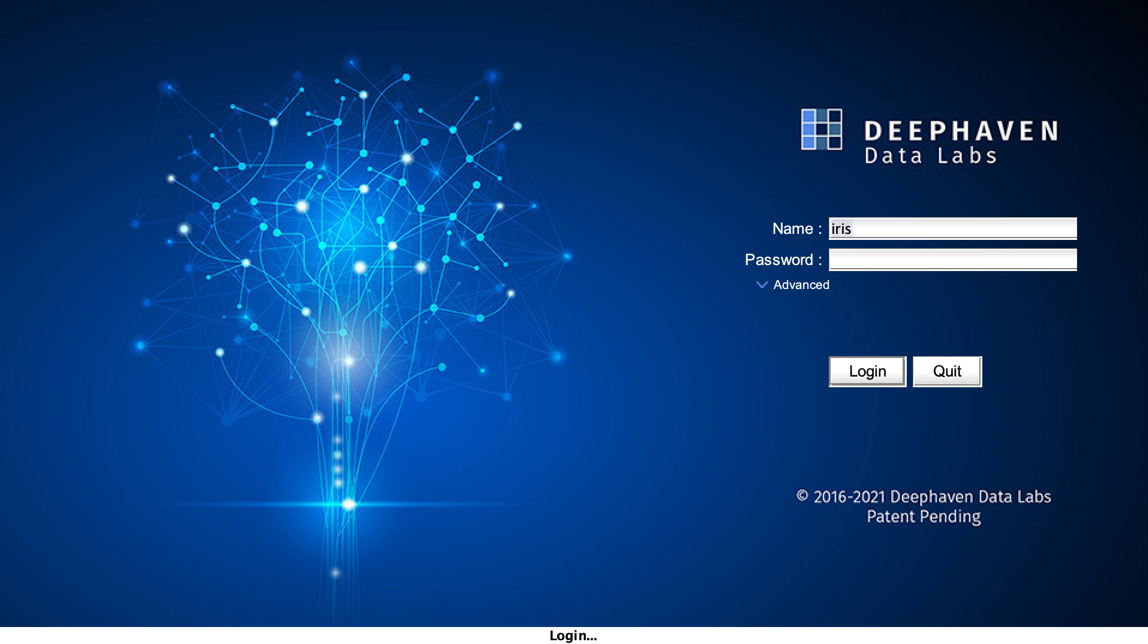
If there is a problem with the certificate used by the Client Update Service, this will generally result in a PKIX exception in the Launcher. This could be due to an expired certificate or to a certificate that is improperly formed or not trustable. See PKI certificates.
If a failure occurs before the client login form is displayed, the launcher log file should have details; if the problem occurs after the login form is displayed, and at any time while using the Swing client, the IrisConsole log file will be the main place to check for details that related to the Swing client application itself. Problems that occur while running queries, including a worker becoming disconnnected while executing a script, will generally have their details available from the ProcessEventLog table (see binary logs, above).
From within the Swing client, the Help\Contact Support action will show client configuration details and the locations of console log files.
If needed, additional JVM arguments for a Swing client process can be added to the jvmargs.txt file in the instance directory. For instance, this might be used to increase the amount of heap allocated to the client process (-Xmx<heap_size_in_meg>m).
Web UI troubleshooting
The most common causes of failures with the Web UI login panel are:
-
Expired or incorrect certificate - This should show a browser message like, "Your connection is not private". The specific message will vary depending on the particular browser and version used. Details about the problem with the certificate should be visible by clicking or right-clicking on a "Not Secure" message or icon typically at the left of the address bar. See replacing certificates for details about updating the certificate file and key for the cluster.
-
WebClientDataPersistent Query is not running - When attempting to log in, the Web login dialog will show "Unable to login: Cannot connect, query config has status 'Stopped'". TheWebClientDataPersistent Query makes available to the Web API Service data needed to present workspaces and dashboards within the Web UI. Normally this Persistent Query is configured to run on the first query server, and to restart automatically if it fails. If theWebClientDataPersistent Query remains down, the easiest way to troubleshoot it will be to launch a Swing client - the Swing client is not dependent on theWebClientDataPQ or even on having any functional dispatchers in order to run. From the Swing client, the Query Config panel can be used to view the status and any recent exception associated with theWebClientDataPQ. If further analysis is needed to find why the PQ cannot run, see binary logs for details on finding the PQ's worker id and its PEL logs. -
Web API service is not running - If this process is not running, the Web UI URL will usually result in a 404 error. The Web API Service is typically installed on the "infra" cluster node, which also hosts the merge dispatcher and data import server services, but it can be installed on any server in the cluster. See processes, process dependencies, and process startup troubleshooting for background on this process and finding details of what would cause it to fail to start.
-
Firewall blocking worker ports - If Envoy is not in use, connections to the Web UI login page will normally be on port 8123, but, once a user is logged in, connections to workers hosting dashboards and consoles will be on other ports. If there is a firewall blocking the other ports, then connecting workers or dashboards may report errors (404, 500, et al), or may simply hang and eventually time out. The solution is to open the needed port ranges, disable the firewall between the server and client networks, or configure Envoy
-
A stale browser page - Depending on network configuration, intermediary routers and firewalls, and browser configuration, it is possible that a Deephaven Web UI login page will look active, but the backing connection has been closed. In this case, attempting to log in may hang on "Authenticating..." or "Loading Workspace...". The solution here is simply to force a refresh of the page (F5, Cmd+R, or click a browser refresh button) and reattempt the login.
-
Outdated Web UI JavaScript - If the Deephaven cluster has been recently upgraded, clients may have an out-of-date version of the
irisapi.nocache.jsJavaScript that supports most Web UI features. This can cause a variety of strange failures. The solution here is to force a reload of JavaScript (Shift+F5, Shift+Cmd+R), or close and reopen the Web UI page in the browser.
If some other failure is seen when attempting to log in to the Web UI, details of what is happening between the browser and the Web API can be viewed by right-clicking on the Web UI login page and choosing "Inspect", "Inspect Element", or similar, depending on the browser being used. This will open a dialog with various tabs or panels. There should be a panel labelled something like "Console". The Console tab/panel will present a log of browser/Web API interactions, which may reveal what is causing the failure. Additional information can be obtained from the Deephaven server, by viewing the Web API Service logs (/var/log/deephaven/web_api_service/WebServer.log.current or ...timestamp), and, in the case of an authentication problem, the authentication server log (/var/log/deephaven/authentication_server/AuthenticationServer.log.current or ...timestamp).
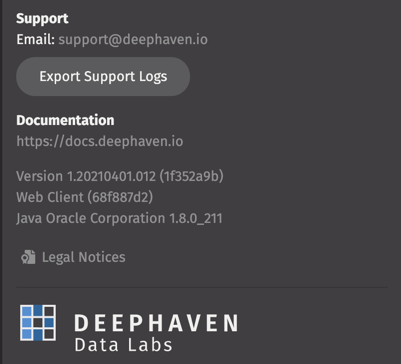
For Web UI problems that occur after logging in, the browser "Inspect" method detailed above is also often helpful, and there is also an "Export Support Logs" button available under the user menu (upper right corner):