Monitoring persistent query performance with dashboards
This guide will show you how to monitor the performance of your persistent queries by creating a dashboard of Deephaven's internal tables. These tables include heap usage and worker, port, server, and host information. The same source data can be used to drill down into the performance of a specific query worker, as discussed in our Troubleshooting and monitoring queries with internal tables guide.
Dashboard for monitoring persistent query memory and initialization times
The following code examples creates a dashboard including graphs of initialization times and heap usage of the last seven days of a specific PQ, and a graph of the heap usage throughout the day of a single run.
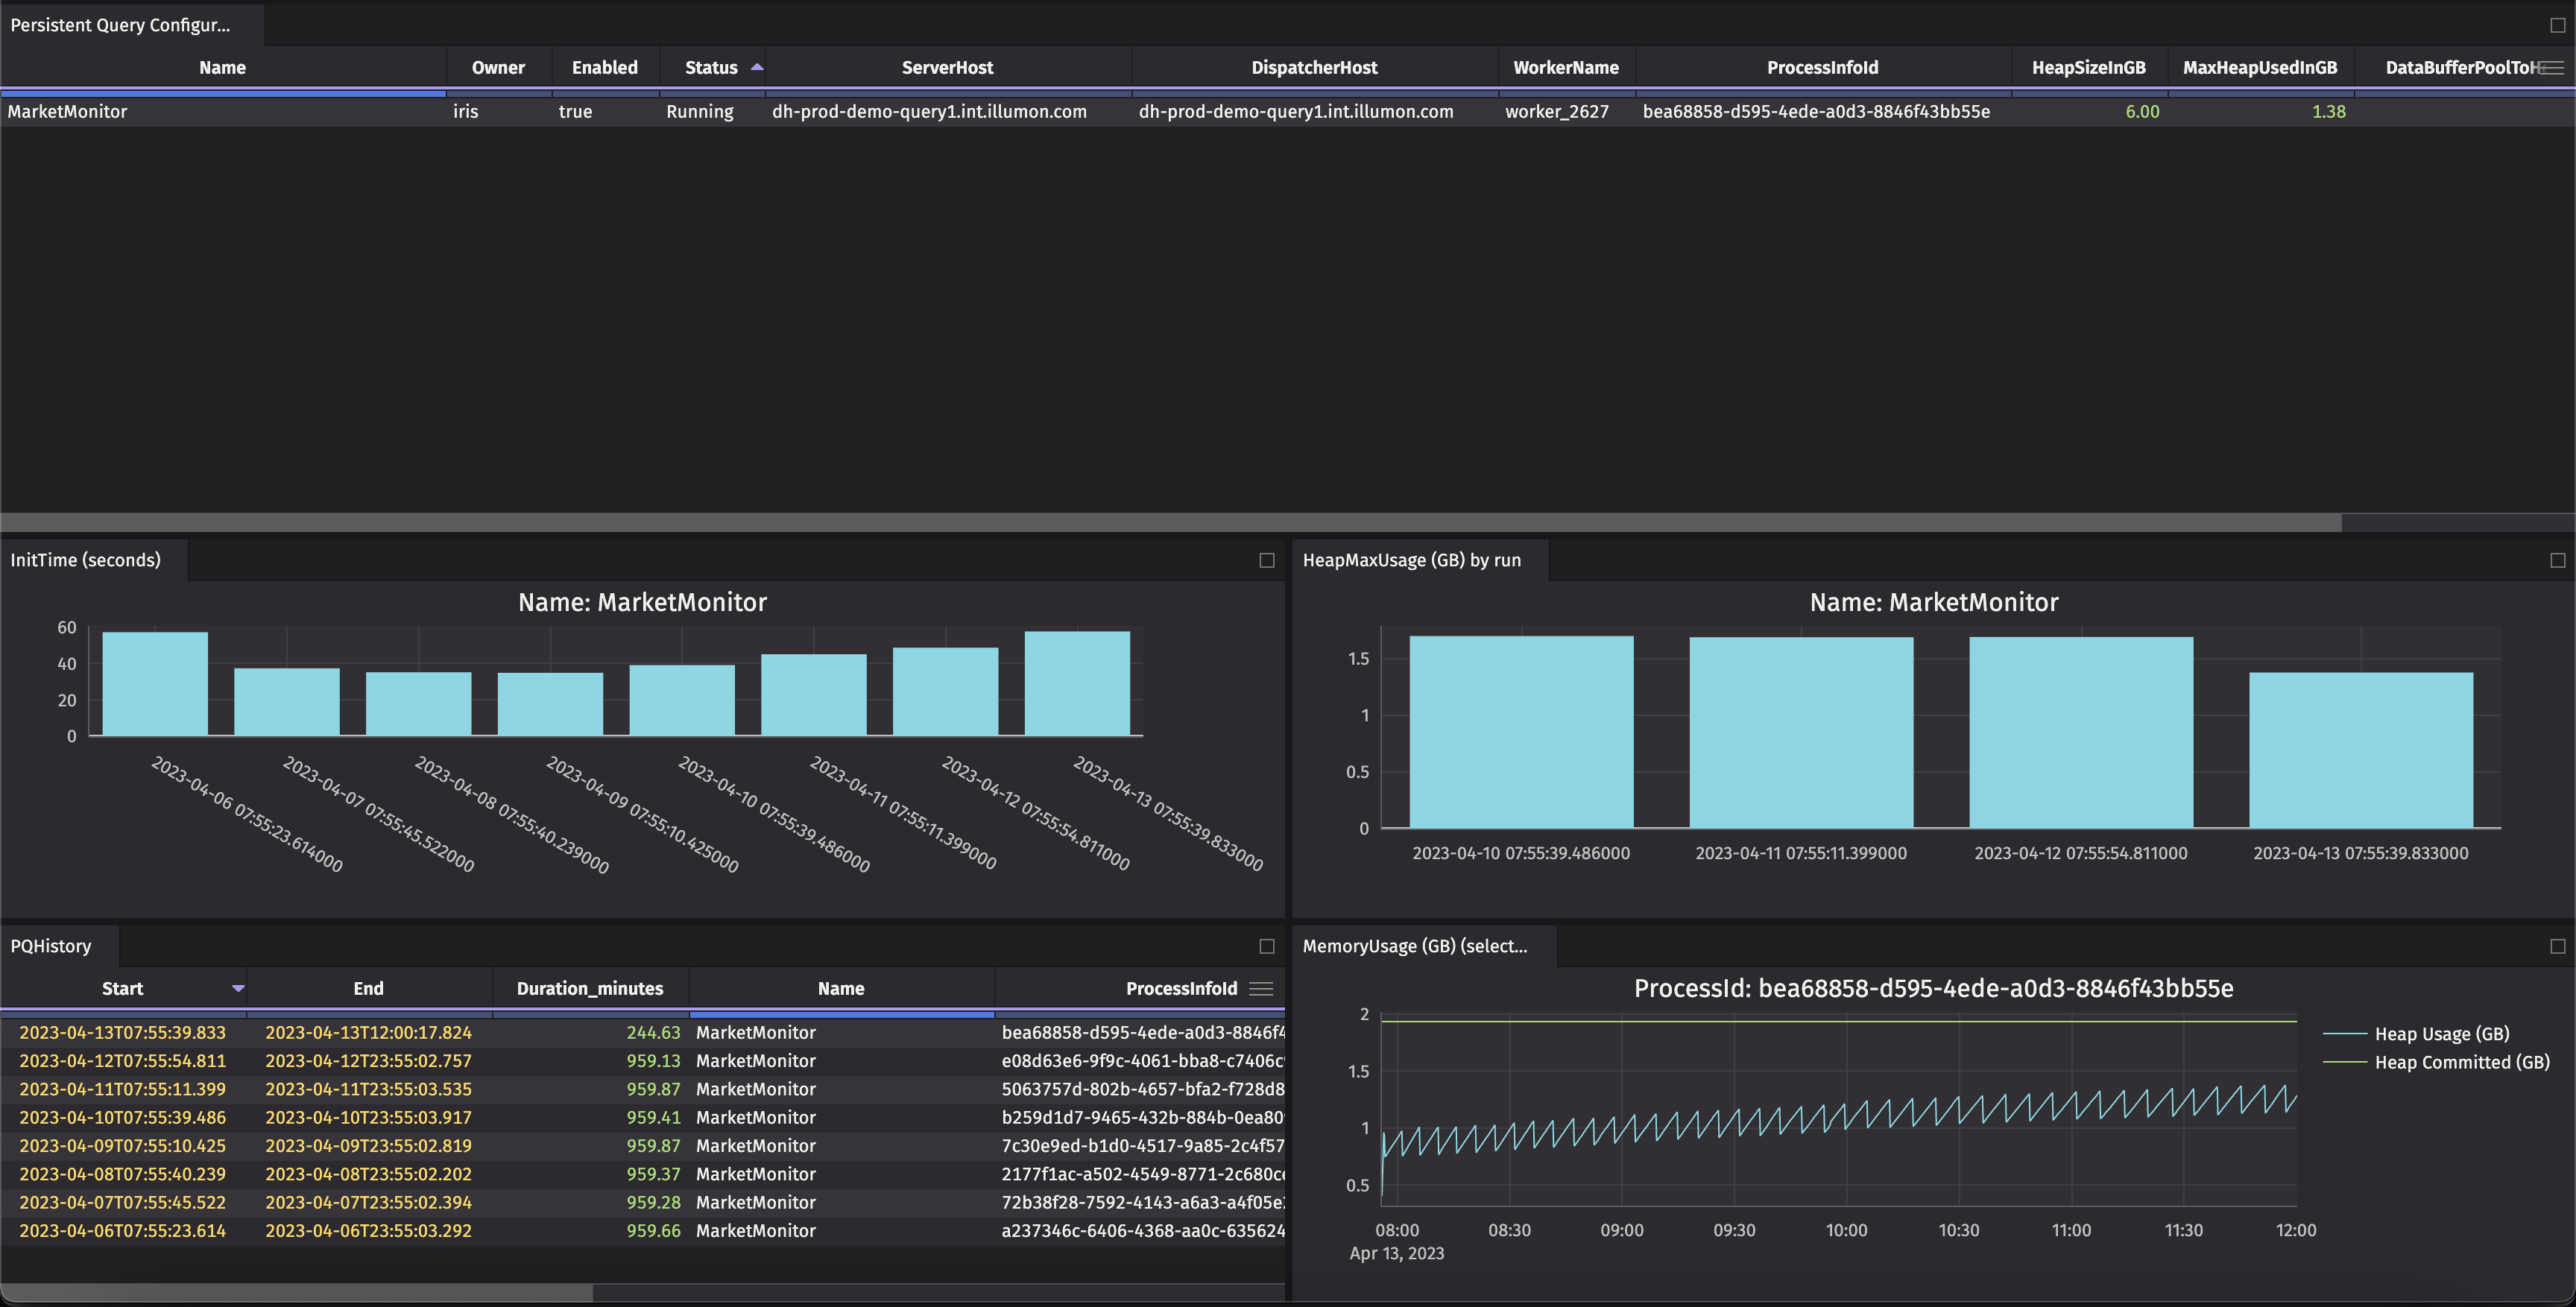
The two tables, PQHistory
and Persistent Query Configurations
, include helpful data such as query status (running, failed,
etc.) and the amount of memory configured vs amount of memory currently used.
Expand for full query:
import com.illumon.util.calendar.Calendars
import com.illumon.iris.db.tables.utils.DBTimeUtils
date = currentDateNy()
previousDate = Calendars.calendar().previousDay(date)
oldestDate = Calendars.calendar().previousDay(7)
bytesPerGB = 1024*1024*1024
Table PQC = merge(db.t("DbInternal", "PersistentQueryConfigurationLogV2")
.lastBy("Name")
.where("EventType != `REMOVED`"),
db.i("DbInternal", "PersistentQueryConfigurationLogV2")
.lastBy("Name")
.where("EventType != `REMOVED`")).lastBy("Name")
Table basePQs = db.i("DbInternal", "PersistentQueryStateLog")
.where("Date=date")
.whereIn(PQC, "Name")
.view("Name","Owner","Status","ServerHost","DispatcherHost","WorkerName","ProcessInfoId")
.lastBy("Name")
Table heapUsage = merge(
db.i("DbInternal","ProcessMetrics")
.where("Date >=oldestDate")
.where("Name = `Memory-Heap.Used`")
.lastBy("ProcessId")
.updateView("MaxHeapUsedInGB=Max/bytesPerGB"),
db.t("DbInternal","ProcessMetrics")
.where("Date >=oldestDate")
.where("Name = `Memory-Heap.Used`")
.lastBy("ProcessId")
.updateView("MaxHeapUsedInGB=Max/bytesPerGB"))
.lastBy("ProcessId")
PQs = basePQs
.naturalJoin(PQC, "Name", "Enabled,HeapSizeInGB,DataBufferPoolToHeapSizeRatio")
.naturalJoin(heapUsage, "ProcessInfoId=ProcessId", "MaxHeapUsedInGB")
.sort("Name")
Table nowTable=timeTable("00:00:01").renameColumns("Now=Timestamp")
Table runningPQHistory1 = db.i("DbInternal","PersistentQueryStateLog").where("Date >= `2023-03-07`","ProcessInfoId != null")
.view("Date","Owner","Name","Timestamp","Status","DispatcherHost","WorkerName","ProcessInfoId","SerialNumber","VersionNumber")
.by(AggCombo(AggMin("Name","DispatcherHost","WorkerName","SerialNumber","VersionNumber","Start=Timestamp"),AggMax("Timestamp"),AggLast("Status")),"ProcessInfoId")
Table runningPQHistory2=nowTable.snapshot(runningPQHistory1)
.updateView("End=(Status==`Running` ? currentTime() : Timestamp)",
"Duration_seconds=(DBTimeUtils.minus(End, Start)/1000000000)","Duration_minutes=Duration_seconds/60")
.dropColumns("Now","Timestamp")
PQHistory = merge(db.t("DbInternal","PersistentQueryStateLog").where("Date >= oldestDate","ProcessInfoId != null")
.view("Date","Owner","Name","Timestamp","Status","DispatcherHost","WorkerName","ProcessInfoId","SerialNumber","VersionNumber")
.by(AggCombo(AggMin("Name","DispatcherHost","WorkerName","SerialNumber","VersionNumber","Start=Timestamp"),AggMax("End=Timestamp"),AggLast("Status")),"ProcessInfoId")
.updateView("Duration_seconds=(DBTimeUtils.minus(End, Start)/1000000000)","Duration_minutes=Duration_seconds/60"),
runningPQHistory2)
.naturalJoin(heapUsage, "ProcessInfoId=ProcessId", "MaxHeapUsedInGB")
.moveUpColumns("Start","End","Name")
.sortDescending("Start")
Table heapOverTime = merge(
db.i("DbInternal","ProcessMetrics")
.where("Date >=oldestDate")
.where("Name = `Memory-Heap.Used`")
.view("Timestamp","ProcessId","HeapUsed=Last"),
db.t("DbInternal","ProcessMetrics")
.where("Date >=oldestDate")
.where("Name = `Memory-Heap.Used`")
.view("Timestamp","ProcessId","HeapUsed=Last"))
.lastBy("Timestamp","ProcessId")
.updateView("HeapGB=HeapUsed/bytesPerGB")
Table nonHeapOverTime = merge(
db.i("DbInternal","ProcessMetrics")
.where("Date >=oldestDate")
.where("Name = `Memory-NonHeap.Used`")
.view("Timestamp","ProcessId","HeapUsed=Last"),
db.t("DbInternal","ProcessMetrics")
.where("Date >=oldestDate")
.where("Name = `Memory-NonHeap.Used`")
.view("Timestamp","ProcessId","HeapUsed=Last"))
.lastBy("Timestamp","ProcessId")
.updateView("HeapGB=HeapUsed/bytesPerGB")
Table directOverTime = merge(
db.i("DbInternal","ProcessMetrics")
.where("Date >=oldestDate")
.where("Name = `Memory-Direct.Used`")
.view("Timestamp","ProcessId","HeapUsed=Last"),
db.t("DbInternal","ProcessMetrics")
.where("Date >=oldestDate")
.where("Name = `Memory-Direct.Used`")
.view("Timestamp","ProcessId","HeapUsed=Last"))
.lastBy("Timestamp","ProcessId")
.updateView("HeapGB=HeapUsed/bytesPerGB")
maxHeapHistoryOC = oneClick(PQHistory.where("MaxHeapUsedInGB > 0"), "Name")
hotOC = oneClick(heapOverTime, "ProcessId")
nhotOC = oneClick(nonHeapOverTime, "ProcessId")
dotOC = oneClick(directOverTime, "ProcessId")
MemoryUsageSingleRun =
plot("Heap Usage (GB)", hotOC, "Timestamp", "HeapGB")
.plot("Non-Heap Usage (GB)", nhotOC, "Timestamp", "HeapGB")
.plot("Direct Usage (GB)", dotOC, "Timestamp", "HeapGB")
.show()
HeapMaxUsageHistory = catPlot("Heap Usage (GB) By Execution", maxHeapHistoryOC, "Start", "MaxHeapUsedInGB").show()
To filter the graphs to a specific query, use a OneClick panel or or the Linker tool to link the graphs to the dashboard's PQHistory and PQ configuration tables.
Underlying data
This dashboard uses several tables within the DbInternal
namespace. It can be helpful to know what data
is available in case you want to create your own views.
- The PersistentQueryConfigurationLogV2 table contains the configuration information for all persistent queries. This includes the owner, what server it will run on, when it was last modified and by whom, etc.
- The PersistentQueryStateLog
shows the status (
Running
,Initializing
,Failed
, etc.) of all persistent queries. - The ProcessMetrics table contains (among many other metrics) the heap usage data used in this dashboard.
More information can be found in the troubleshooting documentation.
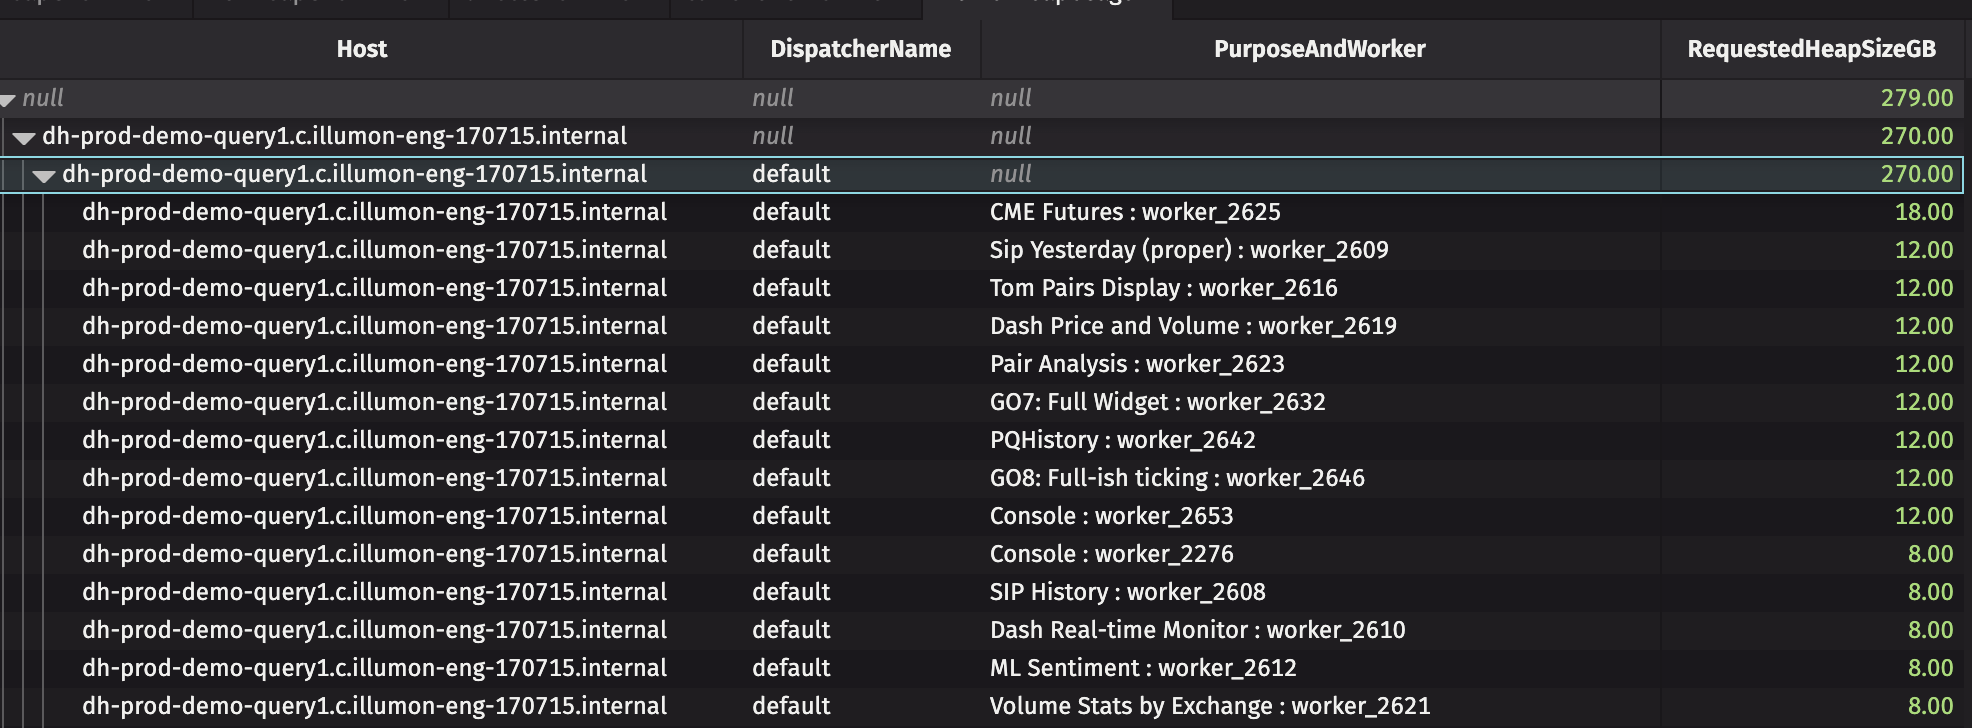
Dashboard for monitoring server usage
This dashboard calculates the heap usage of all persistent queries and breaks it down by server. This can help in load balancing your Deephaven cluster. It also shows all current workers and their server hosts, heap allocation, and PQ name (if applicable).
Expand for full query:
date = currentDateNy()
cutoffDate = minus(DBDateTime.now(),7*DAY).toDateString()
cutoffTime = minus(DBDateTime.now(), 5*MINUTE)
// get details about workers that are alive
Table activeWorkers = db.i("DbInternal","ProcessEventLog")
.where("Date>=currentDateNy()")
.lastBy("ProcessInfoId")
.where("Timestamp >= cutoffTime")
.view("ProcessInfoId", "WorkerName=Process", "Host")
// get dispatcher details and remove any recently terminated workers
Table currentWorkers = activeWorkers
.join(db.i("DbInternal","AuditEventLog")
.where("Date>=cutoffDate","Event=`Starting worker`")
.update("PPID=Details.split(`:`)[2].trim()")
,"ProcessInfoId=PPID"
,"Process,ServerPort")
.updateView("DispatcherName=Process == `db_query_server` ? `default` : `mergedispatcher`")
.dropColumns("Process")
.whereNotIn(db.i("DbInternal","AuditEventLog")
.where("Date>=cutoffDate","Event=`SHUTTING_DOWN`"),
"ProcessInfoId")
currentWorkerInfo = currentWorkers.naturalJoin(
db.i("DbInternal", "QueryPerformanceLog").where("Date>=cutoffDate").lastBy("ProcessInfoId"),
"ProcessInfoId","RequestedHeapSize")
.where("!(isNull(RequestedHeapSize))") //filter out workers which probably stopped ungracefully
.update("RequestedHeapSizeGB=RequestedHeapSize/(1024*1024*1024)")
.dropColumns("RequestedHeapSize")
.naturalJoin(db.i("DbInternal", "PersistentQueryStateLog").where("Date>=date").lastBy("ProcessInfoId"),
"ProcessInfoId",
"PQName=Name")
workerHeapUsage = currentWorkerInfo
.update("PurposeAndWorker = (PQName==null ? `Console` : PQName) + ` : ` + WorkerName")
.sortDescending("RequestedHeapSizeGB")
.rollup(
AggCombo(AggSum("RequestedHeapSizeGB"))
,"Host"
,"DispatcherName"
,"PurposeAndWorker")
Underlying data
This dashboard uses several tables within the DbInternal
namespace. It can be helpful to know what data
is available in case you want to create your own views.
-
The ProcessEventLog table contains the logs (
stout
,stderr
, etc.) of all query workers. We use it here to get a table of theProcessInfoId
,Host
, andProcess
(the name, e.g.worker_1523
) of all query workers. -
The AuditEventLog: this dashboard uses the
Starting worker
event to get the server port and process name of the worker. -
The QueryPerformanceLog table contains query-level performance metrics. It's used here to get the
RequestedHeapSize
of each worker. -
The PersistentQueryStateLog (see above) is used to get the name of each PQ.