Take Twitter's temperature with Deephaven: a sentiment analysis tutorial
Twitter is a treasure chest of data for social sentiment
January 11 2022


The money made in meme stock trading is a stunning example of the power of community sentiment. Nevertheless, you could spend hours manually scrolling social media without gleaning meaningful insight. Or, you could equip yourself with automation and ML to measure sentiment - in real time - and produce useful results.
Python and TensorFlow's natural language processing libraries and Deephaven's stream-and-batch table engine together meet this challenge. Below, I share the details of an app I made to do natural language processing of the Twitter feed and marry it to stock price information - all in real time.
This starter program looks at tweets about cryptocurrency; however, the possibilities are endless and we encourage you to tailor these queries to suit your interests.

The program showcased here integrates Deephaven with Twitter and Python's Natural Language Toolkit (NLTK) to pull recent tweets and evaluate sentiment in real time. We start by pulling the data and running a SentimentIntensityAnalyzer on each tweet. We then aggregate the posts to see the overall positivity or negativity of that term on Twitter with time.
Prereqs
- To get started, go to our example repo or run the following commands to download all the code and dependencies to work with Docker.
A start script will install the needed Python modules and launch the Deephaven IDE.
To run it, execute:
- Twitter provides an API to make it easy to pull public tweets. In order to use this code as-is, you need to also have a Twitter Developer account and copy your Bearer Token.
Note
Free access to the Twitter API is no longer available. However, the code and concepts in this blog are still valid for users with a paid developer account.
- Import the appropriate packages to use each platform. I perform a
pip installinside Deephaven. This ensures my program runs without any extra modifications needed. For other ways to install Python packages, see our How to install Python packages guide.
Run the program
This program is intended to be fine-tuned to fit your data needs. Below are the values you'll need to change to customize the program for your specific use case and information.
In this example, I perform sentiment analysis on Dogecoin tweets over the course of one week.
-
First, you need the token I mentioned above. Important: the Bearer Token is provided by Twitter and each developer has a monthly limit, so keep this token private.
-
I search for any tweet that contains the term
DOGE. -
Since there is a tweet-rate-limit and I want to see the tweets for the last seven days, I collect just 10 tweets for each time pull with
max_results = 10. I recommend using low numbers for testing. When you are ready for production, increase as needed, while keeping in mind the rate limit. -
Next, to see how the sentiment of tweets change with time, I divide those seven days up into discreet
time_bins. More bins will give you the ability to see more refined changes in the social sentiment, but would also pull in more tweets, which means you hit your rate limit quicker. -
My Twitter access level limits the amount of historical tweets I can pull to seven days, so I set
time_history = 7. This is the standard for non-academic searches.
Configure your functions
In this section of code, we created the functions needed to pull the data from Twitter.
- Twitter provides a lot of sample code with the v2 API. These functions are pulled from the Github Twitter-API-v2-sample-code repo so that we connect to the needed endpoints with the appropriate authorization.
- Tweets contain a lot of metadata that can be useful. Here, I set the fields I like to work with: just the
tweet.fieldsanduser.fieldsdata to keep it simple. Using these fields allows me to weigh tweets based on the popularity of the tweet or user and ignores location information. The rest are left for you to add as needed and might be useful if you want to limit the search to certain places in the world.
-
Now we have the function that pulls the tweets. I've separated it from the previous code to make it easier to change the
query_paramsto the date zone you want. -
By default, if given a start time range of seven days ago, only recent tweets will be pulled. Since I want a guarantee of dates in bins, I supply the exact start and end date for each request.
-
This function is called for each time bin and returns all the tweet data requested in JSON format.
Clean the tweets
Since I'm performing a sentiment analysis on the content of the tweets, I clean each tweet. This is optional but provides a more uniform appearance to the tweets in the table.
Assess sentiment
Next, I run each tweet through the NLTK SentimentIntensityAnalyzer. This returns the polarity score of the tweet - that is how positive, negative, and neutral a tweet is, as well as the combined score. Often a tweet will be filled with made up words, acronyms and such. These generally are scored as neutral and do not impact the analysis.
Put our data in a table
This last function is needed to create a table to store our data.
-
We use Deephaven's DynamicTableWriter class, which calls the function for each iteration of the dynamic table.
-
We add to the table for each
time_bins.
By formatting the data with Deephaven dtypes, we make it easy to join, filter, summarize, plot and perform other analysis on our table.
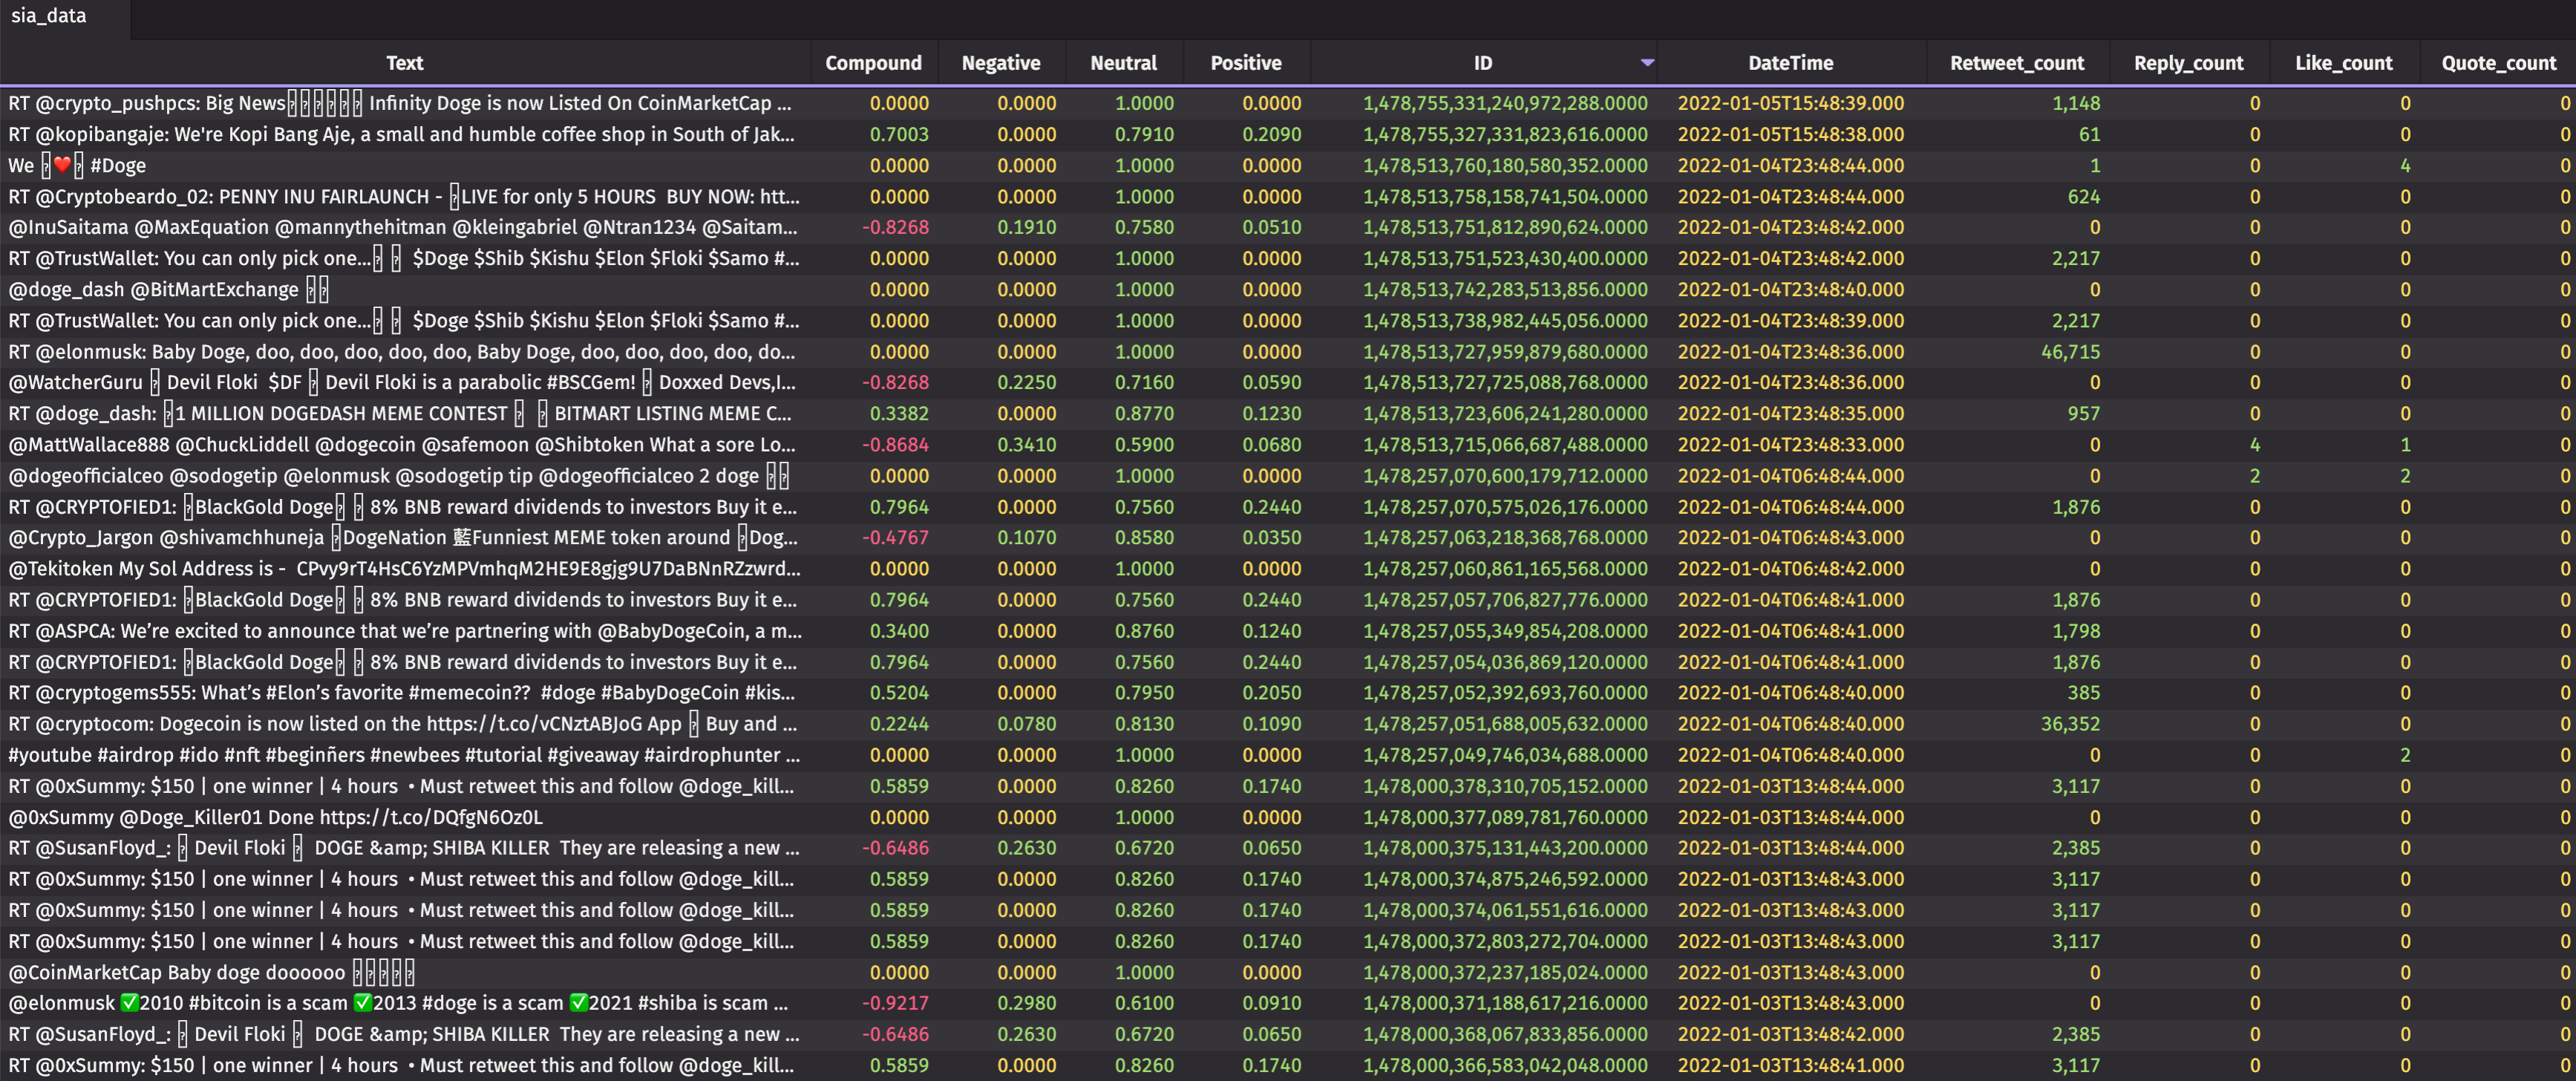
- Finally, I create the
tableWriter_siaand execute the threading to run the above function. This will create a tablesia_datathat fills with the tweets and their metadata, as well as the sentiment of each tweet.
Analyze the data
Now the fun part. Let's do some analysis on the tweets so we can see how the search term's positivity and negativity have changed with time.
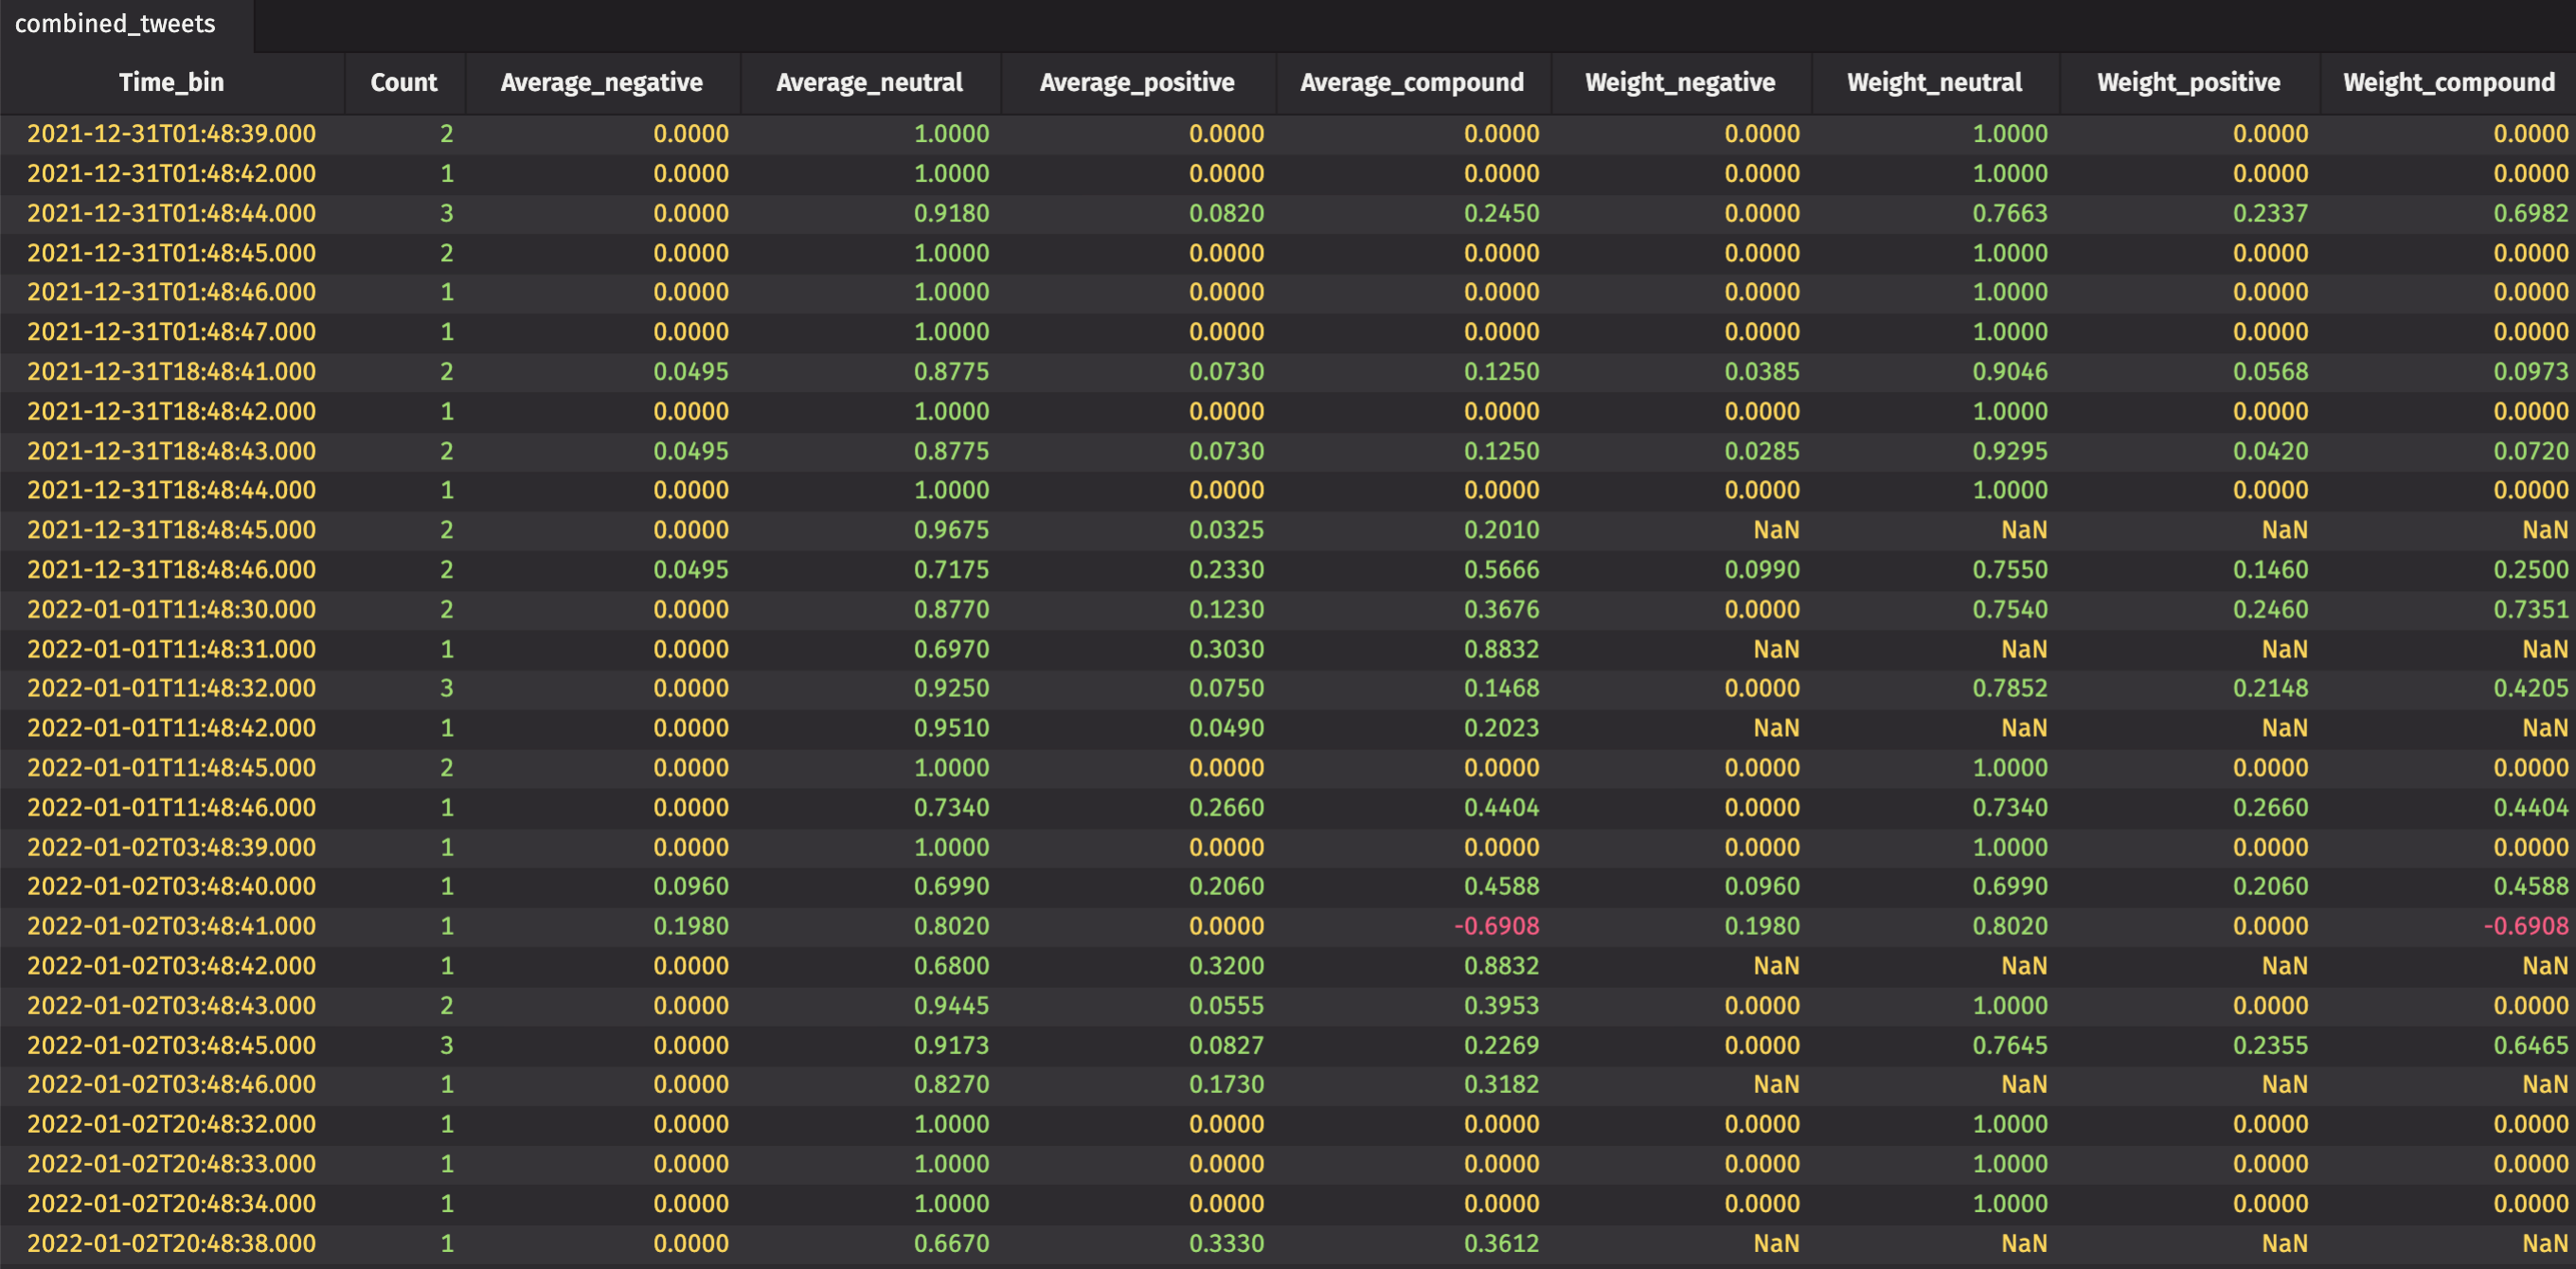
First, let's aggregate the tweets so that we can get a summary of each tweet inside our chosen time bins.
This code:
- Creates a series of averages and weighted averages.
- Creates the
combined_tweetstable that shows us the overall sentiment each minute for our time bins.
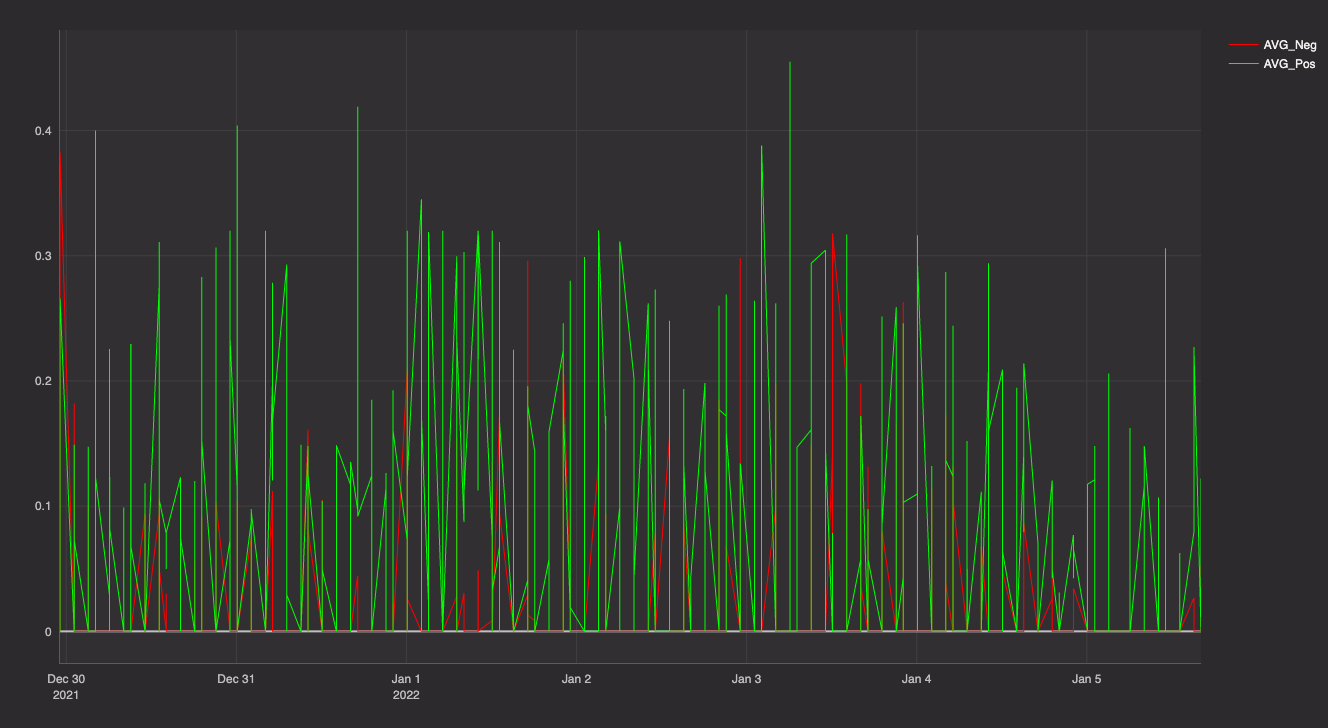
The table's cool, but not as useful as a plot. I use Deephaven's plotting methods to create a nice visualization of my data.
Your turn
This code provides a basic starter. You can use it to make your own searches, tie to other programs, or just see how social media is doing.
We hope this program inspires you. If you make something of your own or have an idea to share, we'd love to hear about it on Gitter!