How to implement streaming analytics with Redpanda & Deephaven
Redpanda and Deephaven combined make the future of data
January 12 2022


New and dynamic data drives business value. Modern real-time systems are increasingly engineered as a combination of a pub-sub system for streams and a query engine that can deliver AI, table operations, and application logic. Dave Menninger, an analyst at Ventana Group, predicts, "In the next 3-5 years, streaming will become the default way in which we deal with data." This way forward must recognize that historical data will also continue to provide value and context to analytics at the leading edge. Any approach must bring together batch and stream.
The combination of Redpanda and Deephaven offers an exciting and empowering solution. Redpanda is a leading streaming platform, and Deephaven is a query engine and interoperable framework built from the ground up to work with real-time data.
Stock analysis is an obvious example. Historical data provides rich training sets for the predictions that the real-time data drive. Below, we access live stock market data from dxFeed through their Python API and publish it to Kafka Redpanda topics. Those are then streamed into Deephaven, where they are rendered as "tables that update", enabling users to use Python and do table operations in familiar ways, magically inheriting the real-time changes.

Redpanda: Our choice for streaming data
Redpanda is a good choice for your event stream technology because it has good performance and is easy to use.
- Redpanda's Docker image makes it simple to get a mission-critical application running with little set-up.
- As a Kafka compatible platform, it is much simpler to operate than alternatives. It does not need Zookeeper and has a built-in schema registry. (If that sounds like Greek, just use Redpanda!).
- Redpanda is often a lower-latency solution than straight Kafka.
Deephaven: Streaming tables made easy
The Deephaven value proposition is deeply mingled with that of streaming data. Deephaven is a query engine and a framework of integrations and experiences that extends the value of real-time streams to Python AI, interactive visualizations, and data-driven development in a number of languages. It is designed to serve a variety of use cases and to be valuable to a range of user personas.
Stream "live" stock data
Below are a series of simple commands that will help you clone a project for streaming data from dxFeed.
The code will map nine different sources of data from dxFeed to nine respective topics in Redpanda, and then stream them into nine distinct (updating) tables in Deephaven. With this pipeline, you can deliver joins, aggregations, and projections on the real-time tables, as well as bring third-party and custom functions and libraries to the data.
It's easy to run this application and see the live stock market data. If you have Docker installed and a terminal handy, enter the commands below and go to http://localhost:10000/ide.
Overview
The dxFeed demo feed has a handful of symbols with a 15 minute delay on publication during trading hours. To provide events during non-trading hours, the demo feed will replay random old events every few seconds.
The producer used in this guide creates the following Deephaven tables:
trade: Last Sale price for a given instrument + daily volumequote: Bid/Ask prices for a given instrumentcandle: Creates Open, High, Low and Close (OHLC) dataprofile: Instrument profilesummary: Open-High-Low-Close values for current day and Close for previous trading dayorder: Market depth. Level 2 quote by market maker / regional exchange quote / element of order bookunderlying: Snapshot of computed values that are available for a given underlying symbol based on the option prices on the markettimeAndSale: Trade in a tape of trades for a given instrumentseries: Snapshot of computed values that are available for options series for a given underlying symbol based on the option prices on the market
With the instrument:
Dependencies
- The Deephaven-core dependencies are required to build and run this project.
Components
Dockerfile- The dockerfile for the application. This extends the default Deephaven images to add dependencies. See our guide, How to install Python packages, for more information.docker-compose.yml- The Docker Compose file for the application. This is mostly the same as the Deephaven docker-compose file with modifications to run Redpanda, application mode, the dxFeed Kafka producer, and the custom dependencies.redpanda_start.sh- A simple helper script to launch the application.data/app.d/start.app- The Deephaven application mode app file.data/app.d/tables.py- The Deephaven queries to initialize tables.data/layouts/layout.json- The Deephaven layout to show all initialized tables.data/notebooks/query.py- A Deephaven sample query to run on tables.dxfeed/requirements.txt- Python dependencies for the application.dxfeed/fin_pub.py- The Python script that pulls the data from dxFeed and streams to Redpanda.
Use the data
Navigate to http://localhost:10000/ide. To view the tables, you might need to refresh the page by going to the top right Panels tab and clicking the circular refresh button.
We have a series of Python scripts, one for each type of data, to subscribe to dxFeed data. Each Python script is run in a separate Docker container to speed up the data retrieval process. We want to emphasize that using Redpanda for the Kafka stream is important, as it is 10x faster than other Kafka compatible streams, which enables the data to stream smoothly.
To use dxFeed, Docker containers install the package via pip. Then, we import the package and create an endpoint at the demo feed.
We define an object so that each has a subscription and handler to subscribe and receive data.
Next, we generate a subscription for each type:
Each subscription is published in the correct data format to a Redpanda topic.
To publish to a Kafka stream with Redpanda, we useconfluent_kafka. Docker installs the package via pip. Then we import the package.
To produce data, we create a producer with a local port of 29092 as defined in the docker-compose.yml:
To stream to Redpanda, we simply call the producer for each topic with the correct data. Here is a function that cleans the trades data and then sends it to Kafka:
Subscribe to data
That is all the pre-work. Now for the live interface. Inside a "while true" loop, we execute so that each subscription object retrieves a DataFrame and converts that to JSON format.
For every row of that JSON, we clean the data and publish it to the stream with the clean_trades() method.
This Python script is running independently with Docker for each topic.
Launch Deephaven
We then load Deephaven with Deephaven's application mode. Our layout shows all the tables and includes an InputFilter ready to limit data and a sample query to run.
Below is a diagram of the process.
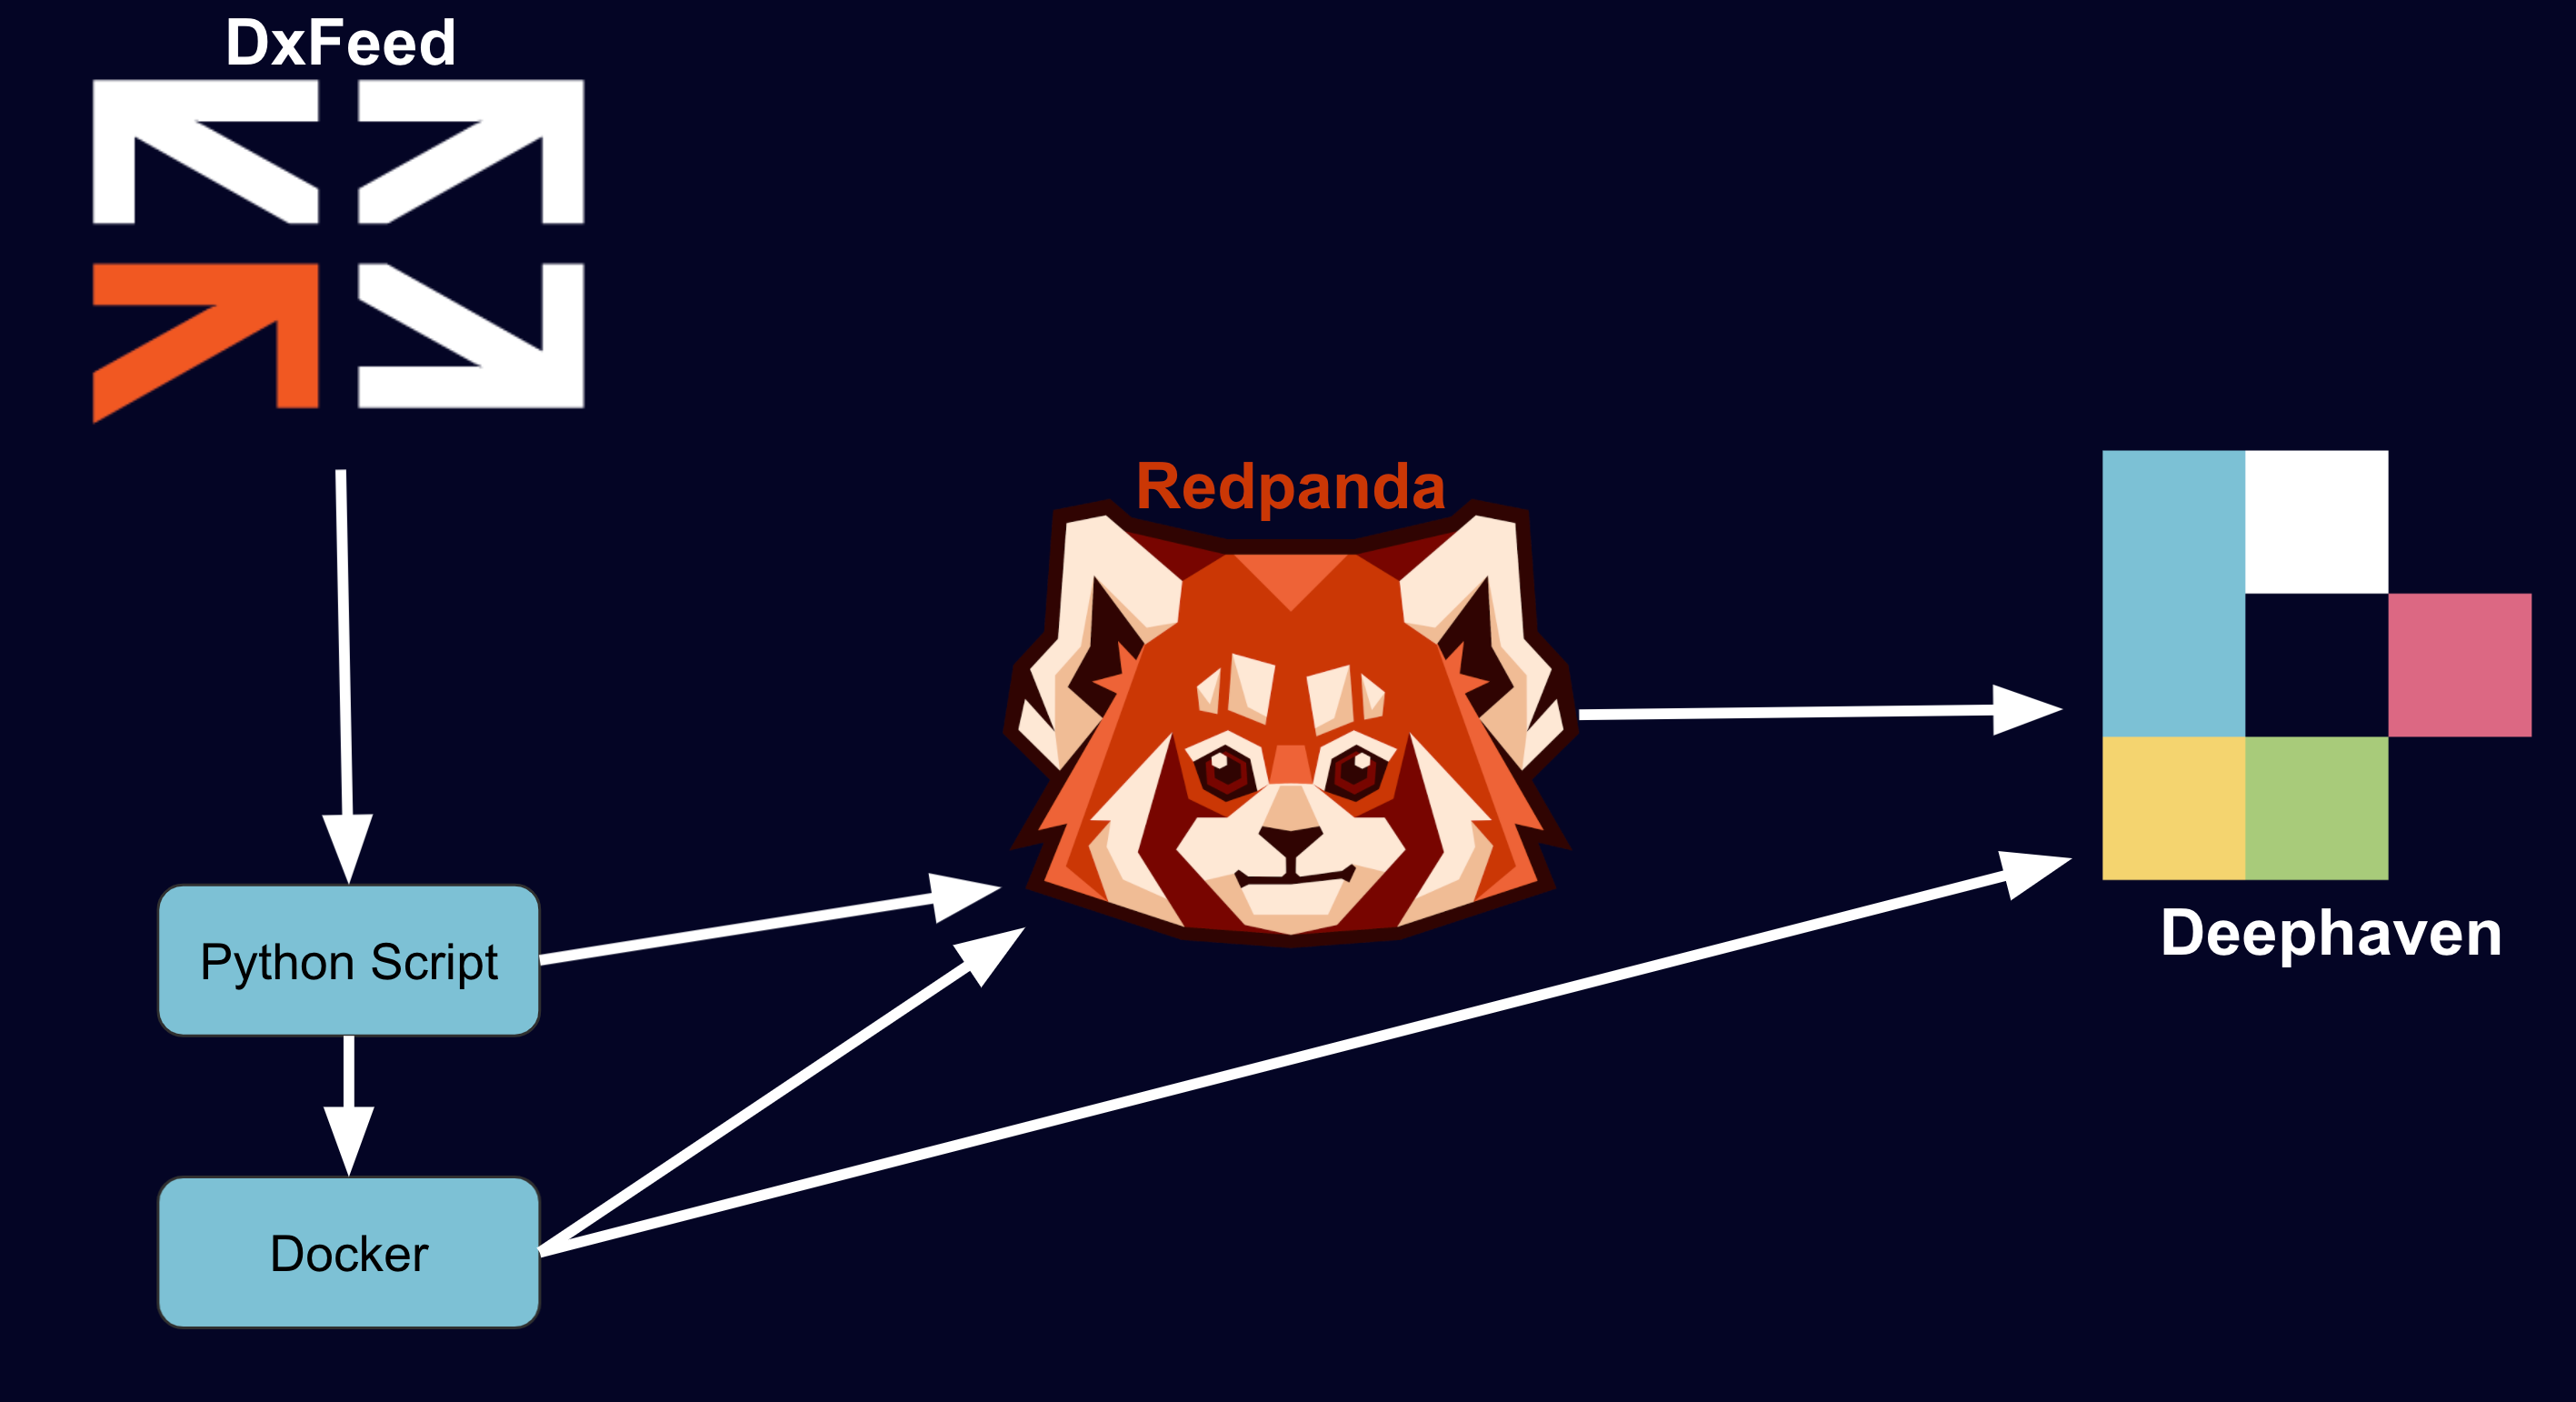
Navigate to http://localhost:10000/ide to see the default layout.
After launching, you should see stock market data streaming into your tables:
Note
Some tables only work during trading hours, because the before/after-hours events lack real timestamps. This data is demo data - it is provided here for demonstrative use without any warranty as to the accuracy, reliability, or completeness of the data.
query.py will show in the IDE. To run that query, click the Play All button (the double triangle).
Work with data
We'll guide you through what each layout element does.
We start with aggregating the data to make a new table that compares the AskPrice with the BidPrice as grouped by Symbol.
Deephaven provides a series of powerful joins to perform on real-time streams. This one uses as-of join to correlate trade events with the most recent bid for the same symbol.
There are many built-in functions to analyze the data, such as Exponential Moving Averages (EMA). Below we create three different EMAs based on different times and ticks for each Symbol.
As you work with your data, enter a Symbol into the InputFilter and notice how all the tables change to just that Symbol.
To visualize data, we can also plot in a variety of ways. Below are just a few options.
Endless possibilities
We hope the working example above emulates real-time data driven problem sets you have. We encourage you to adapt and evolve the query to deliver the ML, business logic, or analysis that interests you in regard to stock data. The Deephaven dev-rel team is anxious to support you, and we encourage you to review our full user documentation.
The pattern of this application can be followed for use cases well beyond data sourced from dxFeed or related to the capital markets. IOT, weather, crypto, blockchain, sports, and industrial telemetry all offer interesting (and challenging) use cases at the intersection of real-time and historical data. The future of data is streaming. Get excited.
Please let us know how Deephaven can be helpful by reaching out on Gitter or posting in our Github Discussions.