My co-workers and I recently read a great blog post by Alain Saamego that shows an easy, accessible way to get stock data from Yahoo Finance with only three lines of Python code. We'd like to build on that tutorial by accessing current market data - that is, market data with less than a 1-second lag. As a bonus, we add plots into the mix.
The ability to visualize data is probably one of the most important aspects leading to understanding. Effective plots can unlock the insight needed to make informed decisions, and combined with real-time data, you have an even more powerful tool at your fingertips.
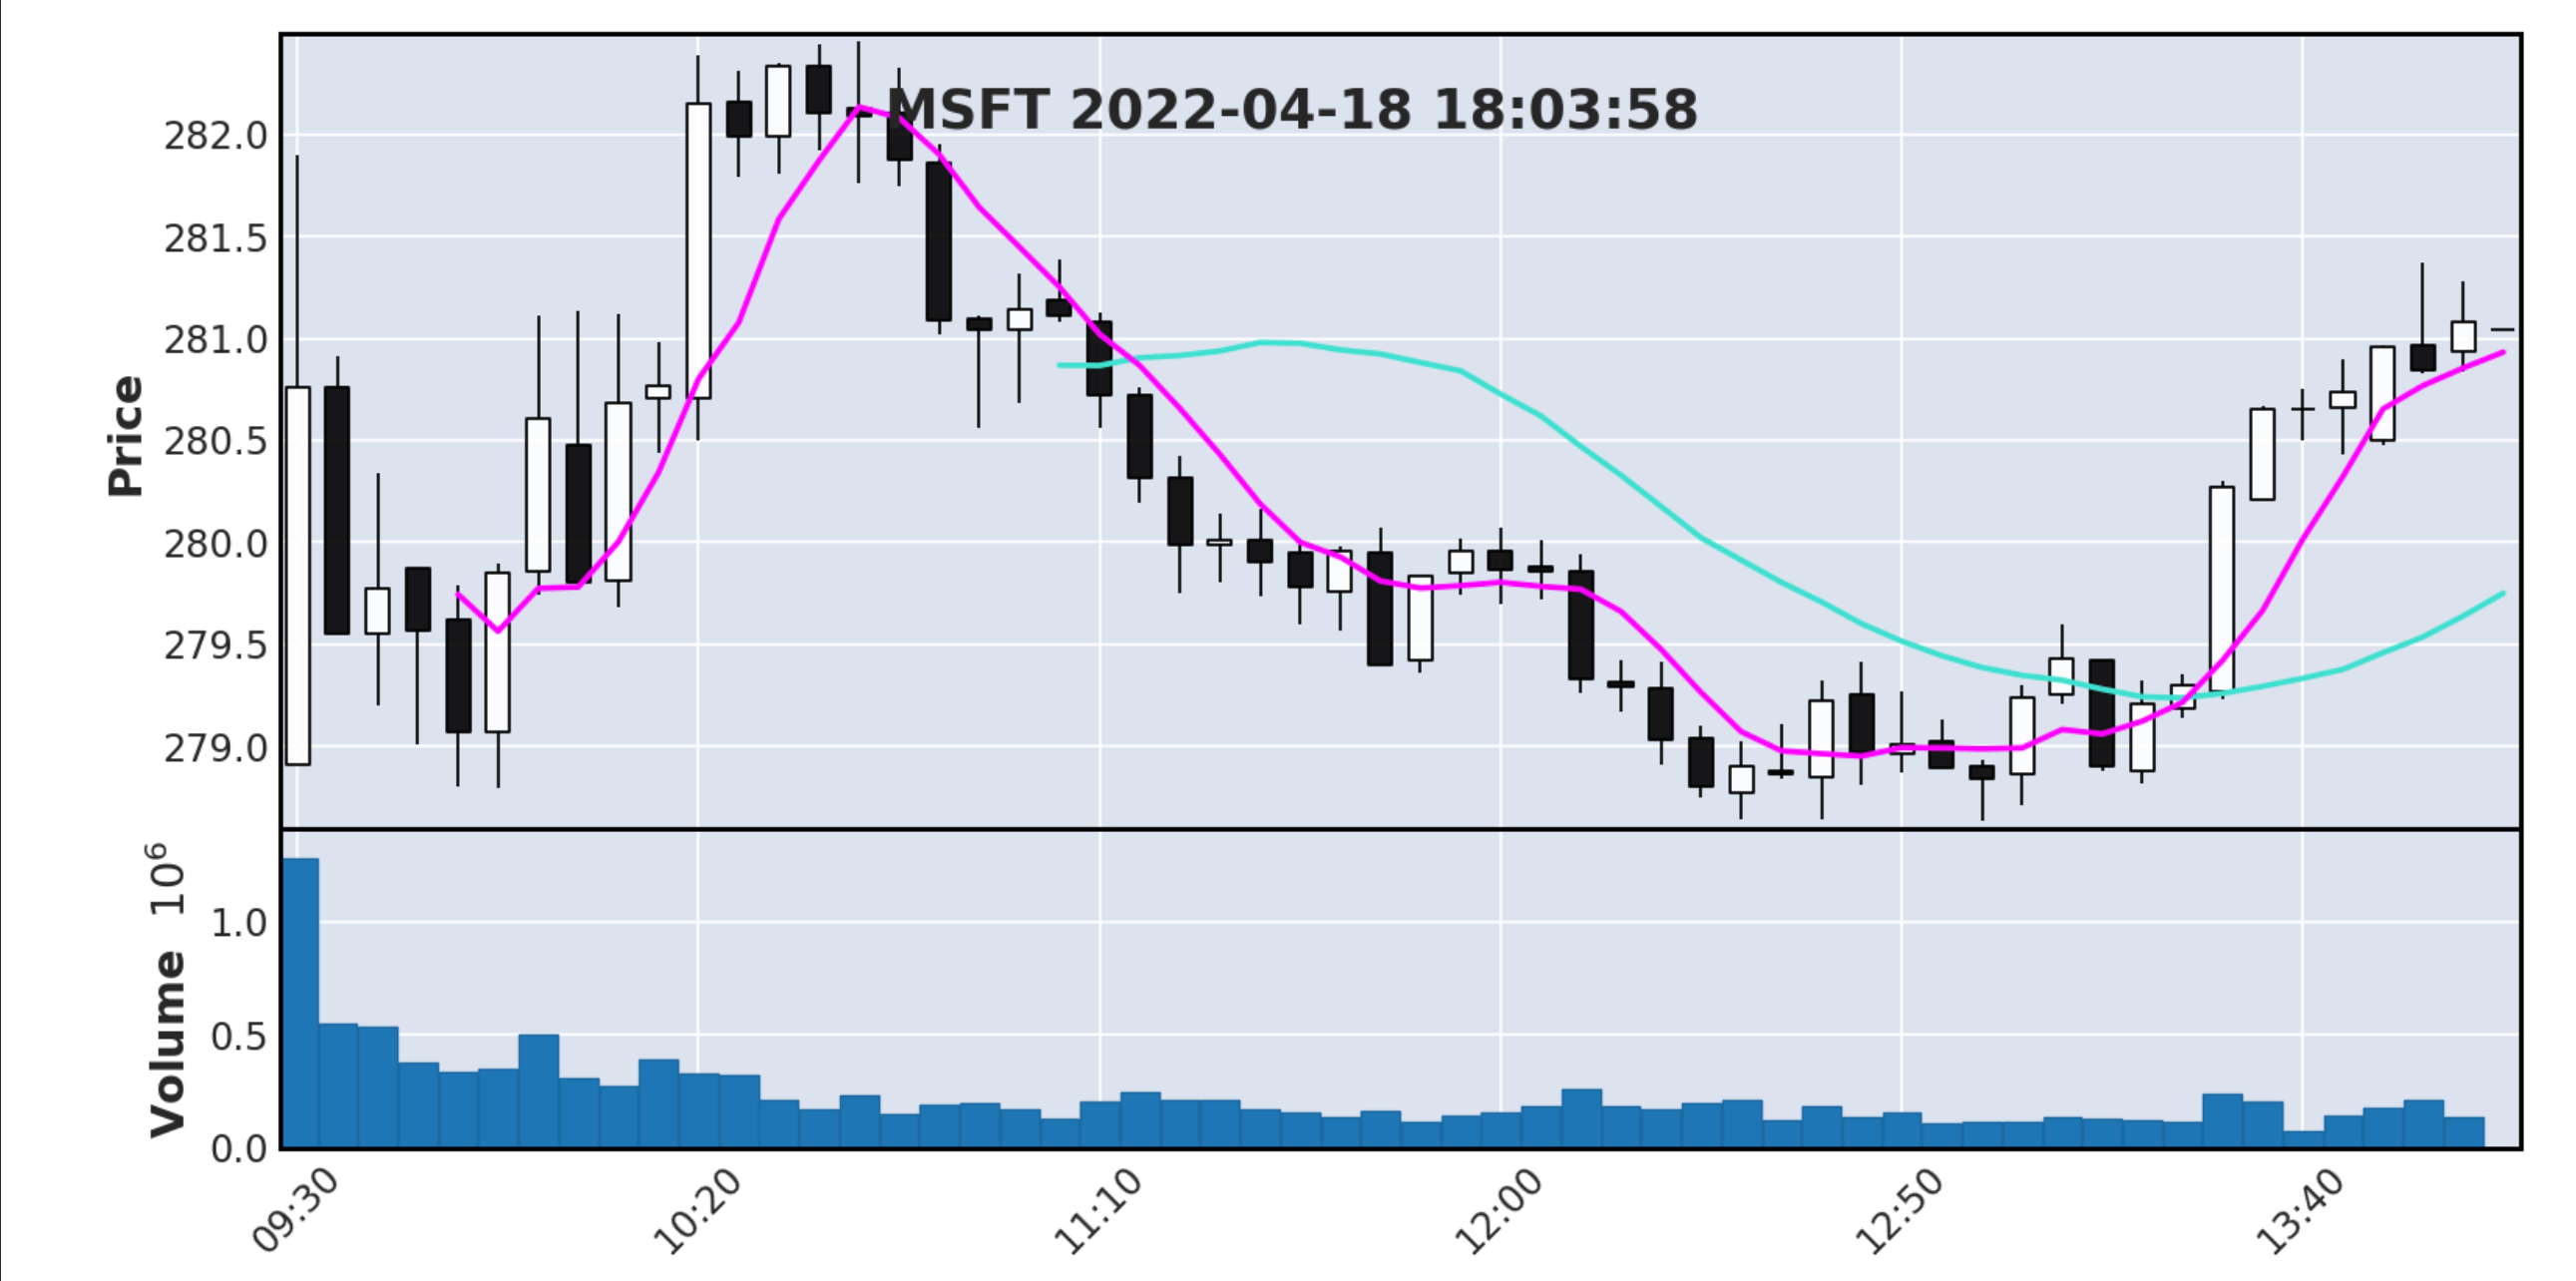
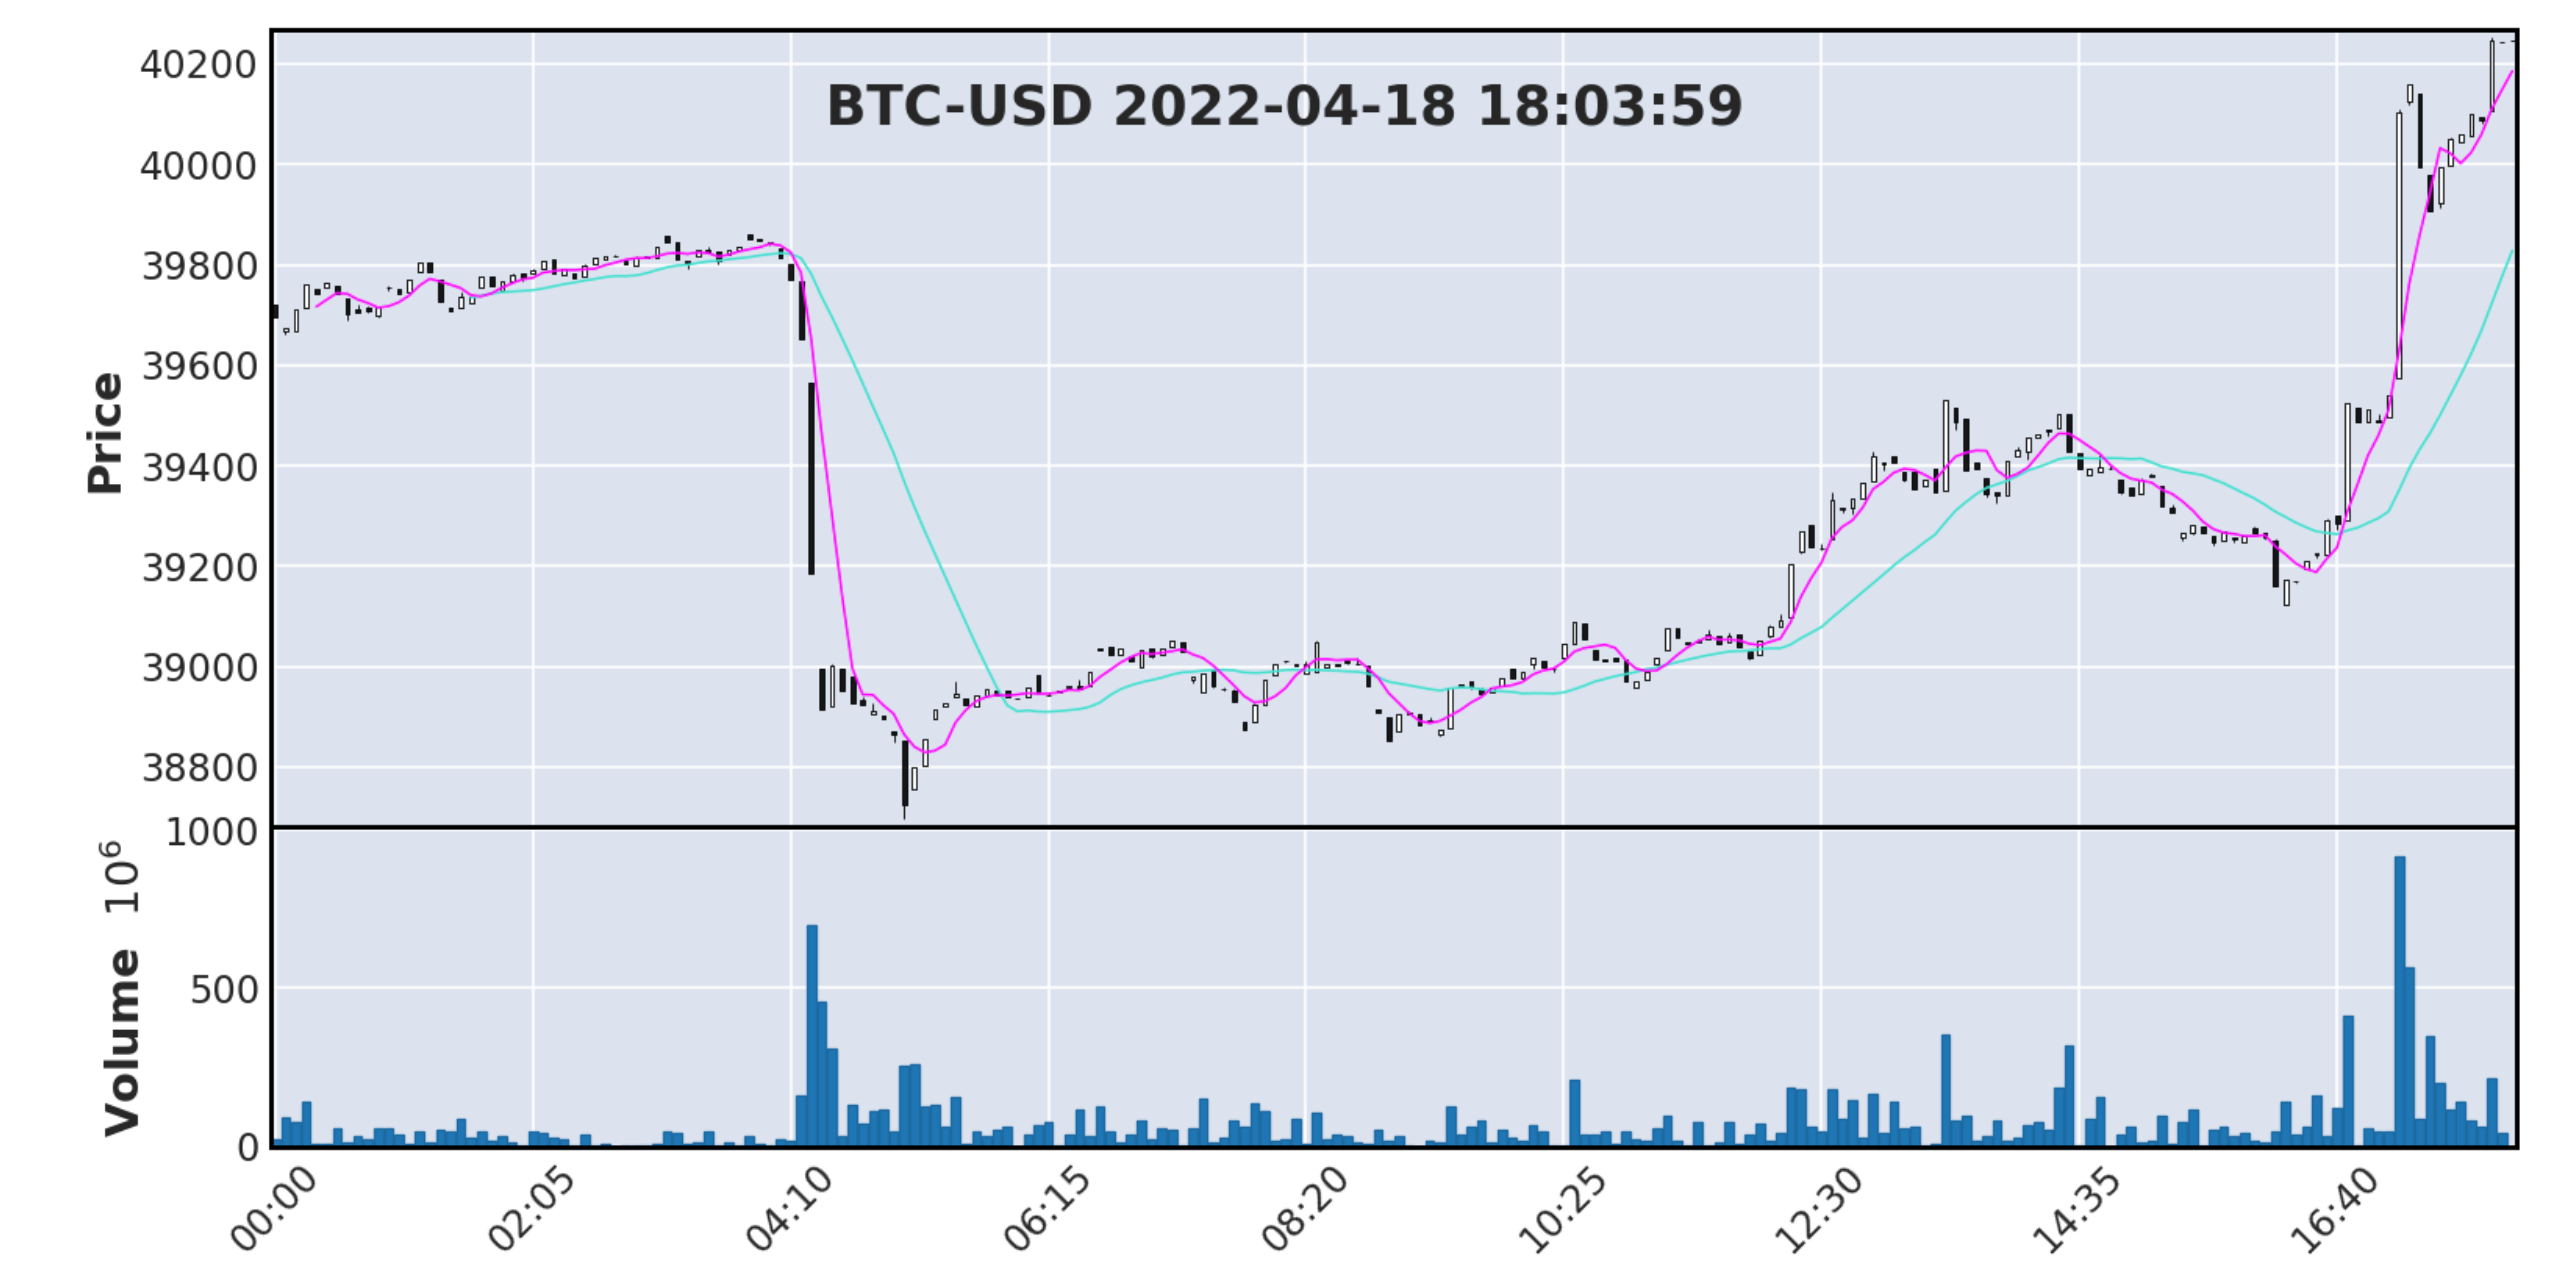
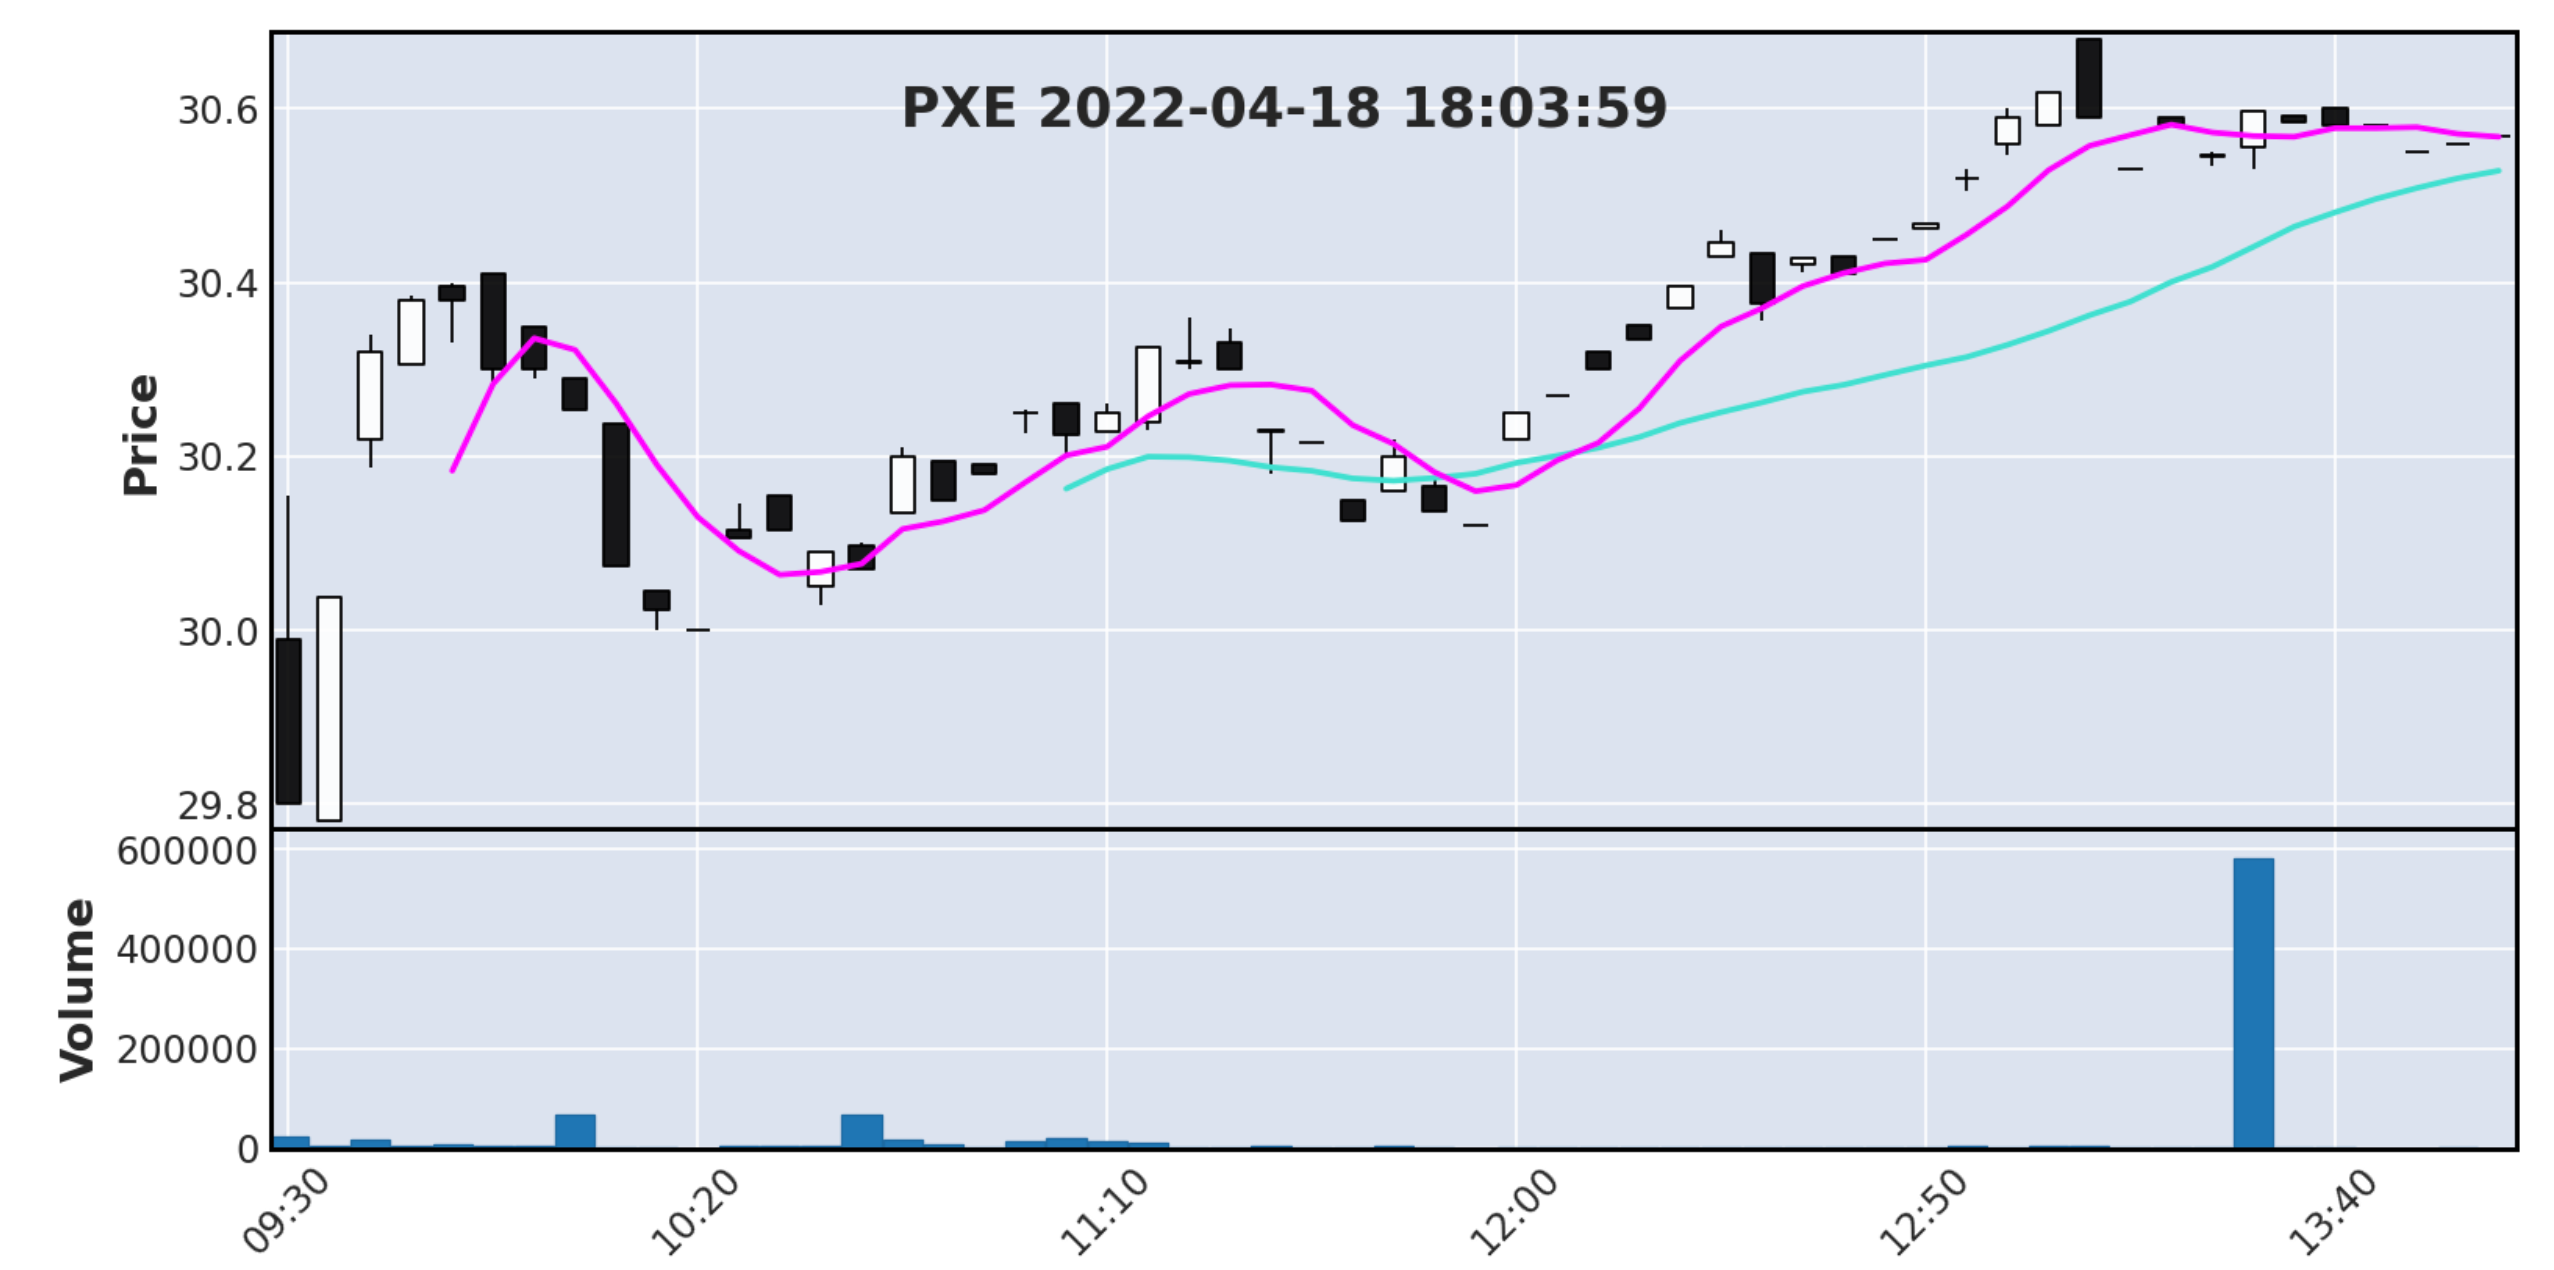
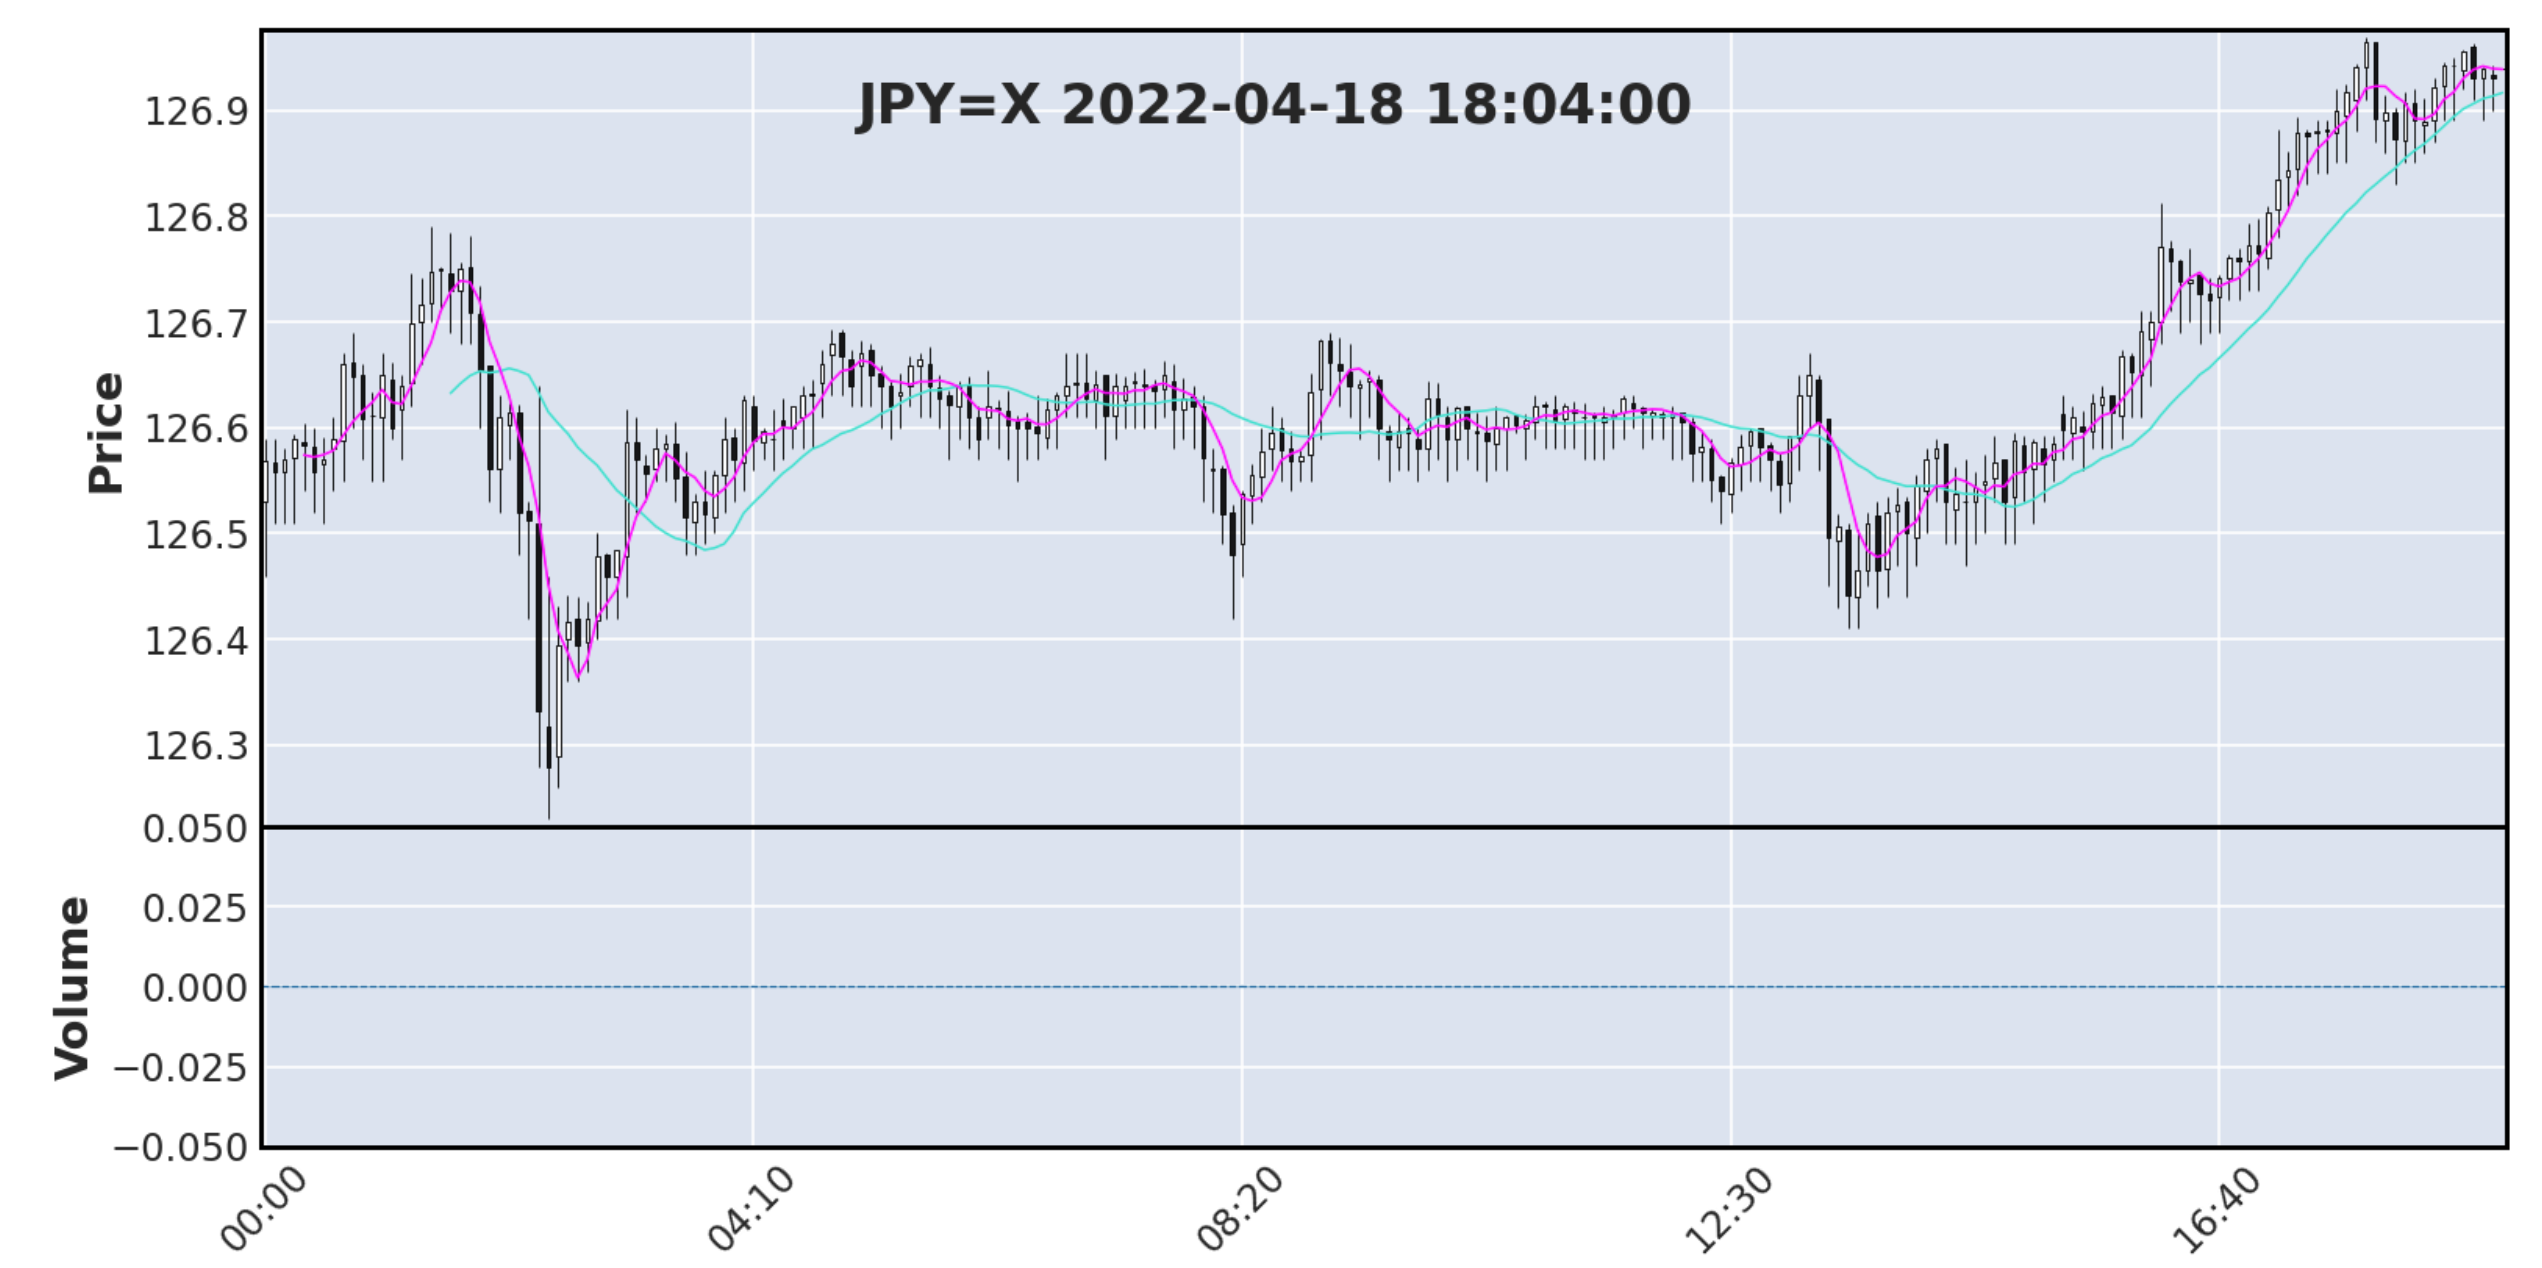
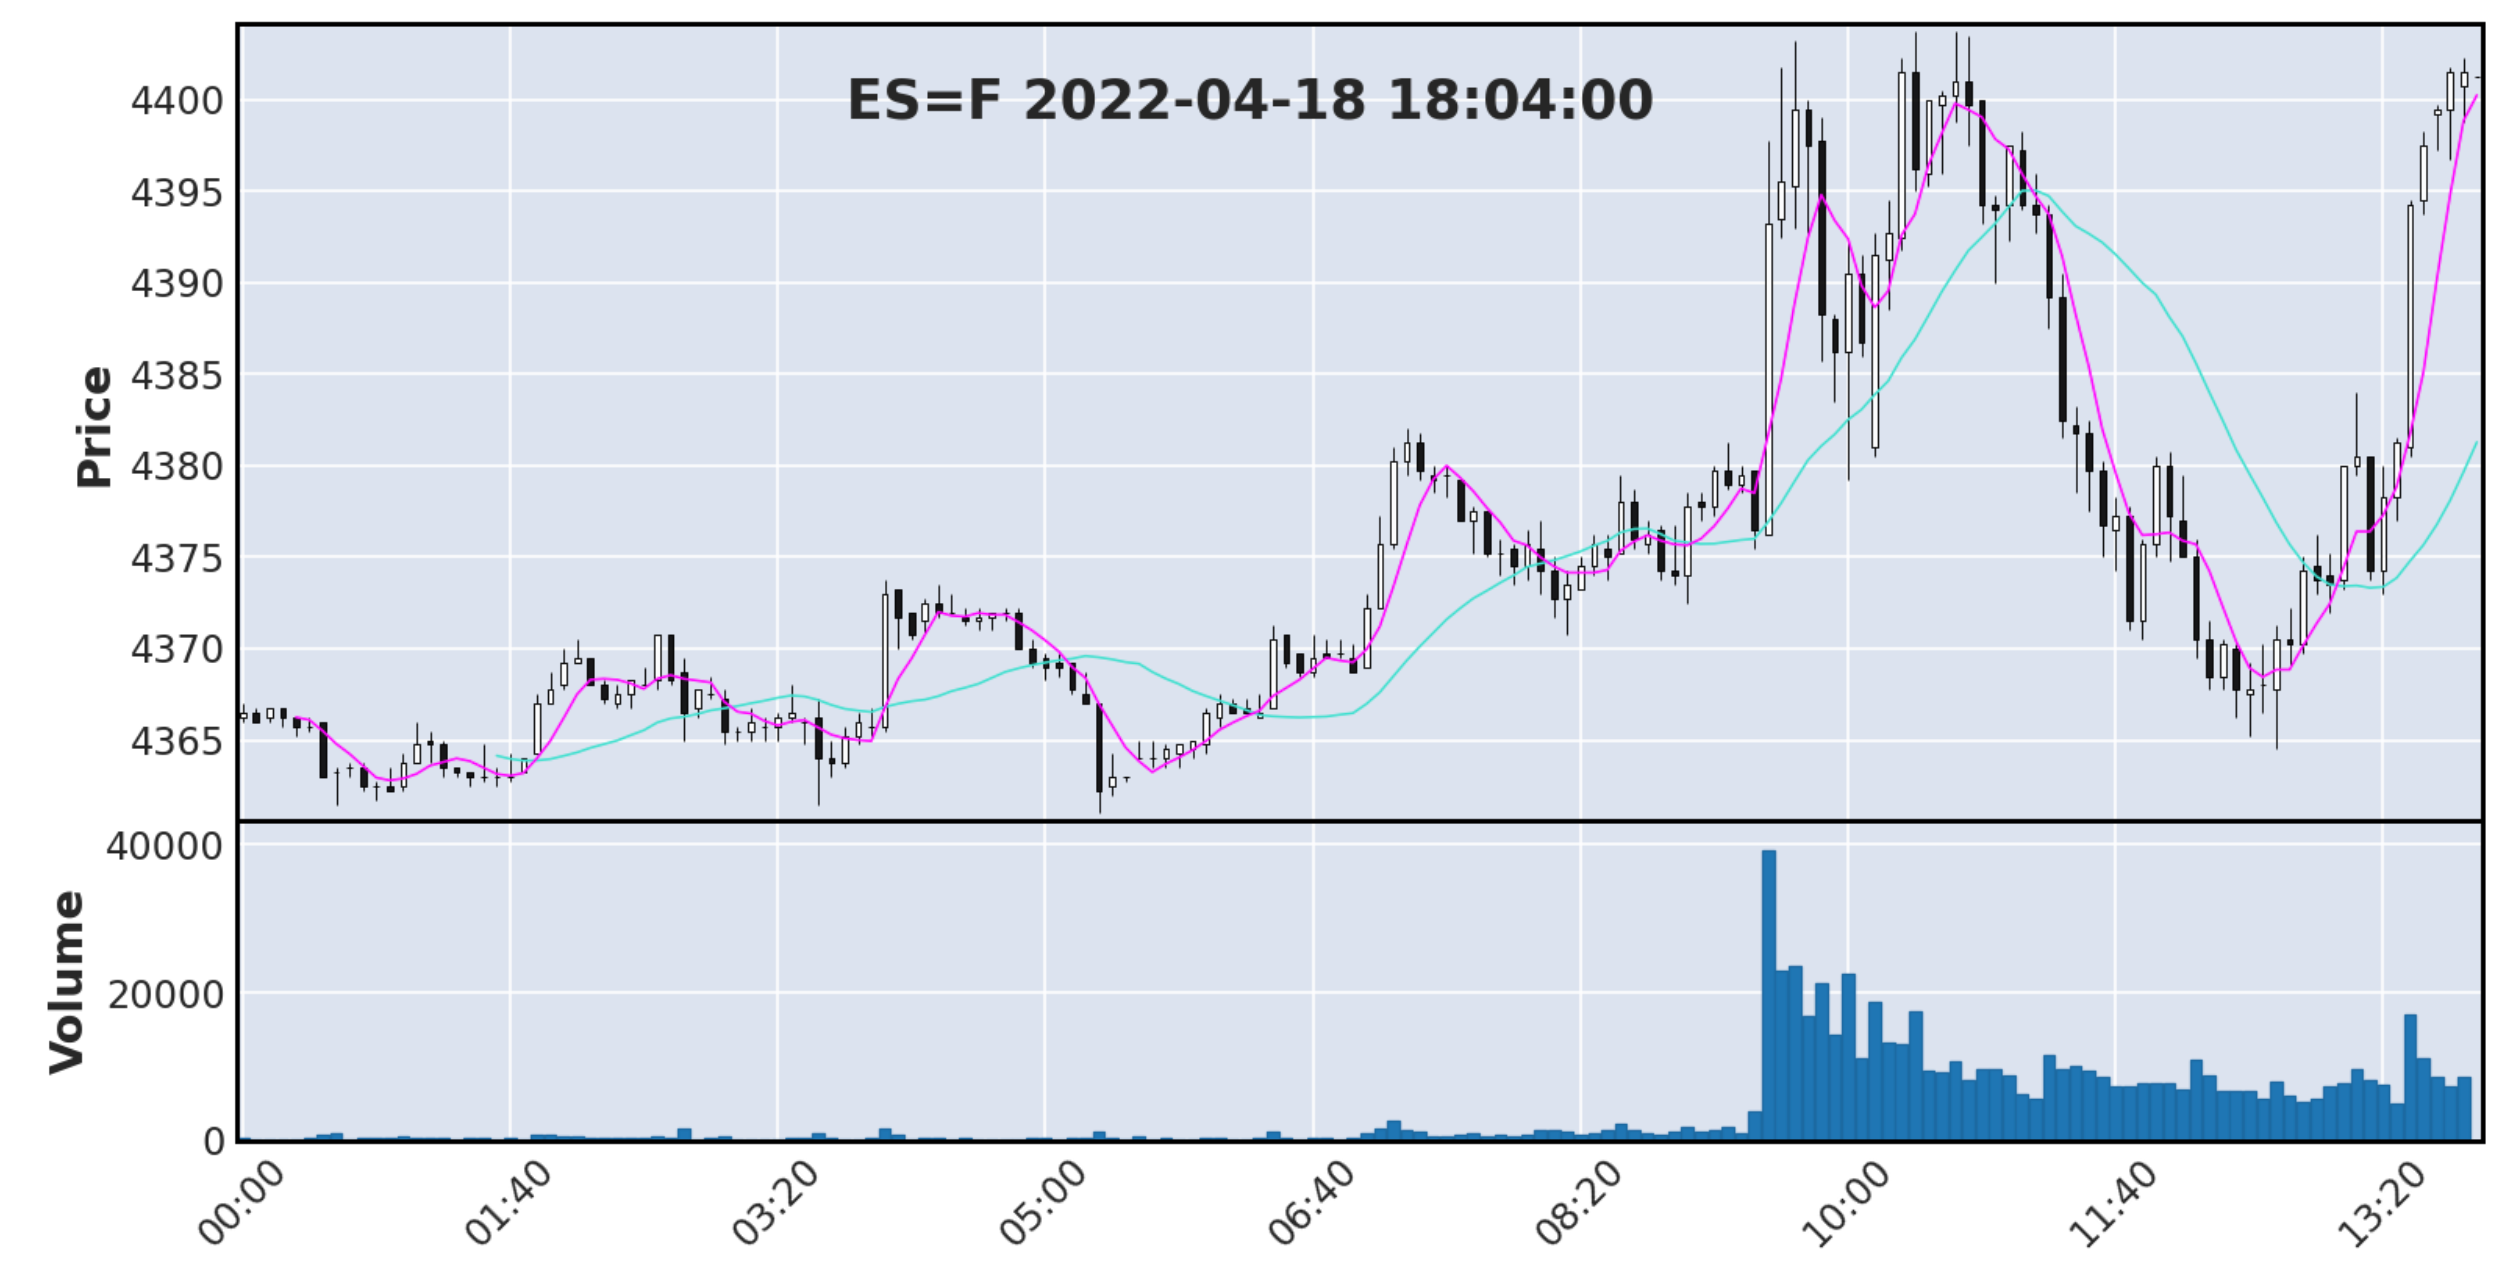
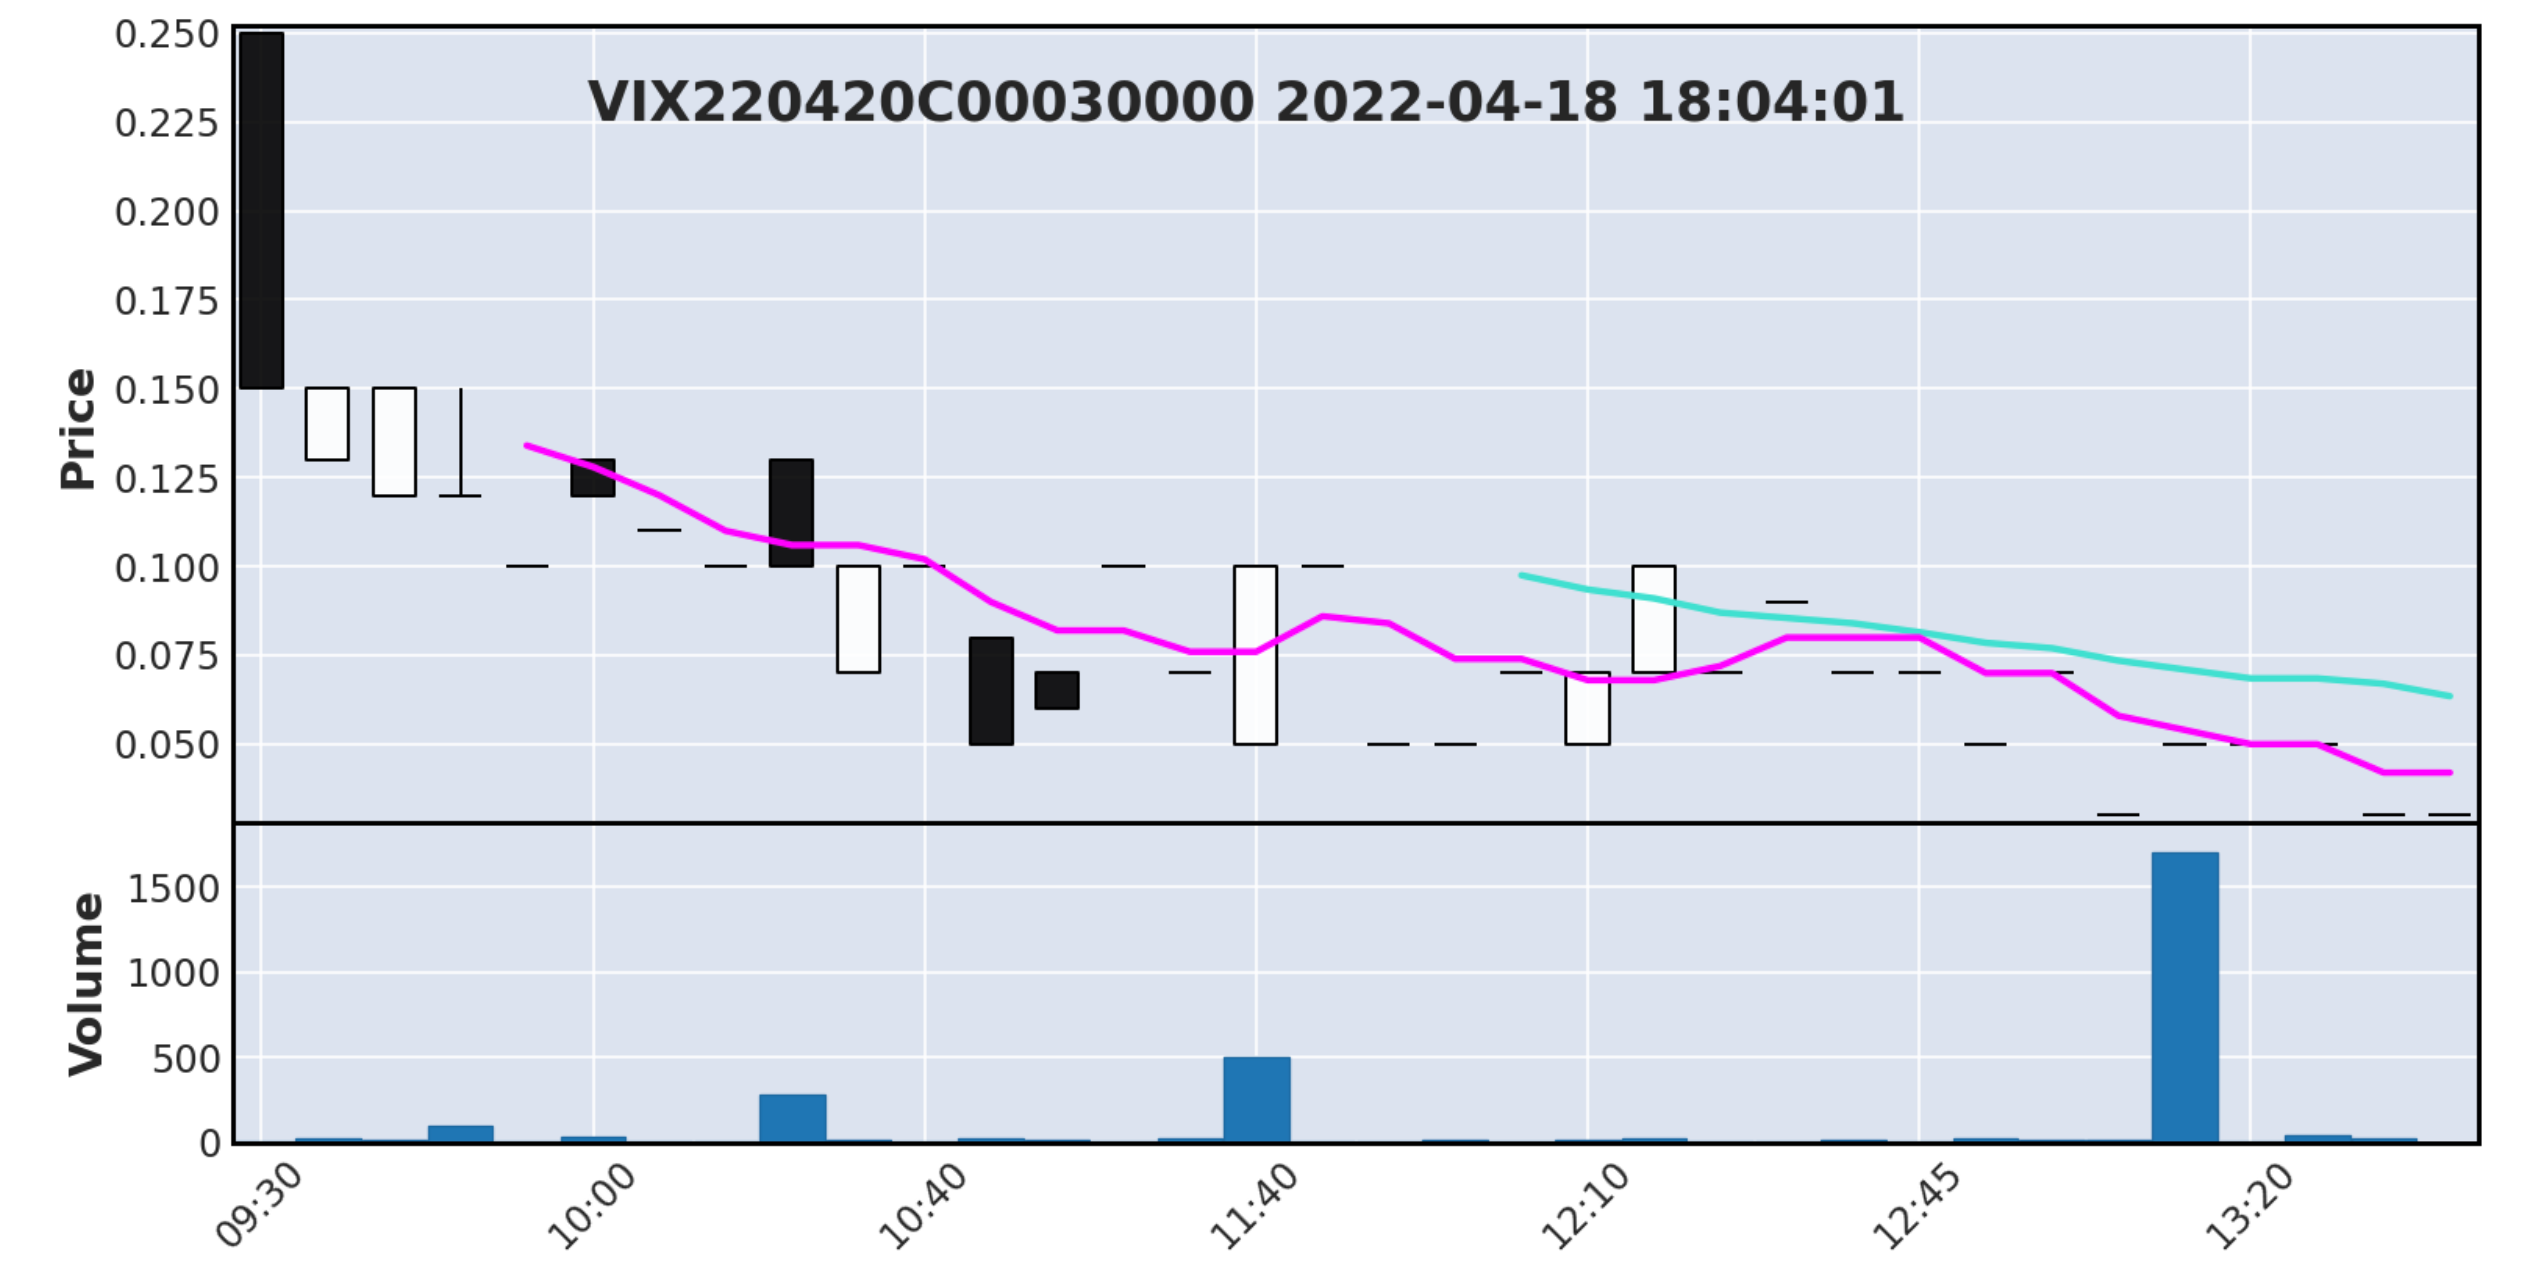
This post shows you how to see powerful plots from Yahoo Finance using Matplotlib. This code is designed to work in any python3 instance by changing three lines of code: update the period of the plot, the interval, and the symbol. You can look up what tickers are available on Yahoo Finance.
The code
This example starts with traditional stock (MSFT), a cryptocurrency (BTC-USD), an ETF (PXE), a currency (JPY=X), a future (ES=F), and an option (VIX220420C00030000) to show the wide array of financial information you can pull from this API.
 |  |
|---|---|
 |  |
 |  |
Deephaven is a powerful query engine that excels at handling real-time data. Many of our customers are experienced traders, but the Deephaven Query Language and UI make handling this kind of data accessible to anyone. Although Deephaven has built-in plotting methods, you can install Matplotlib into the Deephaven IDE to elevate your plots. Use our guide, How to use Matplotlib in Deephaven, to get started with the simple code above.
Talk to us
Tell us how you tuned the code on Slack!
y!finance is distributed under the Apache Software License. See the LICENSE file in the release for details.

