Hi, I'm Josh, one of Deephaven's newest interns. I'm a computer science major and looking forward to learning about data science in the real world while also expanding my software abilities. Although I'd heard great things about Deephaven's query engine, I had never used it before. As a part of my job, I was expected to learn it from scratch within a week. Learning any new software can be intimidating, especially when its tutorials lack the information you need. To my surprise, it only took two days to get comfortable enough with the IDE and the Deephaven Query Language to start my first project.
In the end, I was able to create an application that took Colorado graduation data and analyzed it better than their government's current solution in only a few minutes.

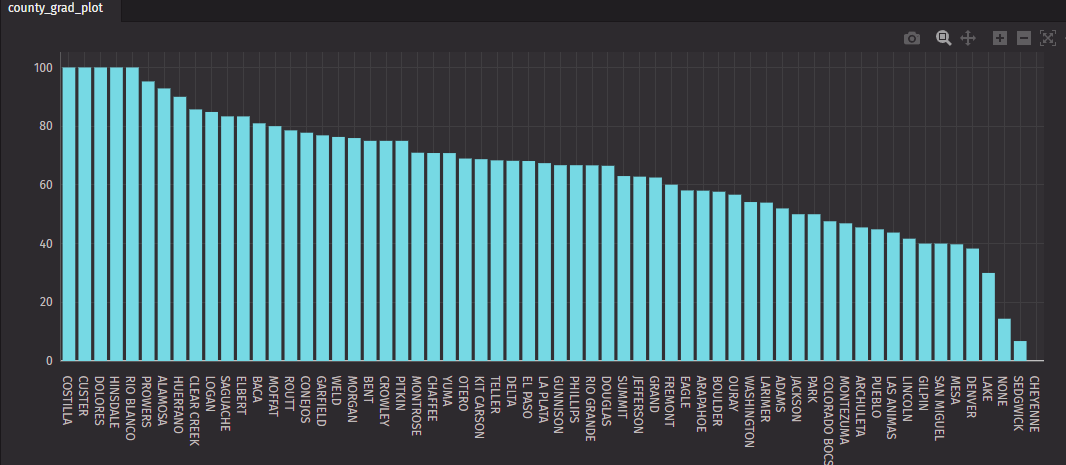
Looking at what I made, trends became more obvious and questions were raised. Like, why did Cheyenne county and Sedgwick county have such low graduation rates for students with disabilities? Honestly, I only chose to look at this data since it was easily available. While the analysis wasn't my primary goal, I was intrigued by the results and knew that if I did want to do further analysis, I could do so in a few minutes.
This is only the first step on my journey to working with real-time data, which is Deephaven's superpower. Now that I understand the basics, I plan to begin working with real-time data applications and put my newfound skills to good use. Since Deephaven is data agnostic, I can use the same set of table operations, regardless of whether my data is static or dynamic.
From 0 to 1 in under an hour
Obviously, my first task was to install and launch Deephaven. I followed the steps in the Quick Start guide, which walked me through the simple command line steps to get the IDE up and running.
Setup took a matter of minutes, so I moved on to the Deephaven Community Tutorial quickly. This gave me a basic understanding of the general structure and syntax of the code. Next, I explored the wide variety of how-to guides and examples. After two days, I felt confident enough to start working on a project. I discuss the steps below - the process of finding the data, importing it into Deephaven, removing irrelevant data to create easy-to-read tables, and creating a plot took me less than 1 hour.
Practicing with static data on my way to real-time
I needed some readily accessible data. I found the Colorado government information marketplace website containing high school graduation data from the 2011-2012 school year for many types of students. The website had a built-in tool that had some ability to visualize the data. However, it was very hard to navigate and could not support analyzing the data beyond creating graphs. This provided an opportunity to both practice my skills with Deephaven as well as create something that could better visualize and analyze the data.
To do this, I first got a link to the data and read it into Deephaven, which surprisingly only took two lines of code.
I realized the CSV had much more data than I needed. Following the How to use filters guide, I removed irrelevant columns, adjusted column names, and included only information about students with disabilities. I made a new, easier to read table:
Next, I decided to aggregate the data so that I could better understand any trends in graduation among different Colorado counties. Using the guide on performing multiple aggregations, I simply copied and pasted the example into my code and then changed a few values to fit my needs. Voila:
This table was informative, but a plot would provide a better visual. All I had to do was copy the code from the how-to guide into my program and change a few values. Finally, I had a chart that visually displayed graduation data by county.
My honest opinion
Starting with no prior experience with Deephaven, I completed this project, start to finish, in under an hour. Deephaven made good on its claims of being intuitive and easy to use regardless of whether you have been coding for years or have no prior experience. Deephaven provides abundant options for analysis. The chart I created looked better and provided more information than anything the government website could produce. I'm ready to create more sophisticated projects using dynamic data sources.
Want to learn Deephaven yourself? Be sure to check out their examples or reach out to them on Slack to learn more!

