Understanding upsets: Win probability and efficiency metrics in real time
Part 3 of the March Madness series: Know why the chaos is happening, not just that it's happening
March 13 2026


Not all upsets are created equal.
Vermont leading Duke by 6 with 8 minutes left looks the same on any scoreboard. But one version has Vermont shooting 60% from three on contested jumpers — luck that's about to regress. The other has Vermont controlling tempo at 80 possessions per 40 minutes, forcing turnovers, and posting 1.2 points per possession against Duke's defense. That's not luck. That's a strategy working exactly as designed.
The difference between those two scenarios is the difference between "interesting" and "your bracket is cooked." And you can see it in real time — if you know where to look.
The score tells you what's happened. Efficiency tells you why.
This post adds a contextual layer to the command center we built in Part 2: win probability, pace of play, and efficiency metrics. When you're done, your dashboard won't just flag upsets: it'll tell you which ones are flukes and which ones are likely to hold.
Catch up on the series:
- Part 1: Data-driven bracket picks — historical analysis and value picks before tip-off.
- Part 2: Real-time March Madness analytics — build the live command center.
Tip
New to Deephaven? Try the live demo or get started with Community Core — it's free and takes about 5 minutes.
The building blocks
We'll extend the real-time scoreboard from Part 2, adding three key metrics:
- Win probability — Based on score differential and time remaining.
- Pace — Possessions per 40 minutes. Fast pace = more variance = more upset potential.
- Efficiency — Points per possession. The best single predictor of team quality.
The query patterns here follow Deephaven's streaming philosophy: use update to add derived columns, last_by to get current state per game, and merge to combine multiple game streams. Each operation stays reactive — when new data arrives, downstream calculations update automatically.
Let's start with the same simulated games, but add play-by-play detail:
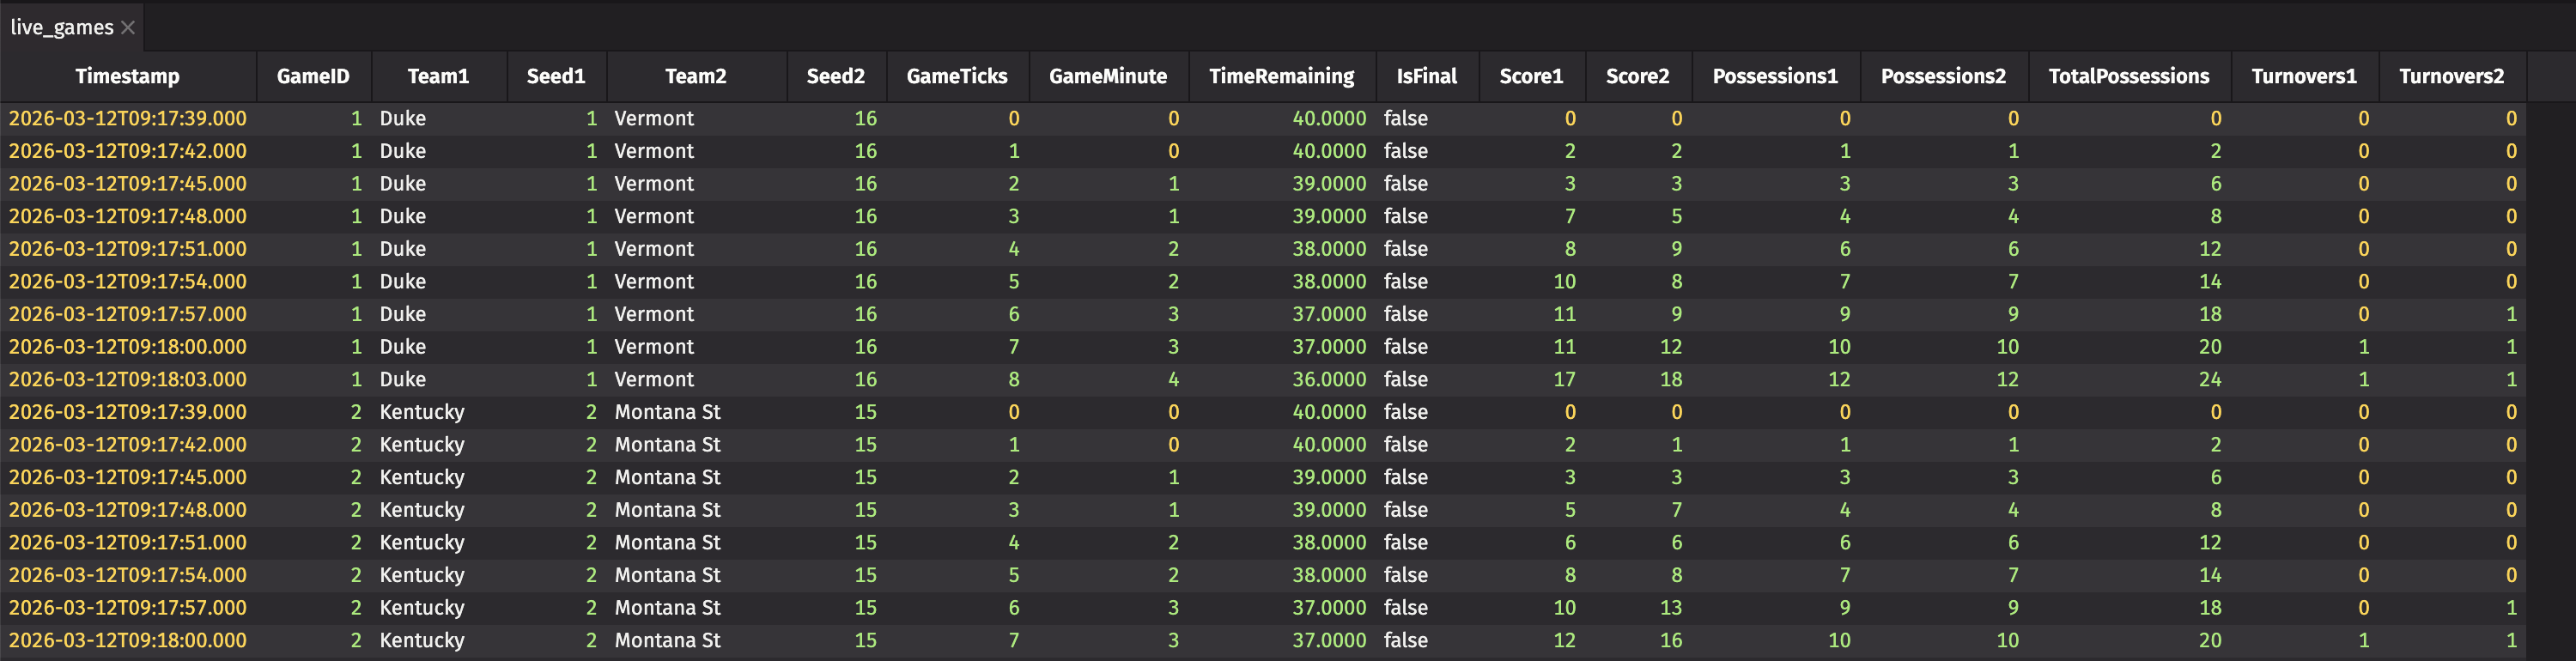
Now we have possession counts and turnovers alongside scores — the raw ingredients for efficiency metrics.
Win probability: Should you actually panic?
Win probability models estimate the chance each team wins based on the current game state. A simple but effective model uses two factors:
- Score margin — Being up 10 is better than being up 2.
- Time remaining — Being up 10 with 2 minutes left is much better than with 20 minutes left.
Here's a simplified model based on historical NCAA tournament data:
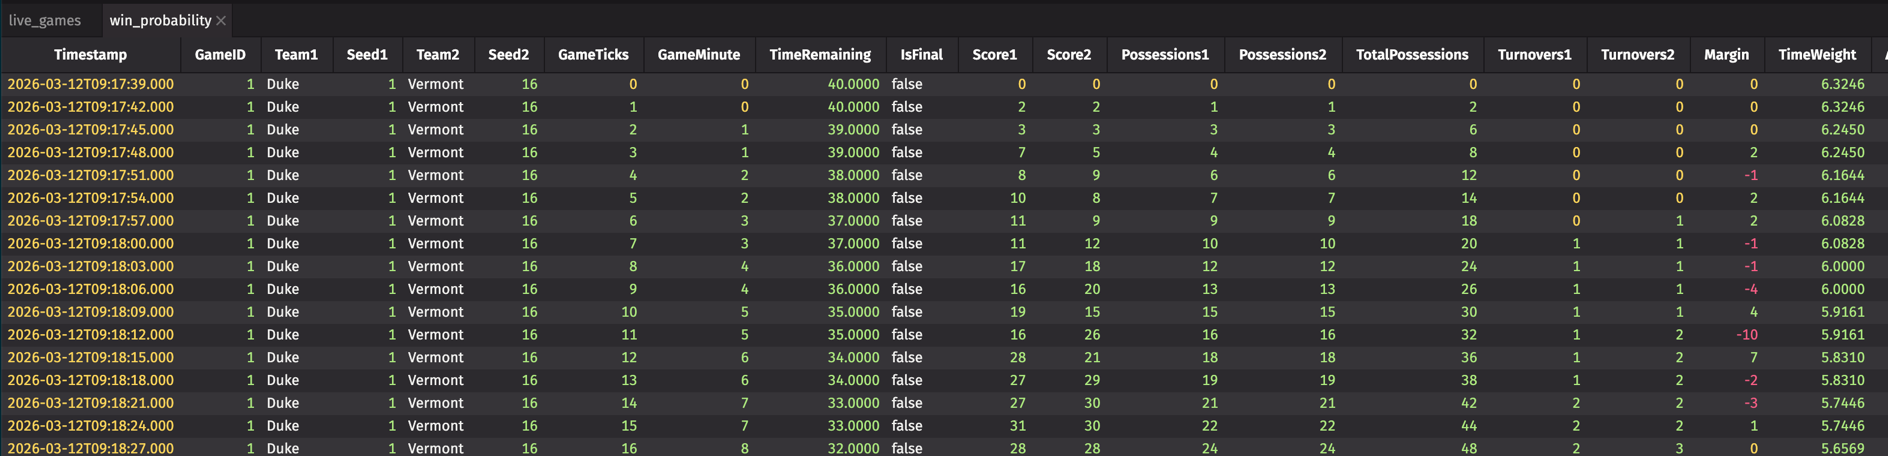
Now you can see the difference between "Vermont up 6 with 30 minutes left" (maybe 55% win probability) versus "Vermont up 6 with 3 minutes left" (maybe 85%). The first is interesting. The second is a crisis for your bracket.
Pace of play: Why tempo matters
Fast-paced games have more possessions, which means more variance. A 16-seed's best chance against a 1-seed? Push the pace, create chaos, and hope variance works in their favor.
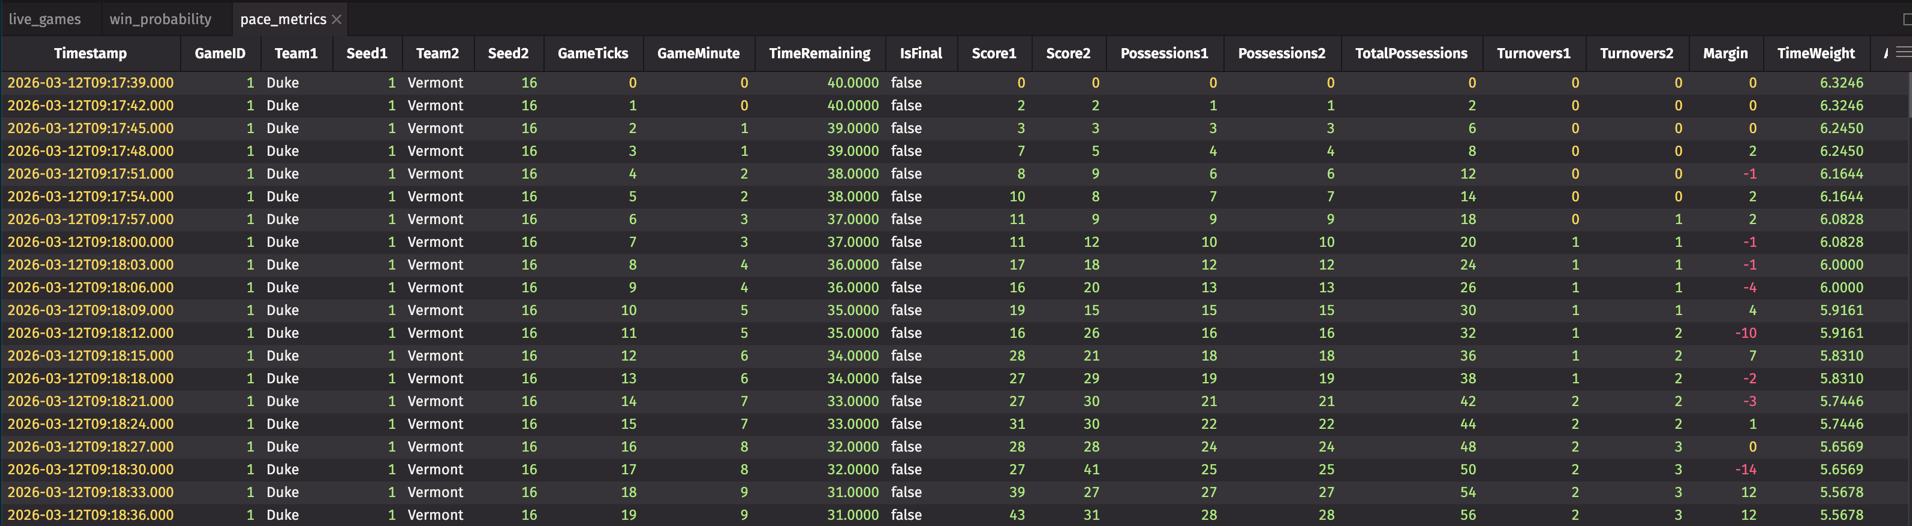
When you see a 15-seed keeping pace high against a 2-seed, that's intentional. They're maximizing possessions, hoping for hot shooting and favorable bounces. Slow, grinding games favor the better team.
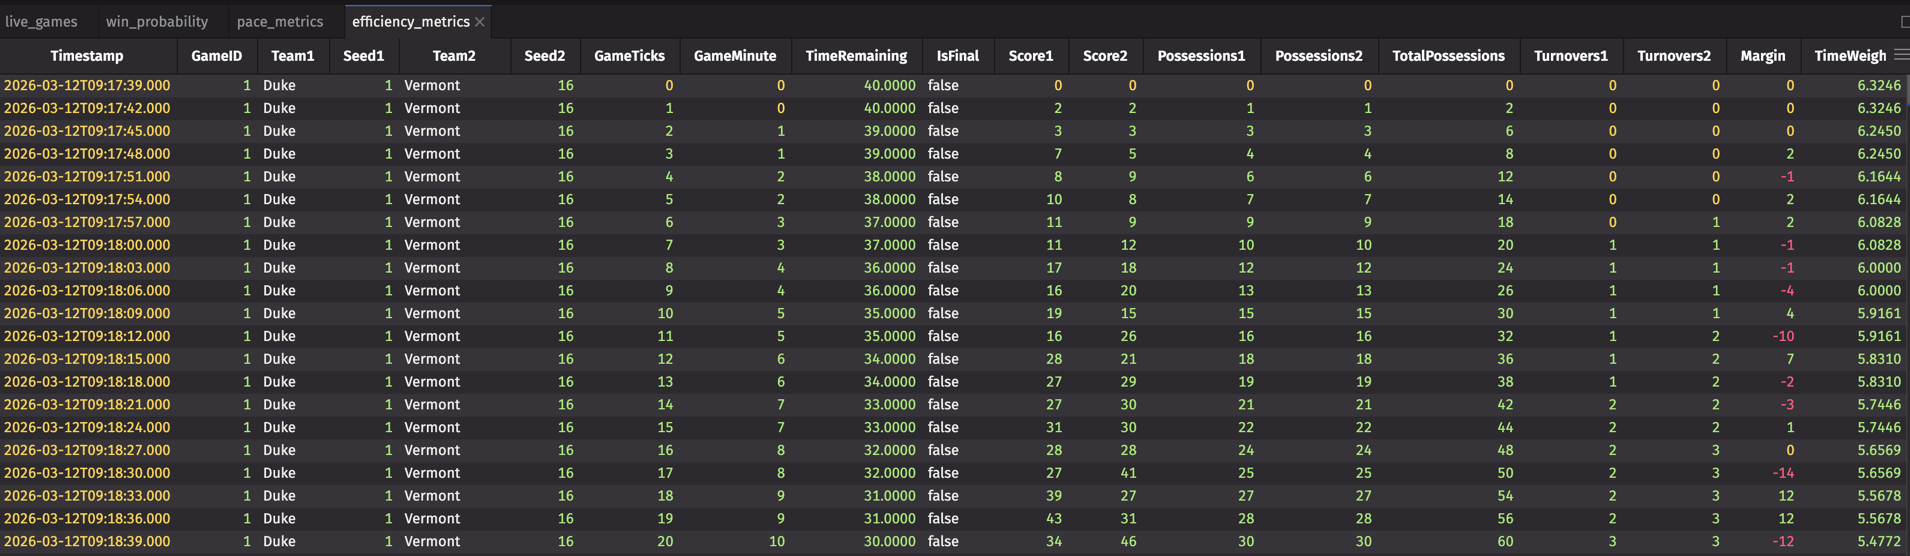
Offensive and defensive efficiency
The single best predictor of team quality is points per possession. Not points per game — that's confounded by pace. A team scoring 80 points on 60 possessions (1.33 PPP) is better than one scoring 85 on 70 possessions (1.21 PPP).
Tip
What's a good PPP? In college basketball, 1.0 points per possession is roughly average. Elite offenses hit 1.15+. If a 12-seed is posting 1.2 PPP against a 5-seed's defense, that's not luck — that's a schematic advantage.
Understanding the upset: putting it together
Now we can explain why an upset is happening, not just that it's happening:
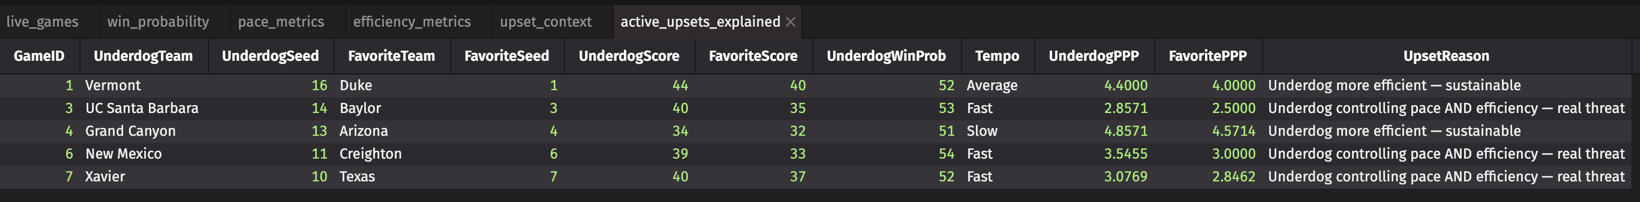
Now when Vermont leads Duke, you'll see:
| UnderdogTeam | UnderdogWinProb | Tempo | UnderdogPPP | UpsetReason |
|---|---|---|---|---|
| Vermont | 62% | Fast | 1.15 | Underdog controlling pace AND efficiency — real threat |
That's actionable insight. Vermont isn't just winning — they're winning the right way. Time to update your mental model of this game.
When efficiency and pace both favor the underdog, believe the upset.
Enhanced command center
Let's add an efficiency panel to our dashboard:
Now your command center doesn't just tell you Vermont is winning; it tells you Vermont is shooting 1.15 PPP against Duke's defense and has a 62% win probability with 8 minutes left.
What these metrics reveal
Here's how to interpret the data:
| Scenario | What it means |
|---|---|
| High PPP + Fast pace for underdog | Real threat — they're outplaying, not outlucking |
| Low PPP + Fast pace for underdog | Variance play — could swing back quickly |
| High PPP + Slow pace for favorite | Favorite grinding it out — upset unlikely |
| Close efficiency + Clutch time | Anyone's game — watch every possession |
Limitations and next steps
This model is simplified. Production win probability models include:
- Pre-game team strength — A 16-seed up 6 isn't the same as an 8-seed up 6.
- Possession indicator — Who has the ball matters in close games.
- Foul situation — Being in the bonus changes late-game dynamics.
- Home court — Not a factor in neutral-site tournaments, but matters for other sports.
You could extend this by:
- Pulling live odds from betting APIs (they've already done the math).
- Training a model on historical play-by-play data.
- Adding player-level data (is their best player in foul trouble?).
The complete picture
Across this series, we've built a complete March Madness analytics stack:
- Part 1: Pre-tournament analysis — identify value picks using historical data.
- Part 2: Real-time tracking — monitor scores, detect upsets, track bracket damage.
- Part 3: Contextual understanding — know why upsets are happening with efficiency metrics.
You're not just watching the tournament anymore. You're understanding it — in real time, with data, the moment it happens.
Ready to build your own analytics stack? Get started with Deephaven Community Core — free, open source, and built for real-time data.
Questions? Find us on Slack.