Create a Dashboard with deephaven.ui
This guide shows you how to build a dashboard with deephaven.ui, Deephaven’s Python library to create user interfaces. You’ll use a wide range of components supported by the library to familiarize you with what deephaven.ui provides and dive deep into simulated data with live dataframes, visualizations, and interactivity seamlessly integrated into a dashboard.
- First, you’ll learn the basic
deephaven.uicomponents. Basic components use panels, which are individual and adjustable windows within Deephaven. Tables, charts, and other components are rendered in panels. - After creating panels, you’ll create a dashboard. A dashboard is a collection of panels that open in a separate window within Deephaven.
- Then, you’ll create a custom panel component. Custom components enable rich interactivity within your panels and dashboards.
- Finally, you’ll embed your custom component into your dashboard.
 To follow along, you need the
 deephaven.ui package and simulated data and charts from deephaven.plot.express. Both of these packages are included in the default setup.
Import the simulated iris data with this script:
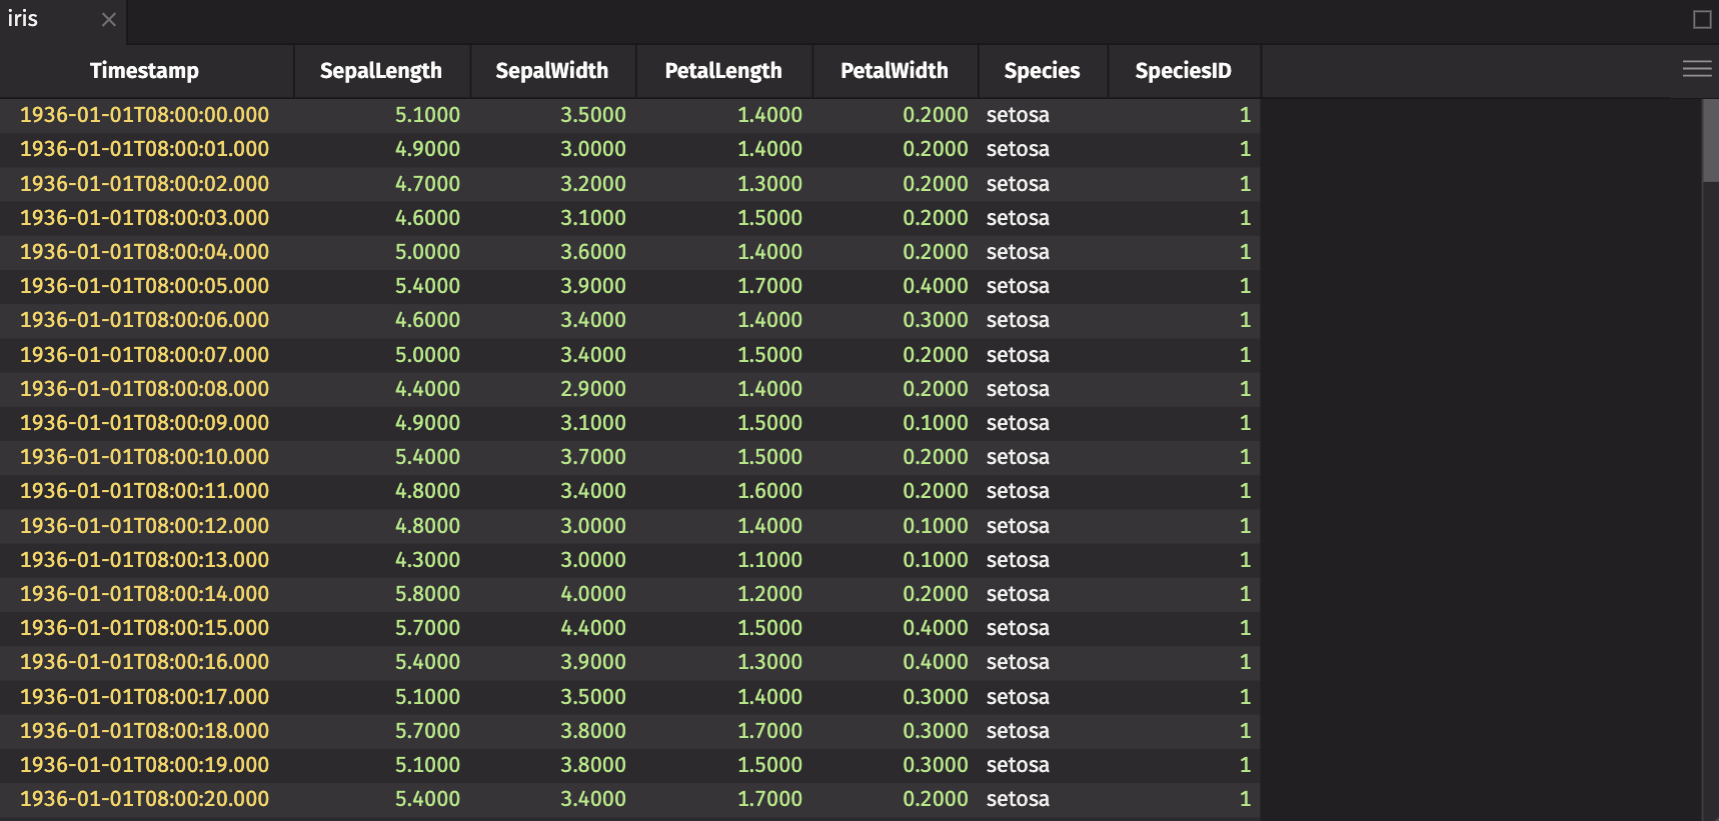
In this dataset, the Species column is a categorical column with three values: setosa, Versicolor, and Virginia. The SepalLength, SepalWidth, PetalLength, and PetalWidth columns are continuous numerical columns that contain measurements of the sepal and petal of an iris flower. The Timestamp column is also useful for ordering the data.
You’ll mostly focus on SepalLength and SepalWidth in this guide.
Basic components
Components are the building blocks of deephaven.ui. Each component takes parameters that control how the component appears. By default, a component renders in a panel.
ui.table
Wrapping a table in ui.table unlocks visual functionality on the table.
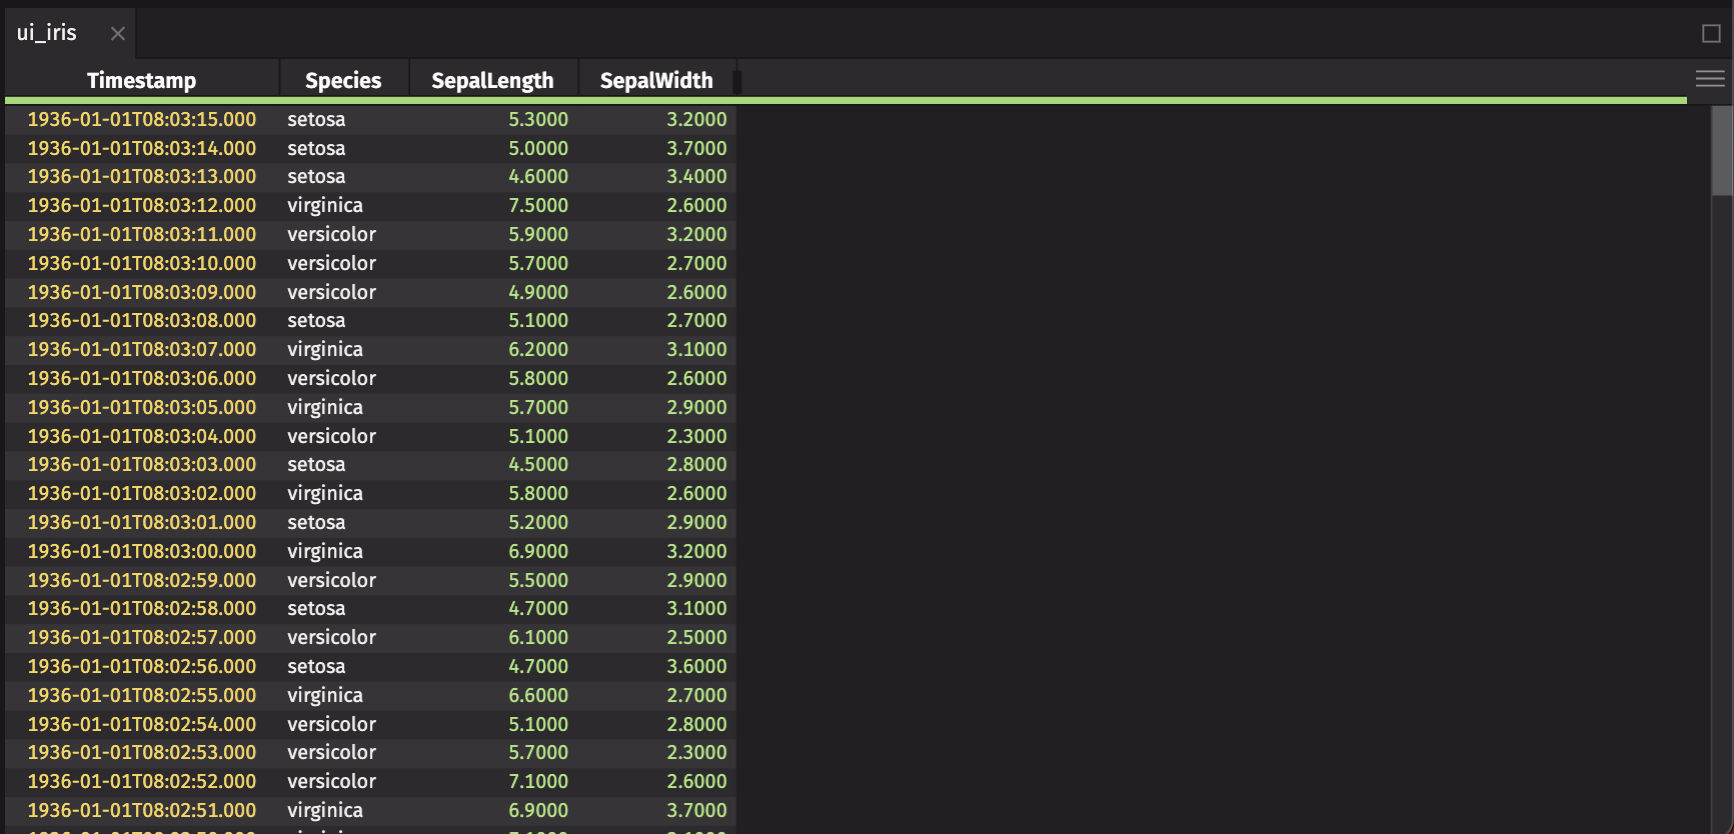
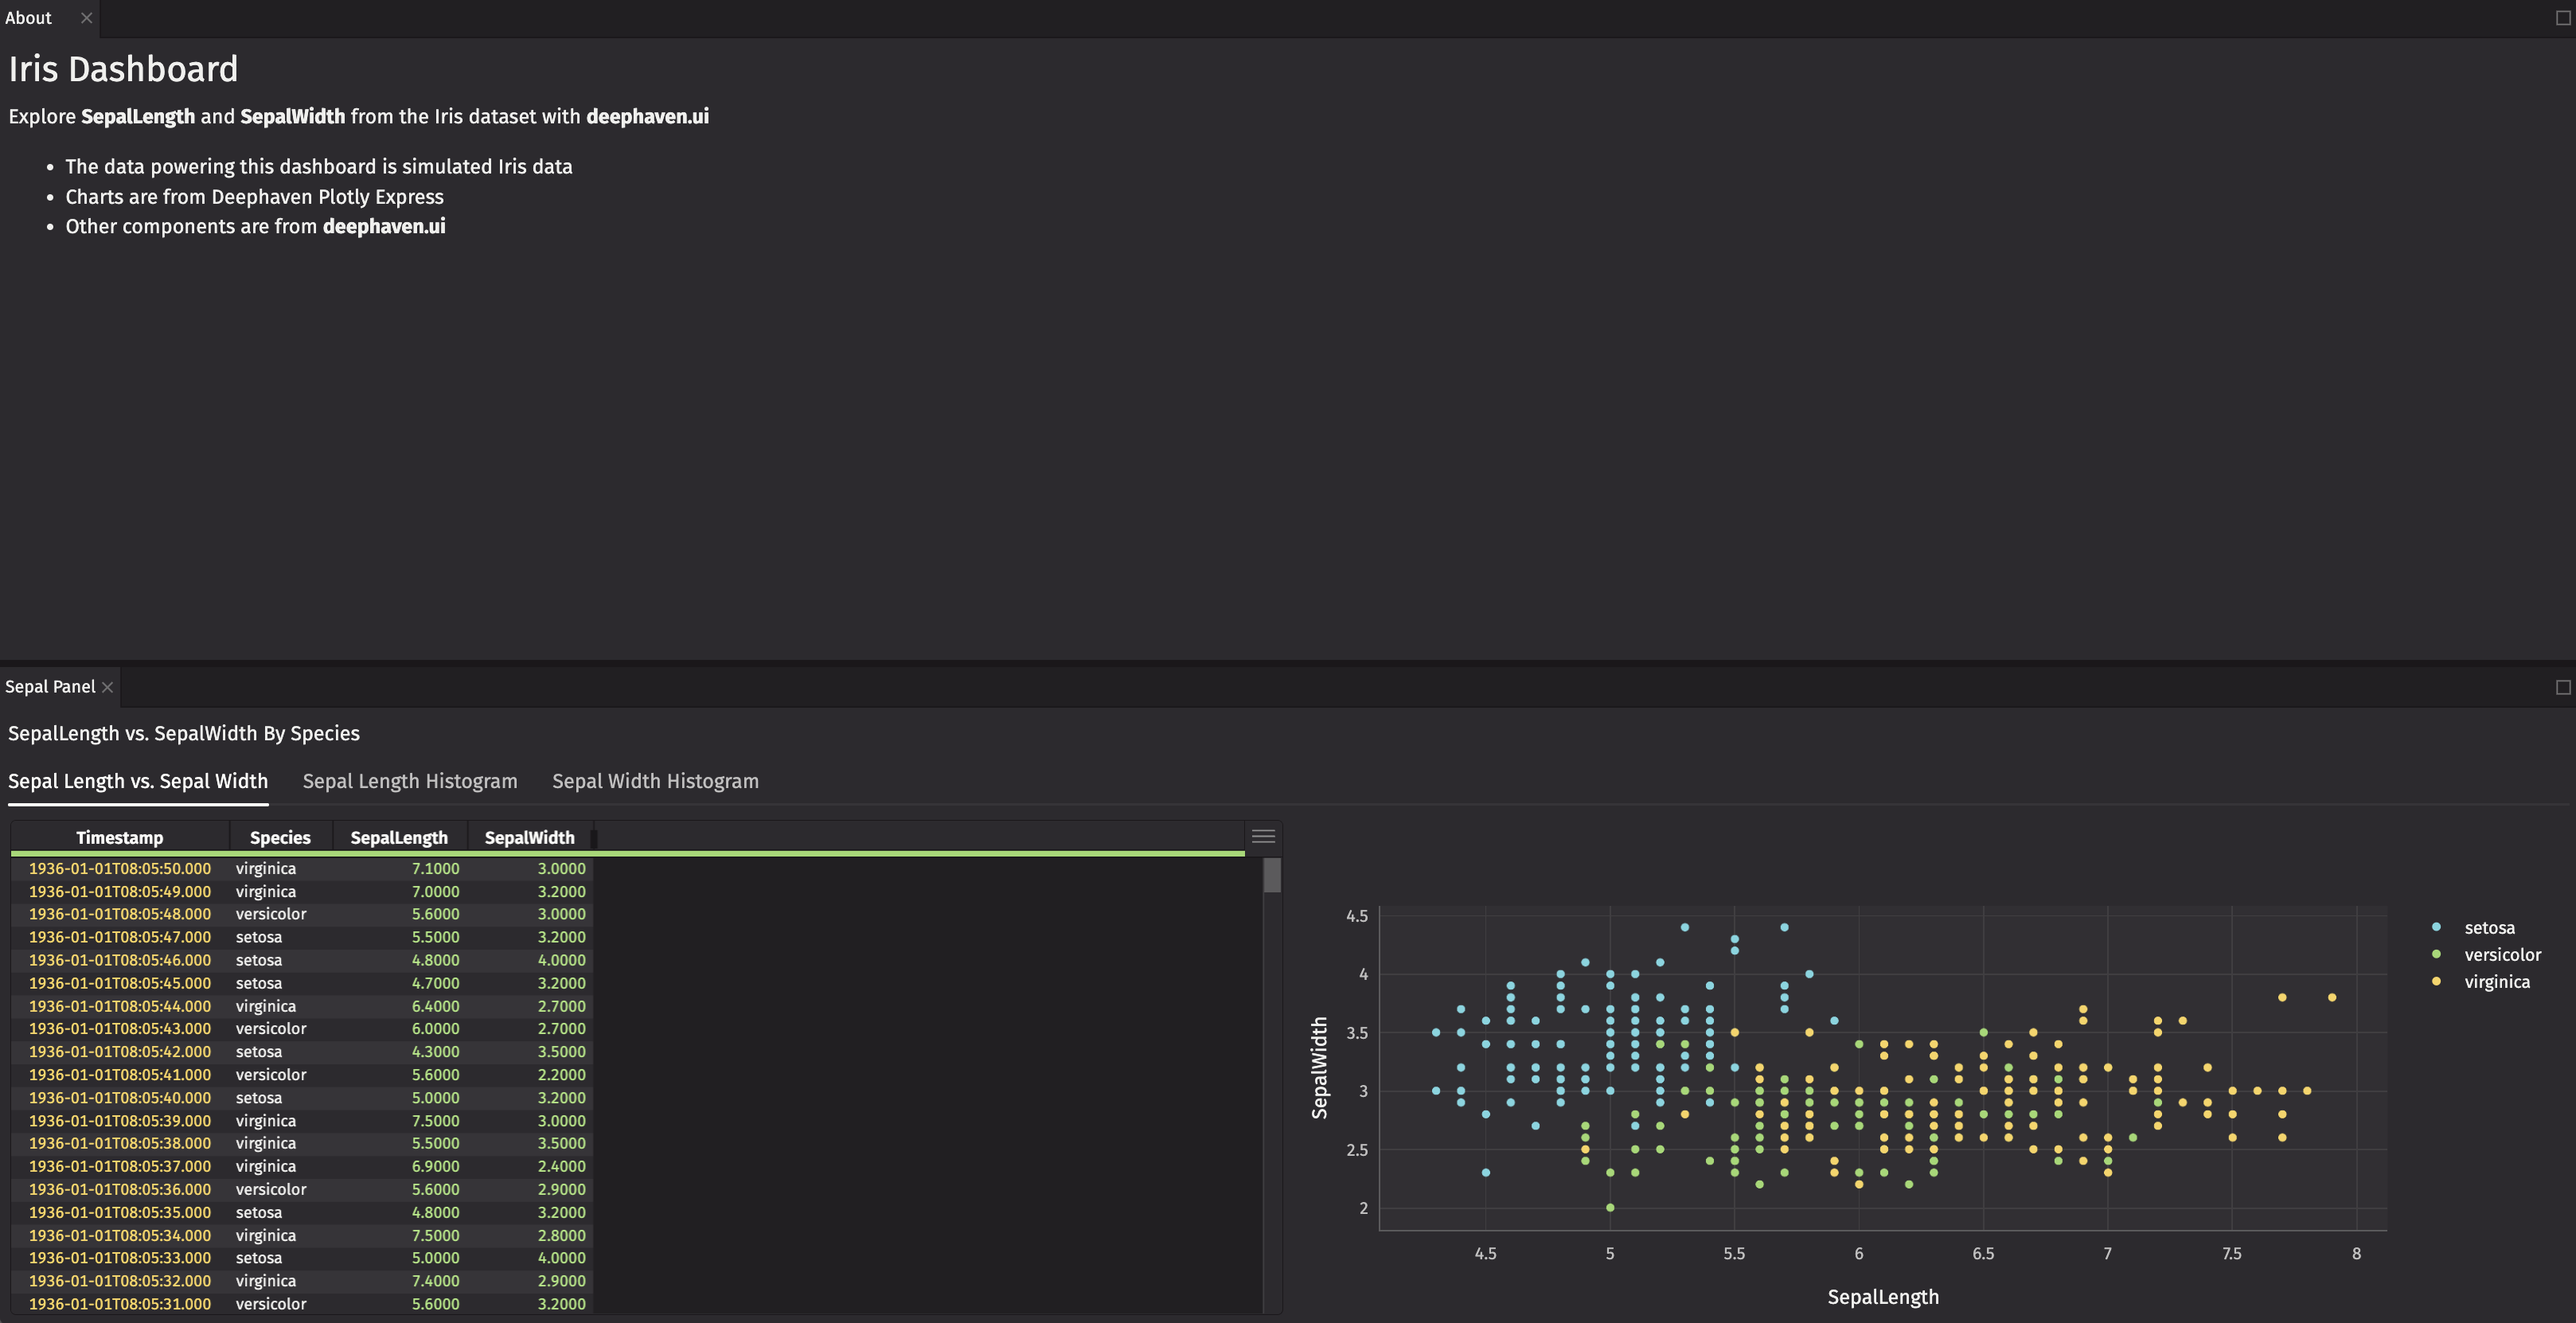
Since you’re investigating SepalLength and SepalWidth, create a ui.table that accentuates the latest filtered data.
With iris, create a ui.table that:
- Reverses the order so that the newest rows are shown first.
- Pulls the
Speciescolumn to the front along withTimestamp. - Hides the
PetalLength,PetalWidth, andSpeciesIDcolumns. - Uses the compact table density so you can see as many rows as possible.
Charts
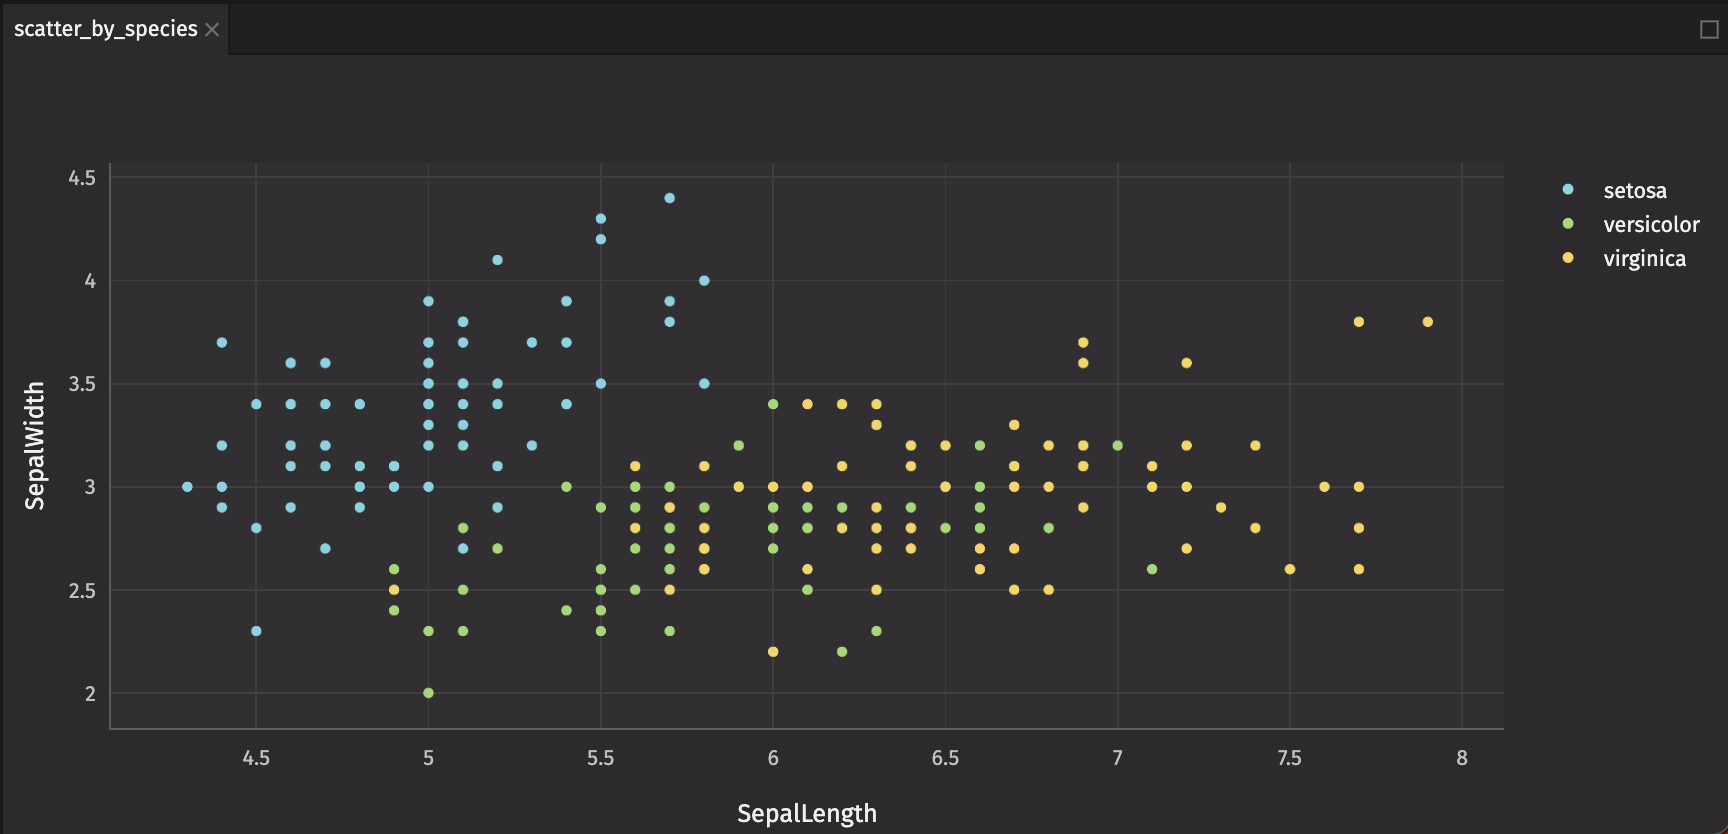
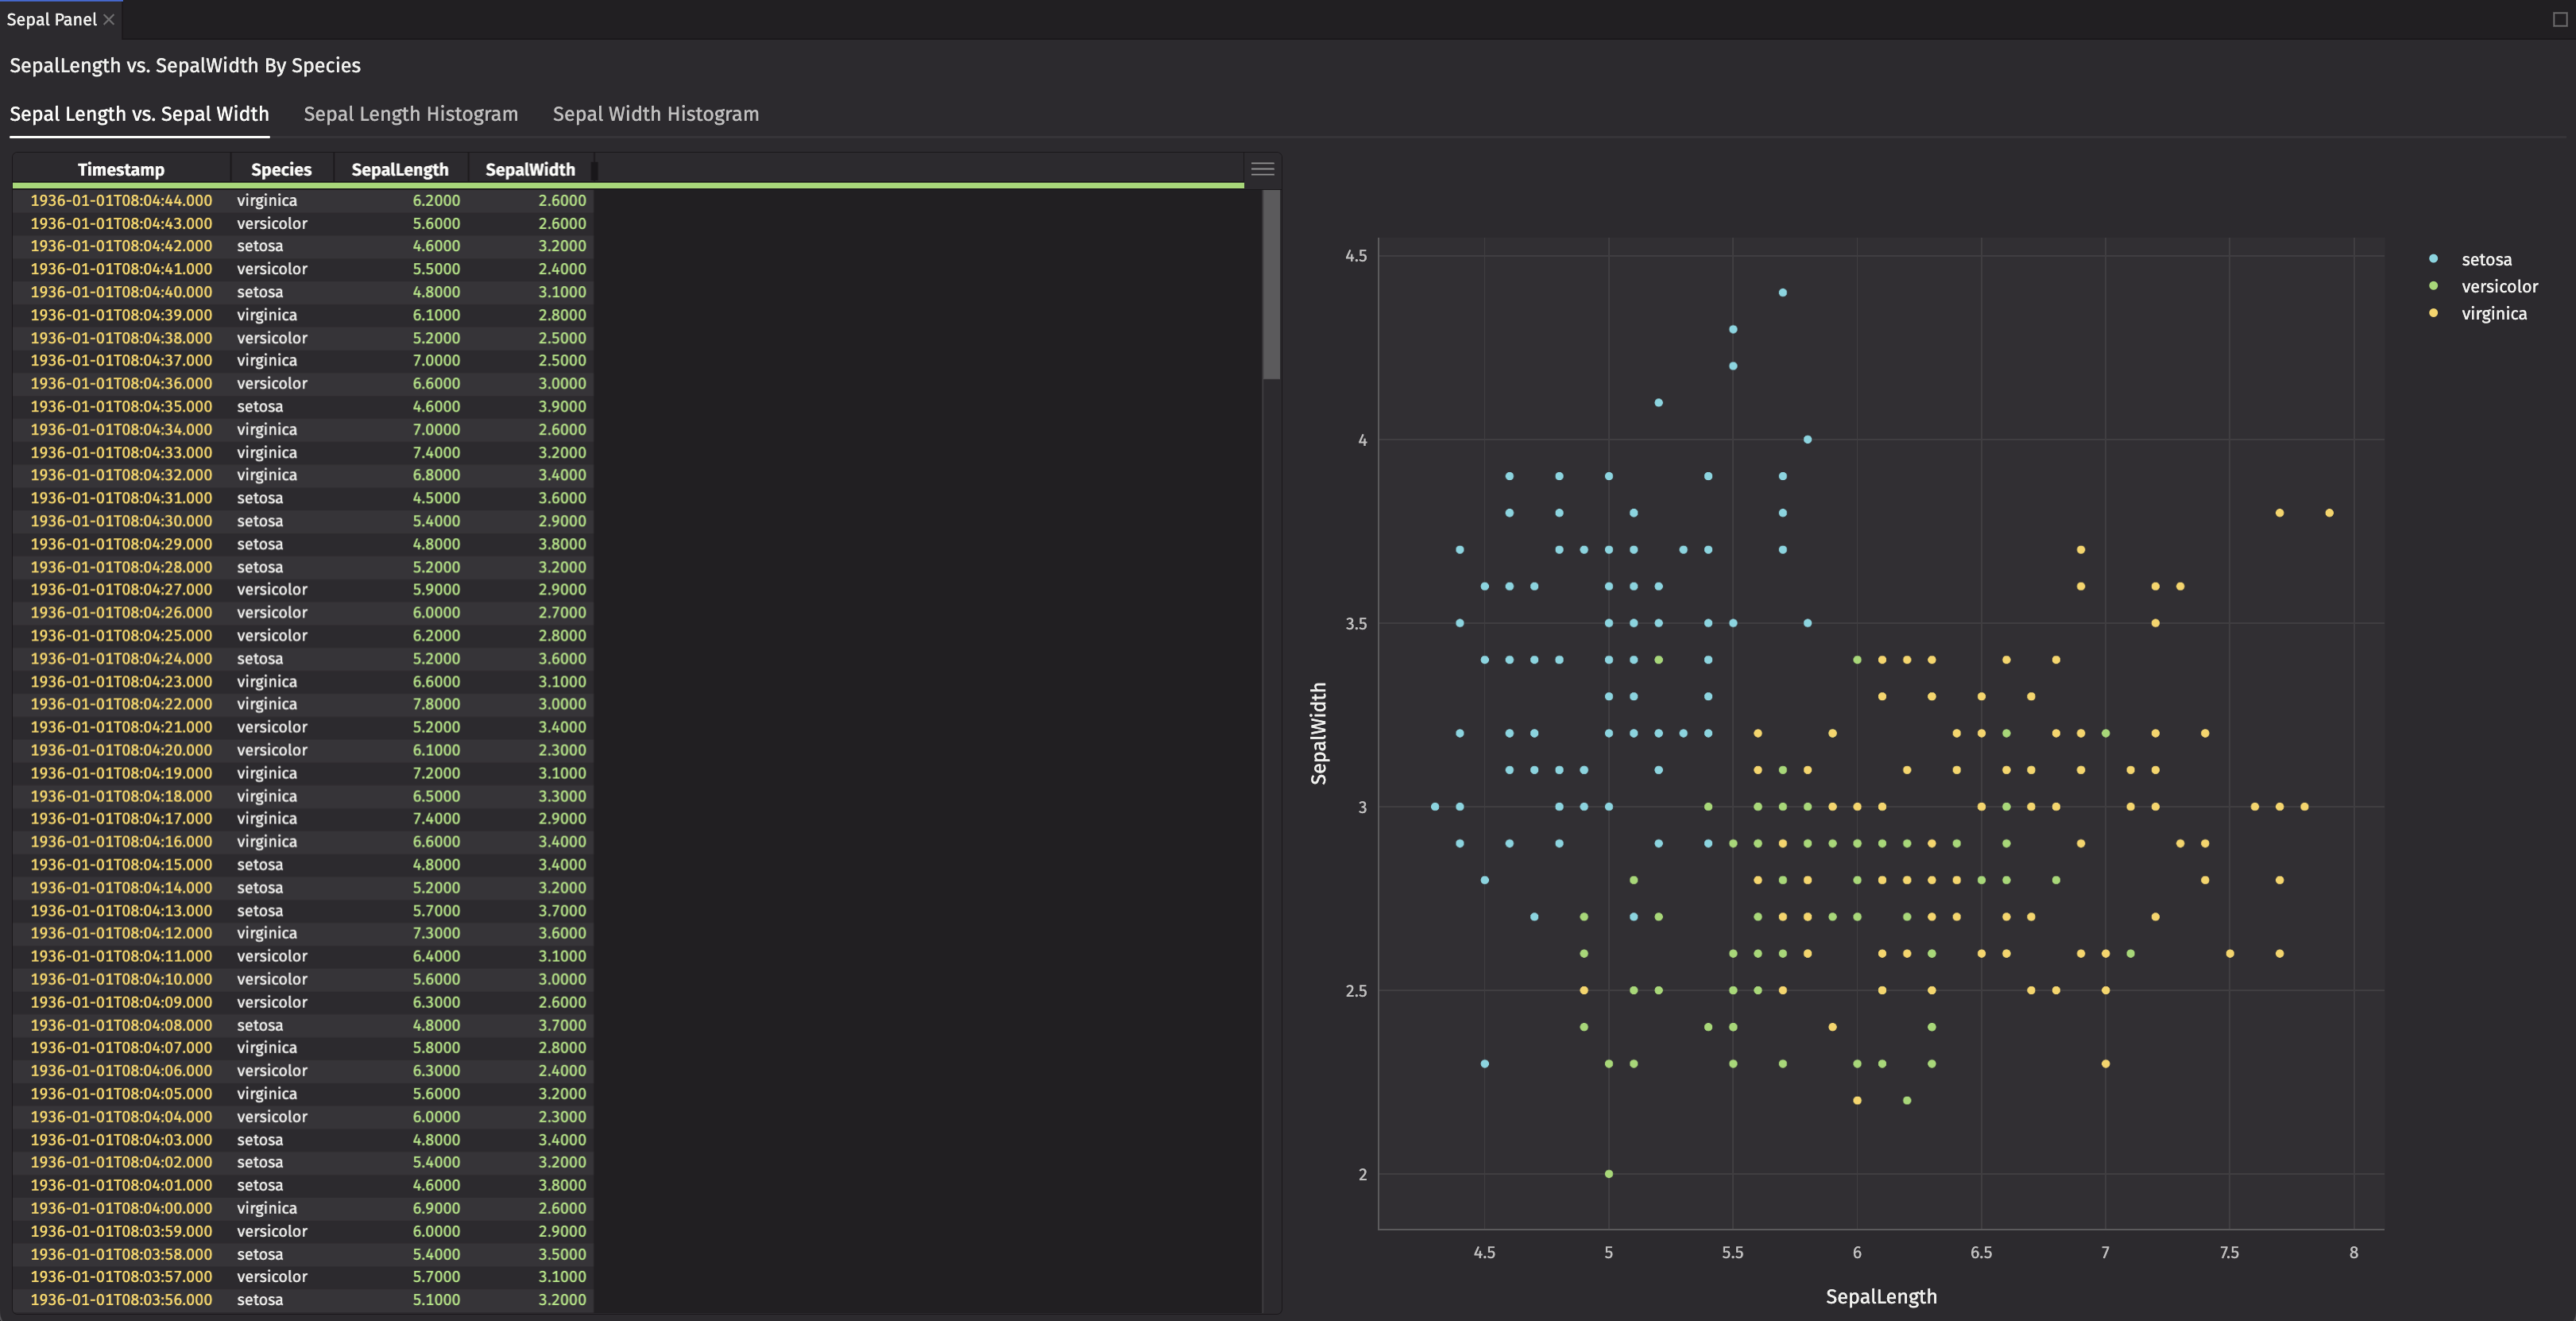
Charts from Deephaven Plotly Express (dx) have no deephaven.ui specific wrapping and are added directly. Create a dx.scatter chart that compares SepalLength and SepalWidth by Species.
ui.text
The ui.text component adds basic text. Create text to accompany the chart and table.
ui.flex
Wrap your chart and ui.table in a ui.flex component. ui.flex is an implementation of Flexbox that enables responsive layouts that adjust as you resize panels.
Items within a ui.flex component stretch and shrink based on available space.
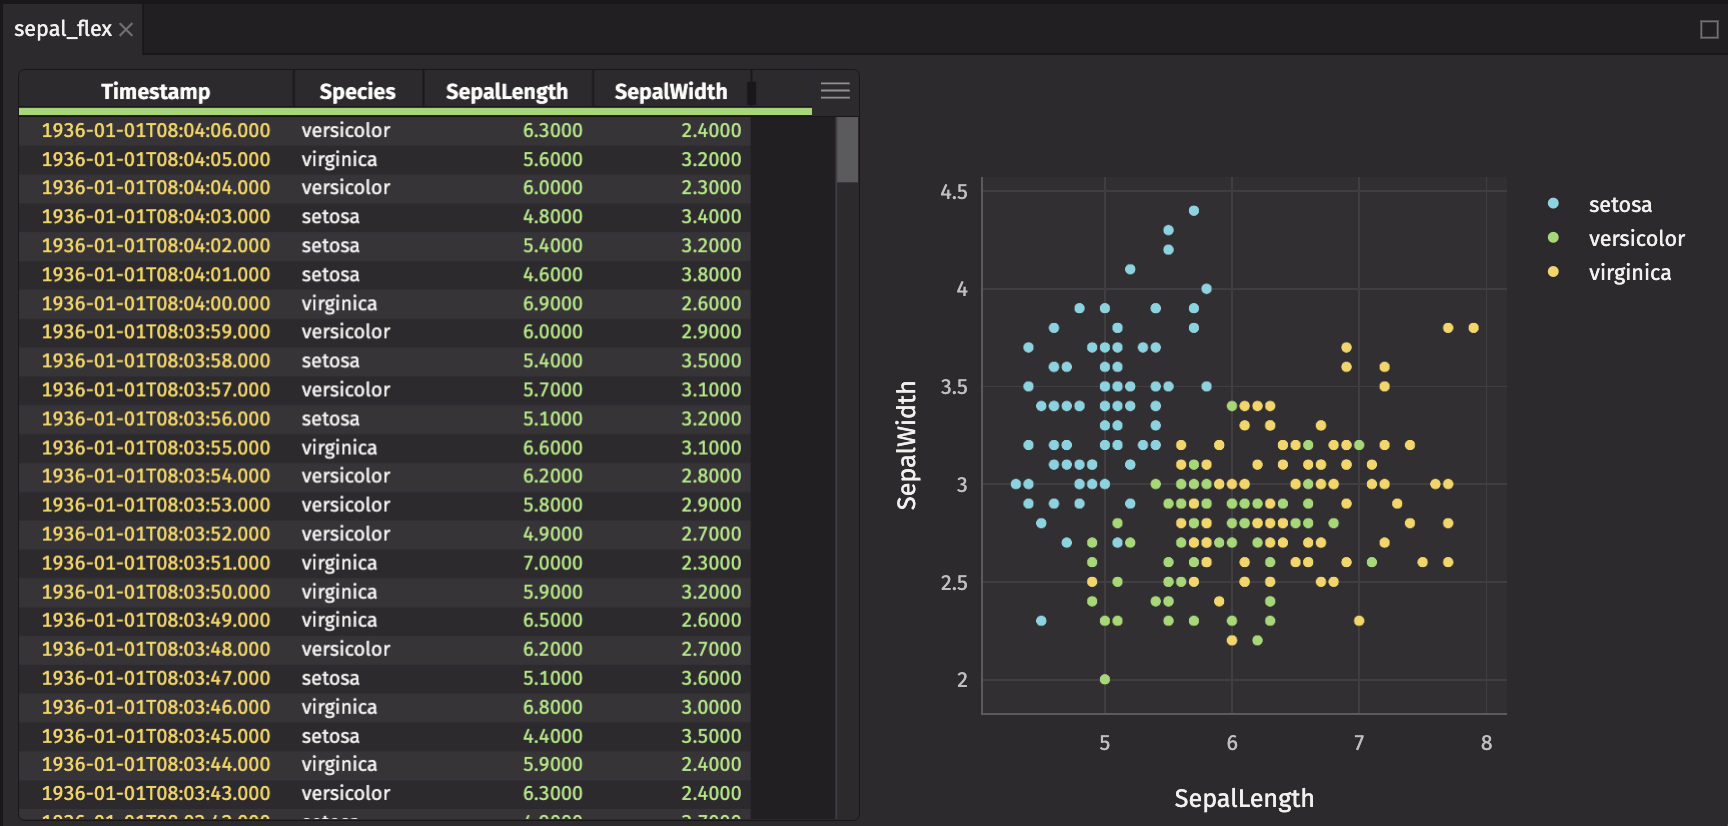
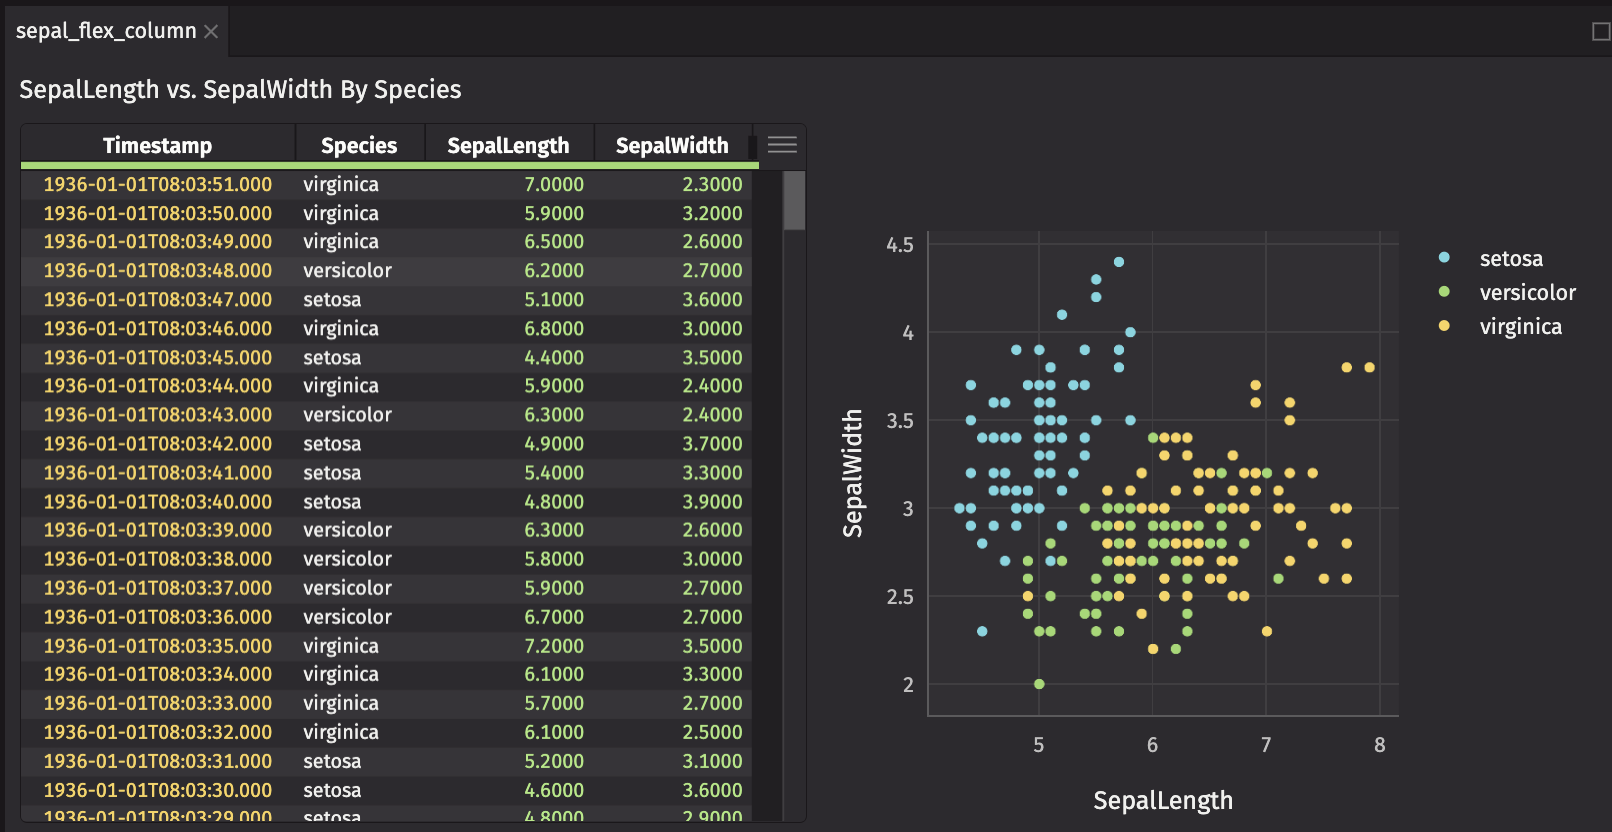
The direction of sepal_flex is "row". Add sepal_text and sepal_flex to another panel, with a direction of "column".
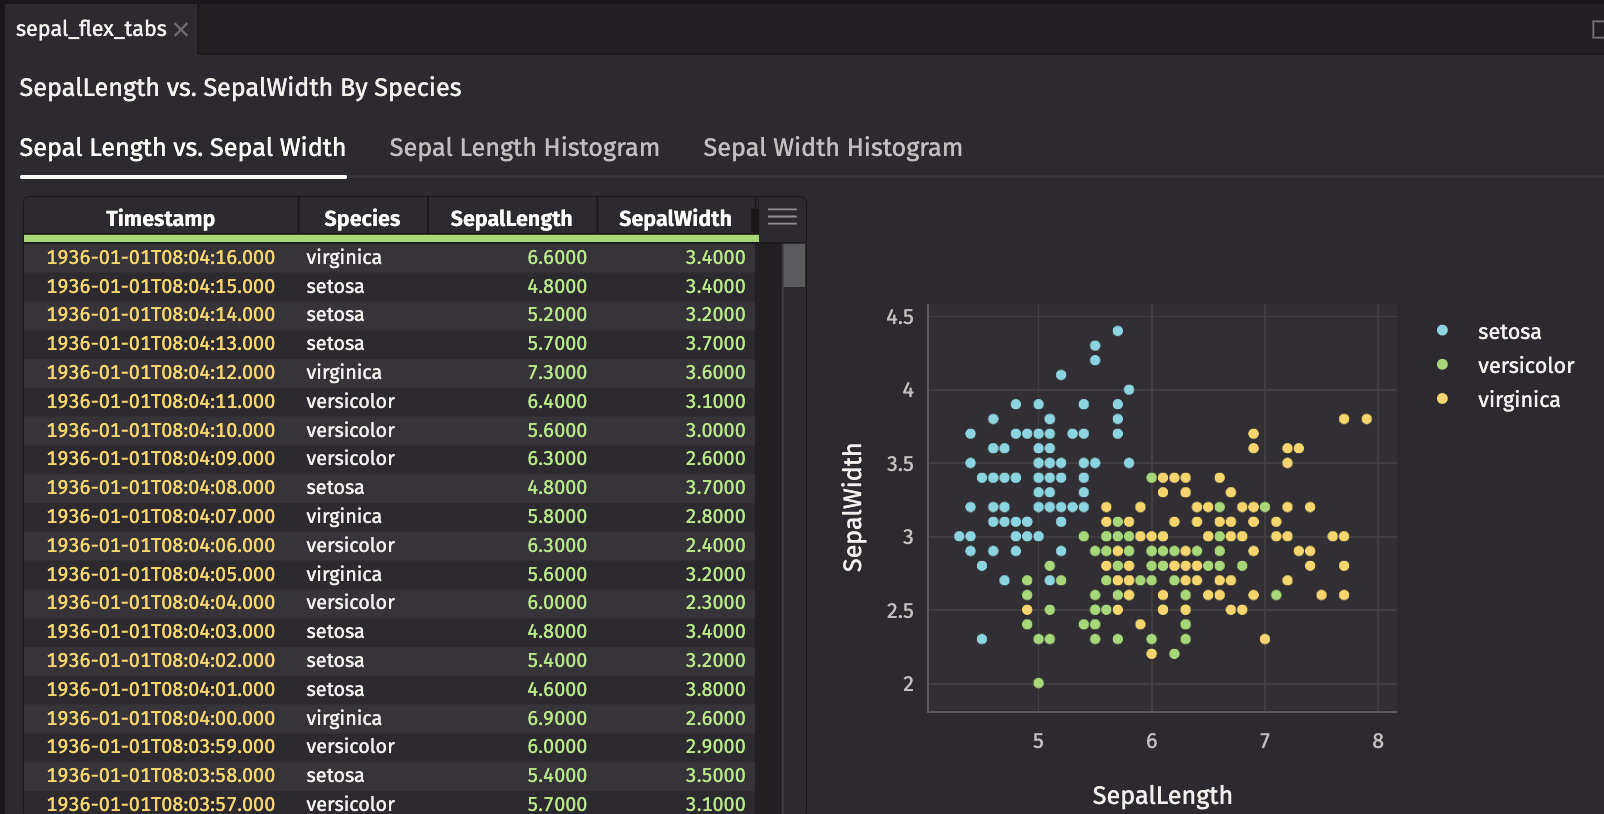
Tabs
The ui.tabs component enables tabs within a panel. Create histograms of SepalLength to display in tabs.
Histograms are useful to display comparisons of data distributions, so create dx.histogram charts of the columns of interest, SepalLength and SepalWidth, by Species.
Create ui.tab elements for sepal_flex, sepal_length_hist, and sepal_width_hist, then pass them to ui.tabs to switch between different views.
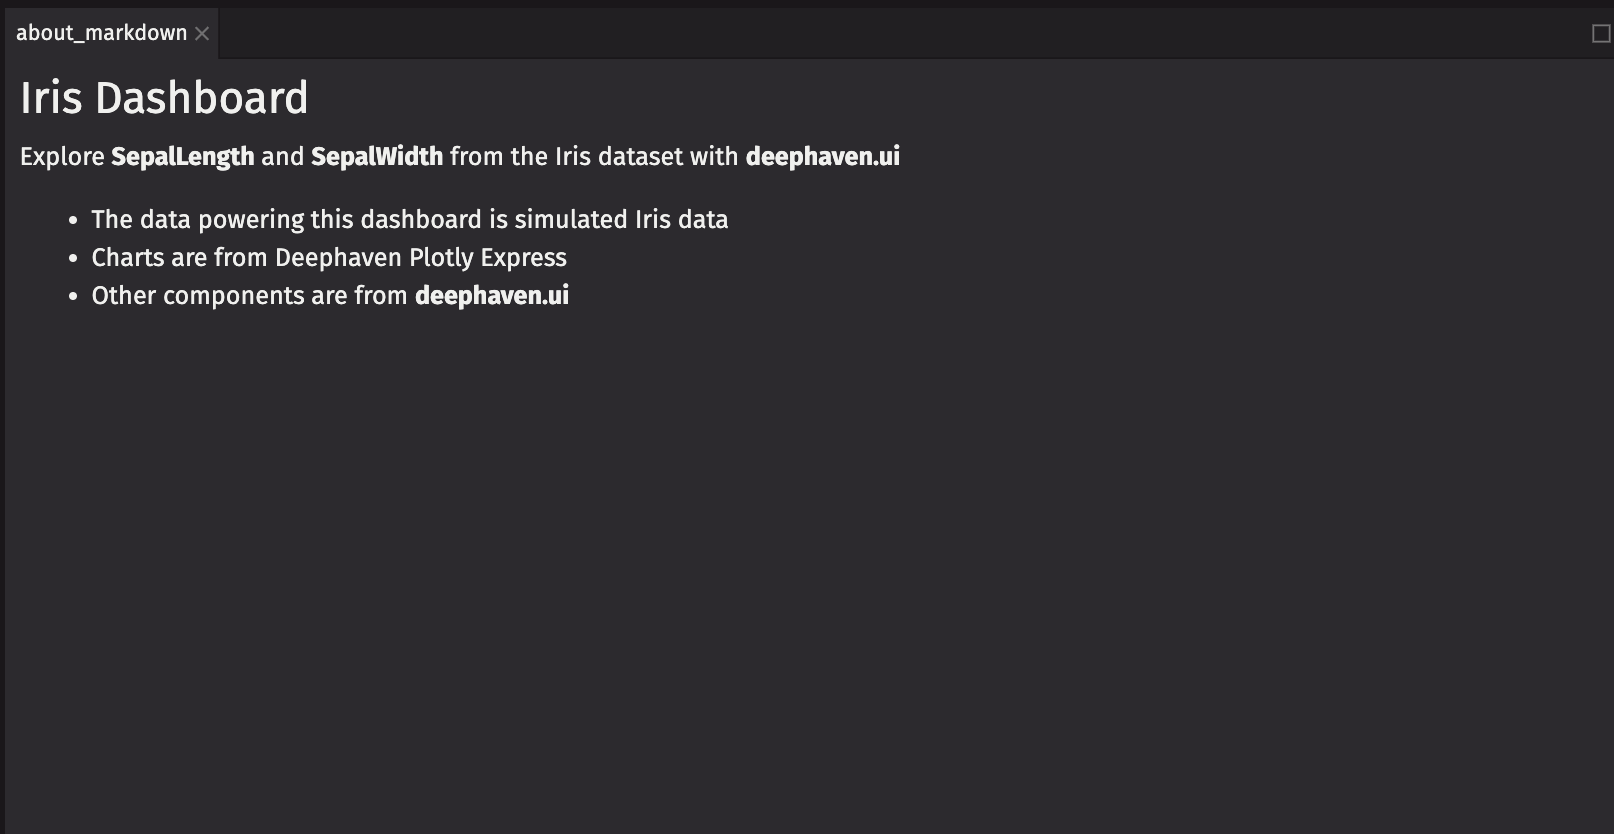
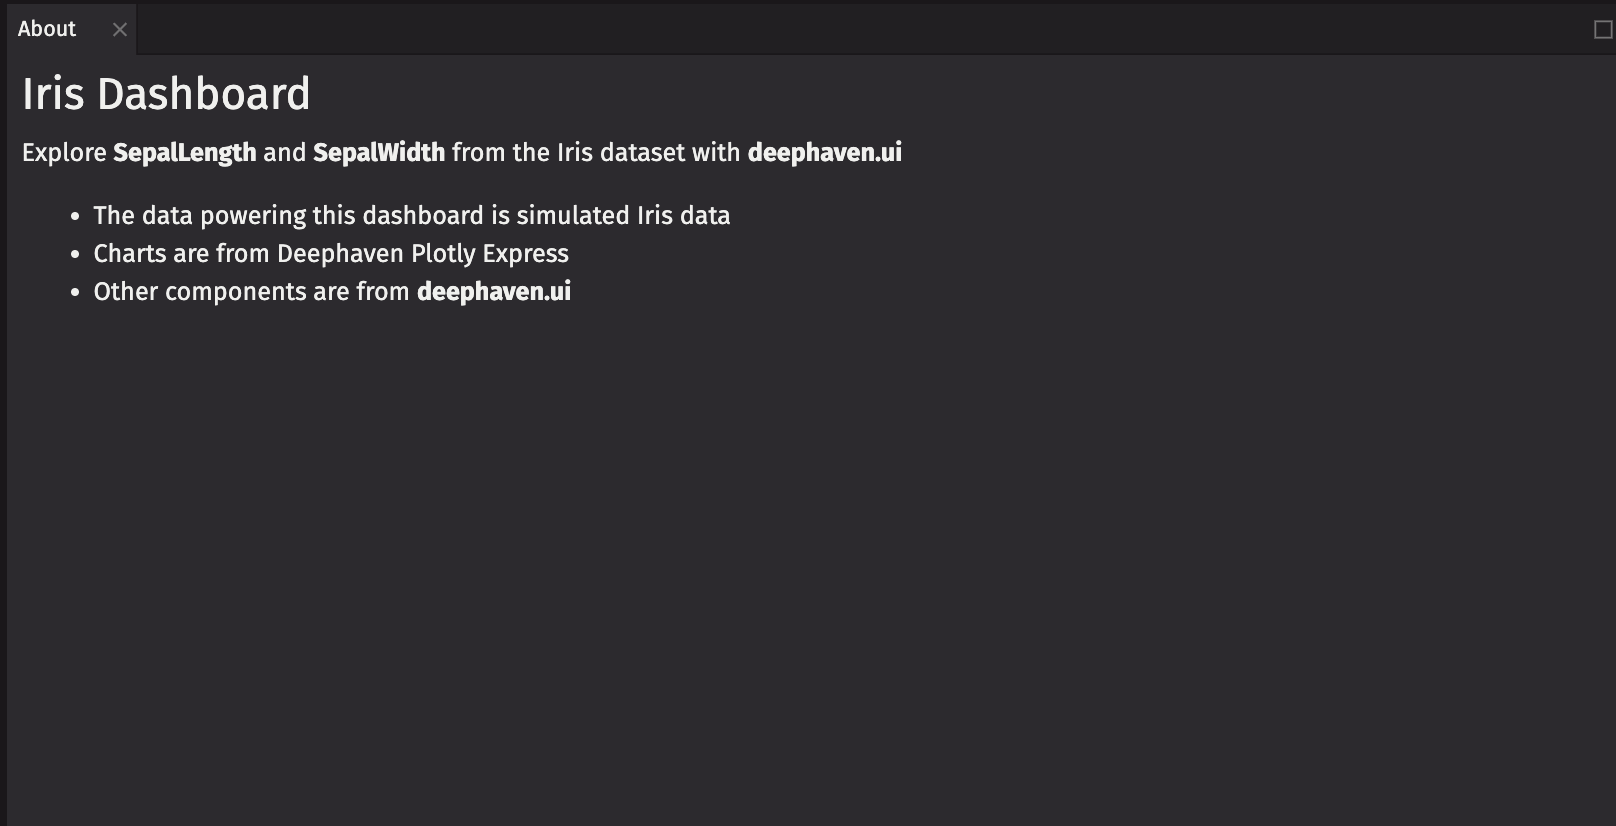
Markdown
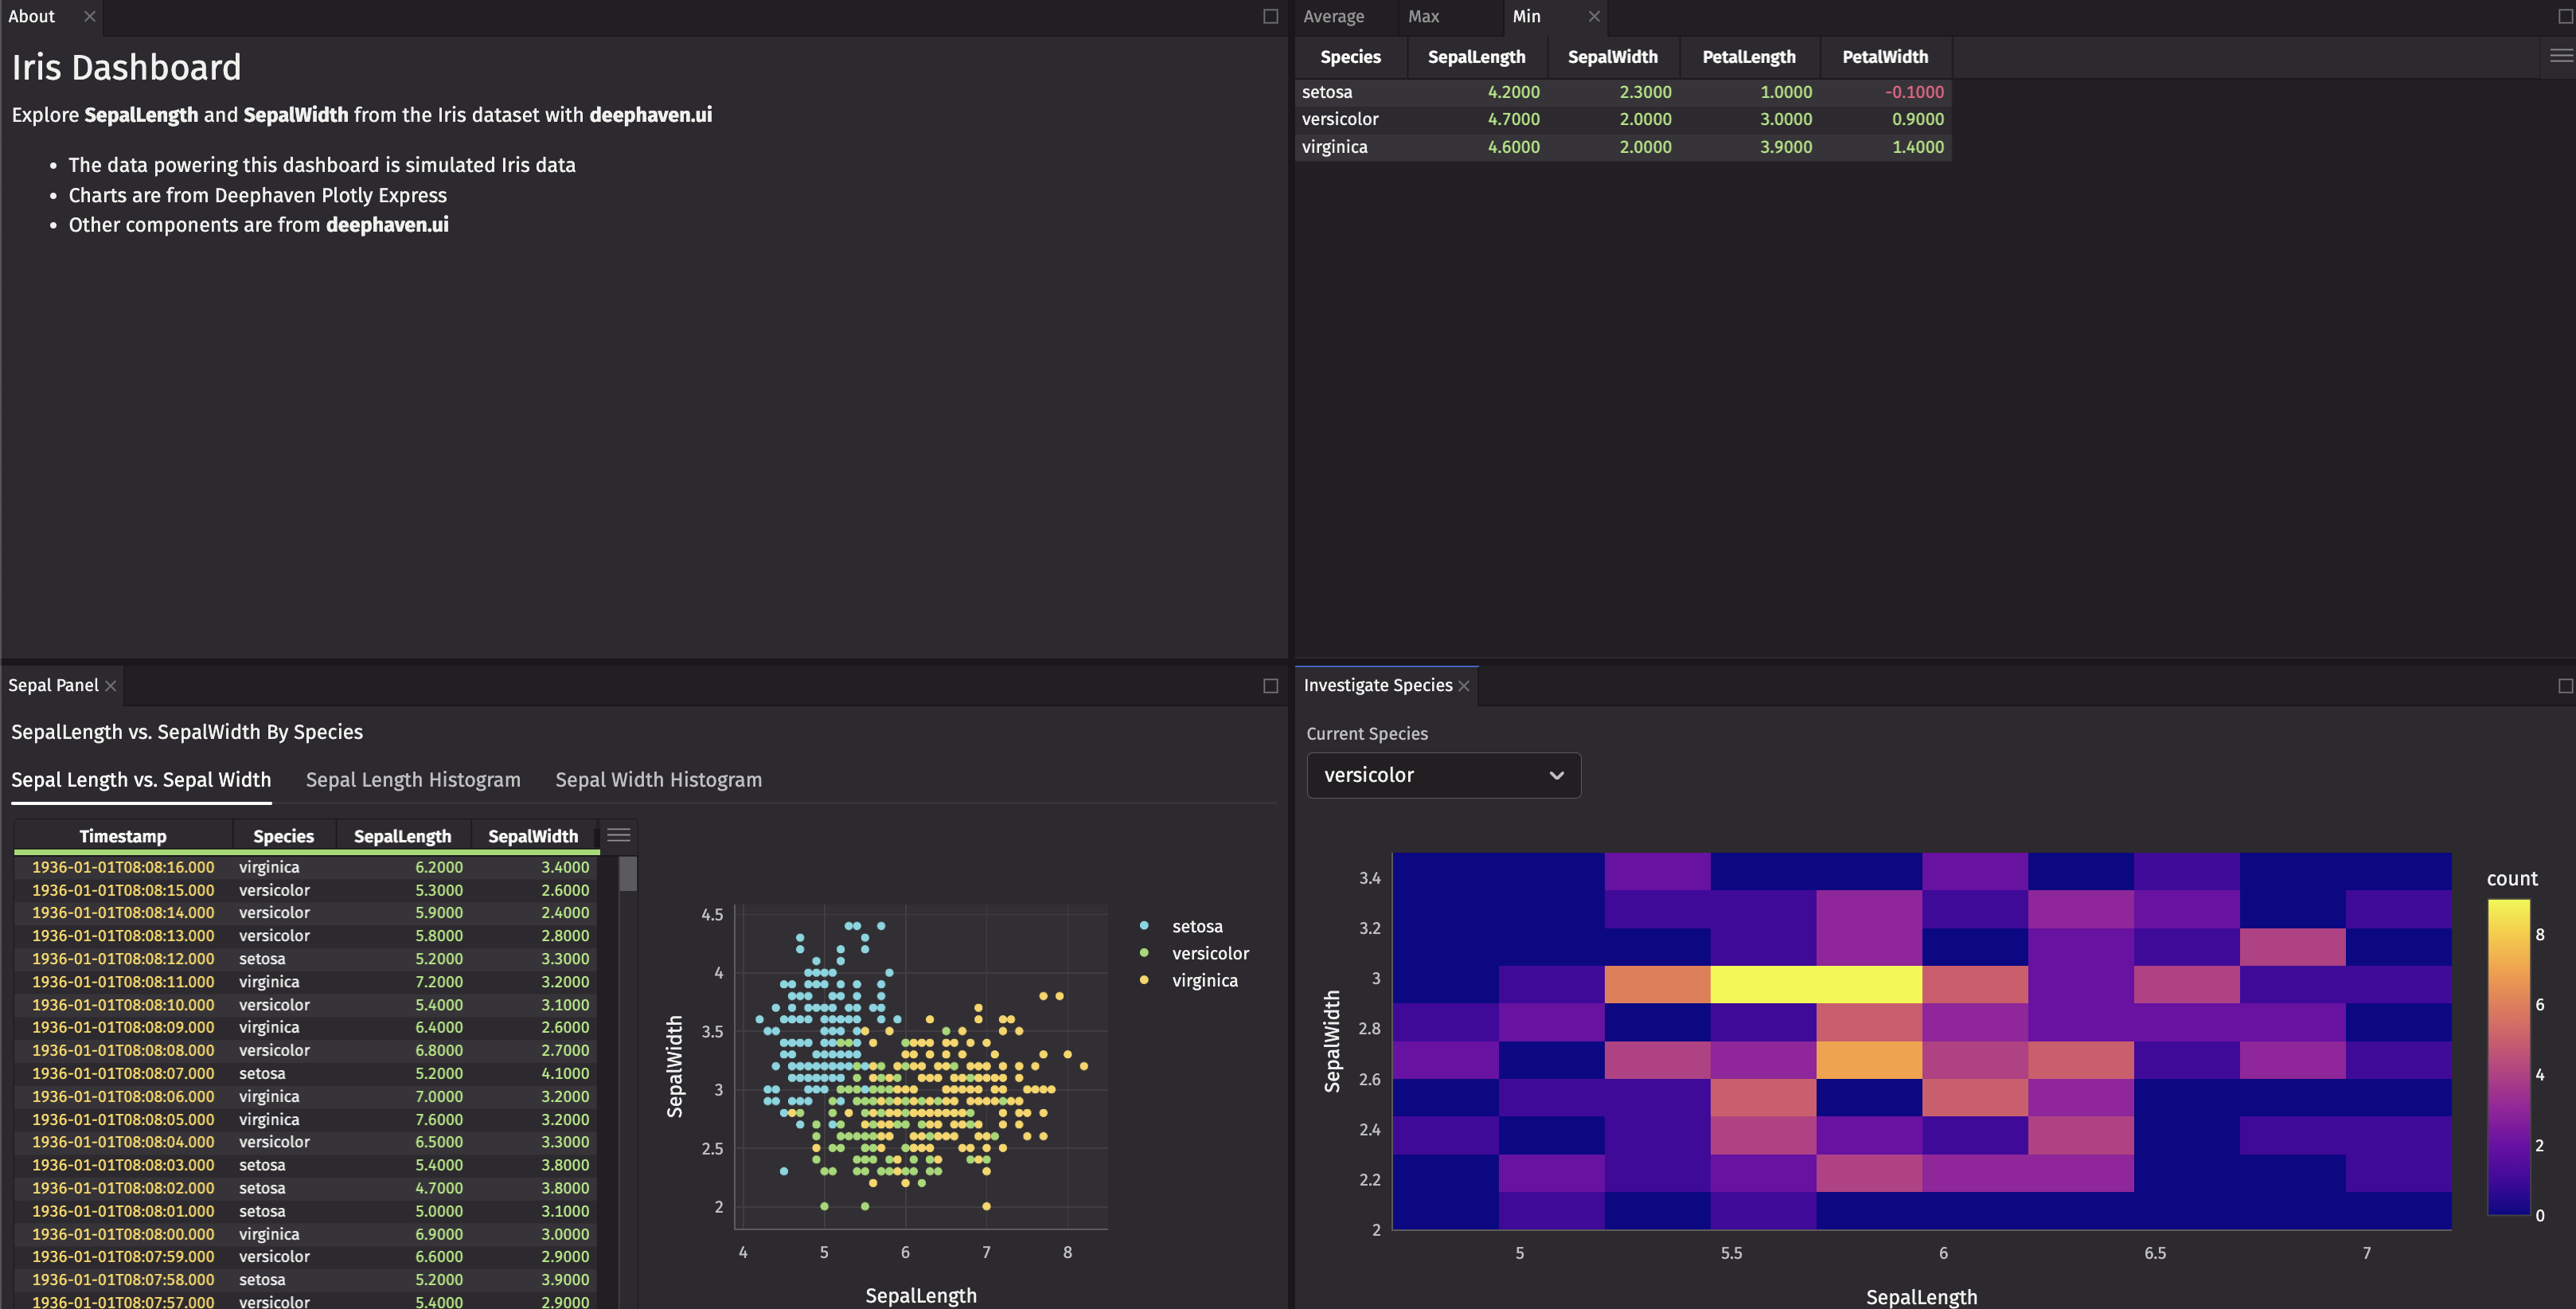
ui.markdown components allow you to provide text in a markdown format. Create an informational panel with markdown text.
Now you have two responsive panels with fundamental components of deephaven.ui that explore SepalLength and SepalWidth by Species.
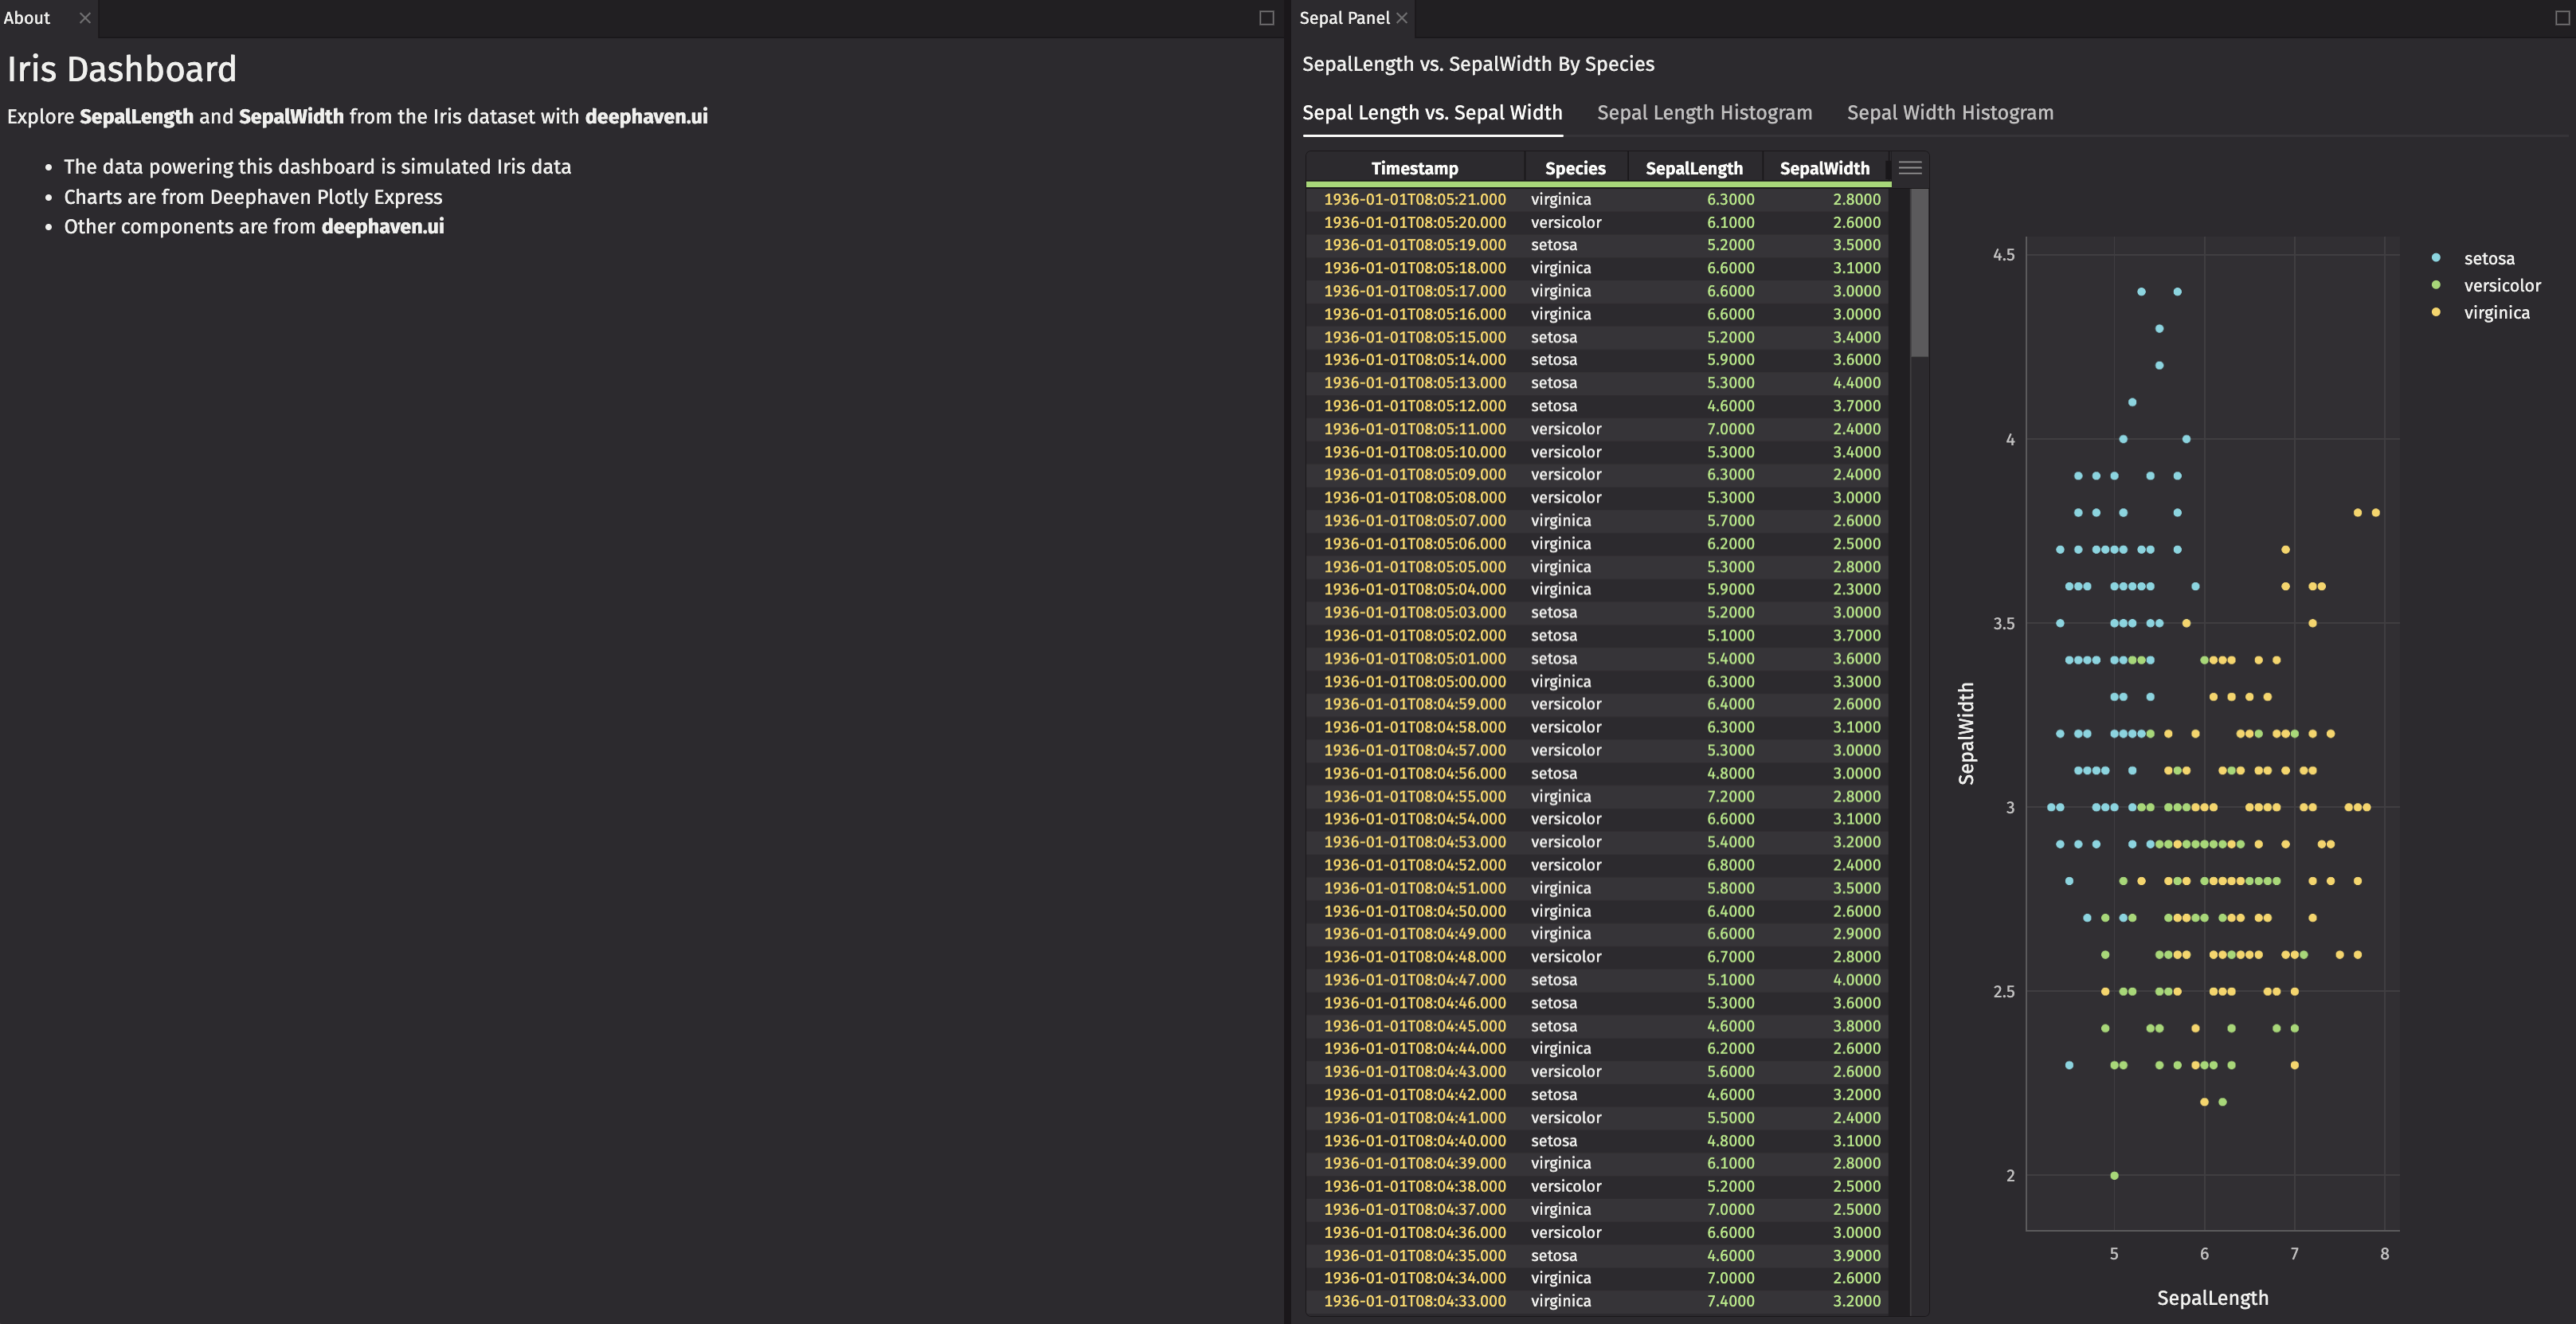
Dashboard
By default, components are rendered in a panel, but a dashboard enables more complex layouts in an isolated window.
When you have multiple panels, you can create a dashboard to contain them so that you can add even more panels later for your iris data exploration.
Expand for complete code up to this point
Before that, create a ui.panel manually to provide a title.
You now have a one-panel dashboard.
You can create a default layout with multiple panels. Create a panel for about_markdown so you can give it a title.
Row
One way to create a default layout is by wrapping your panels in a ui.row component.
Column
Another way to create a default layout is with ui.column.
Stack
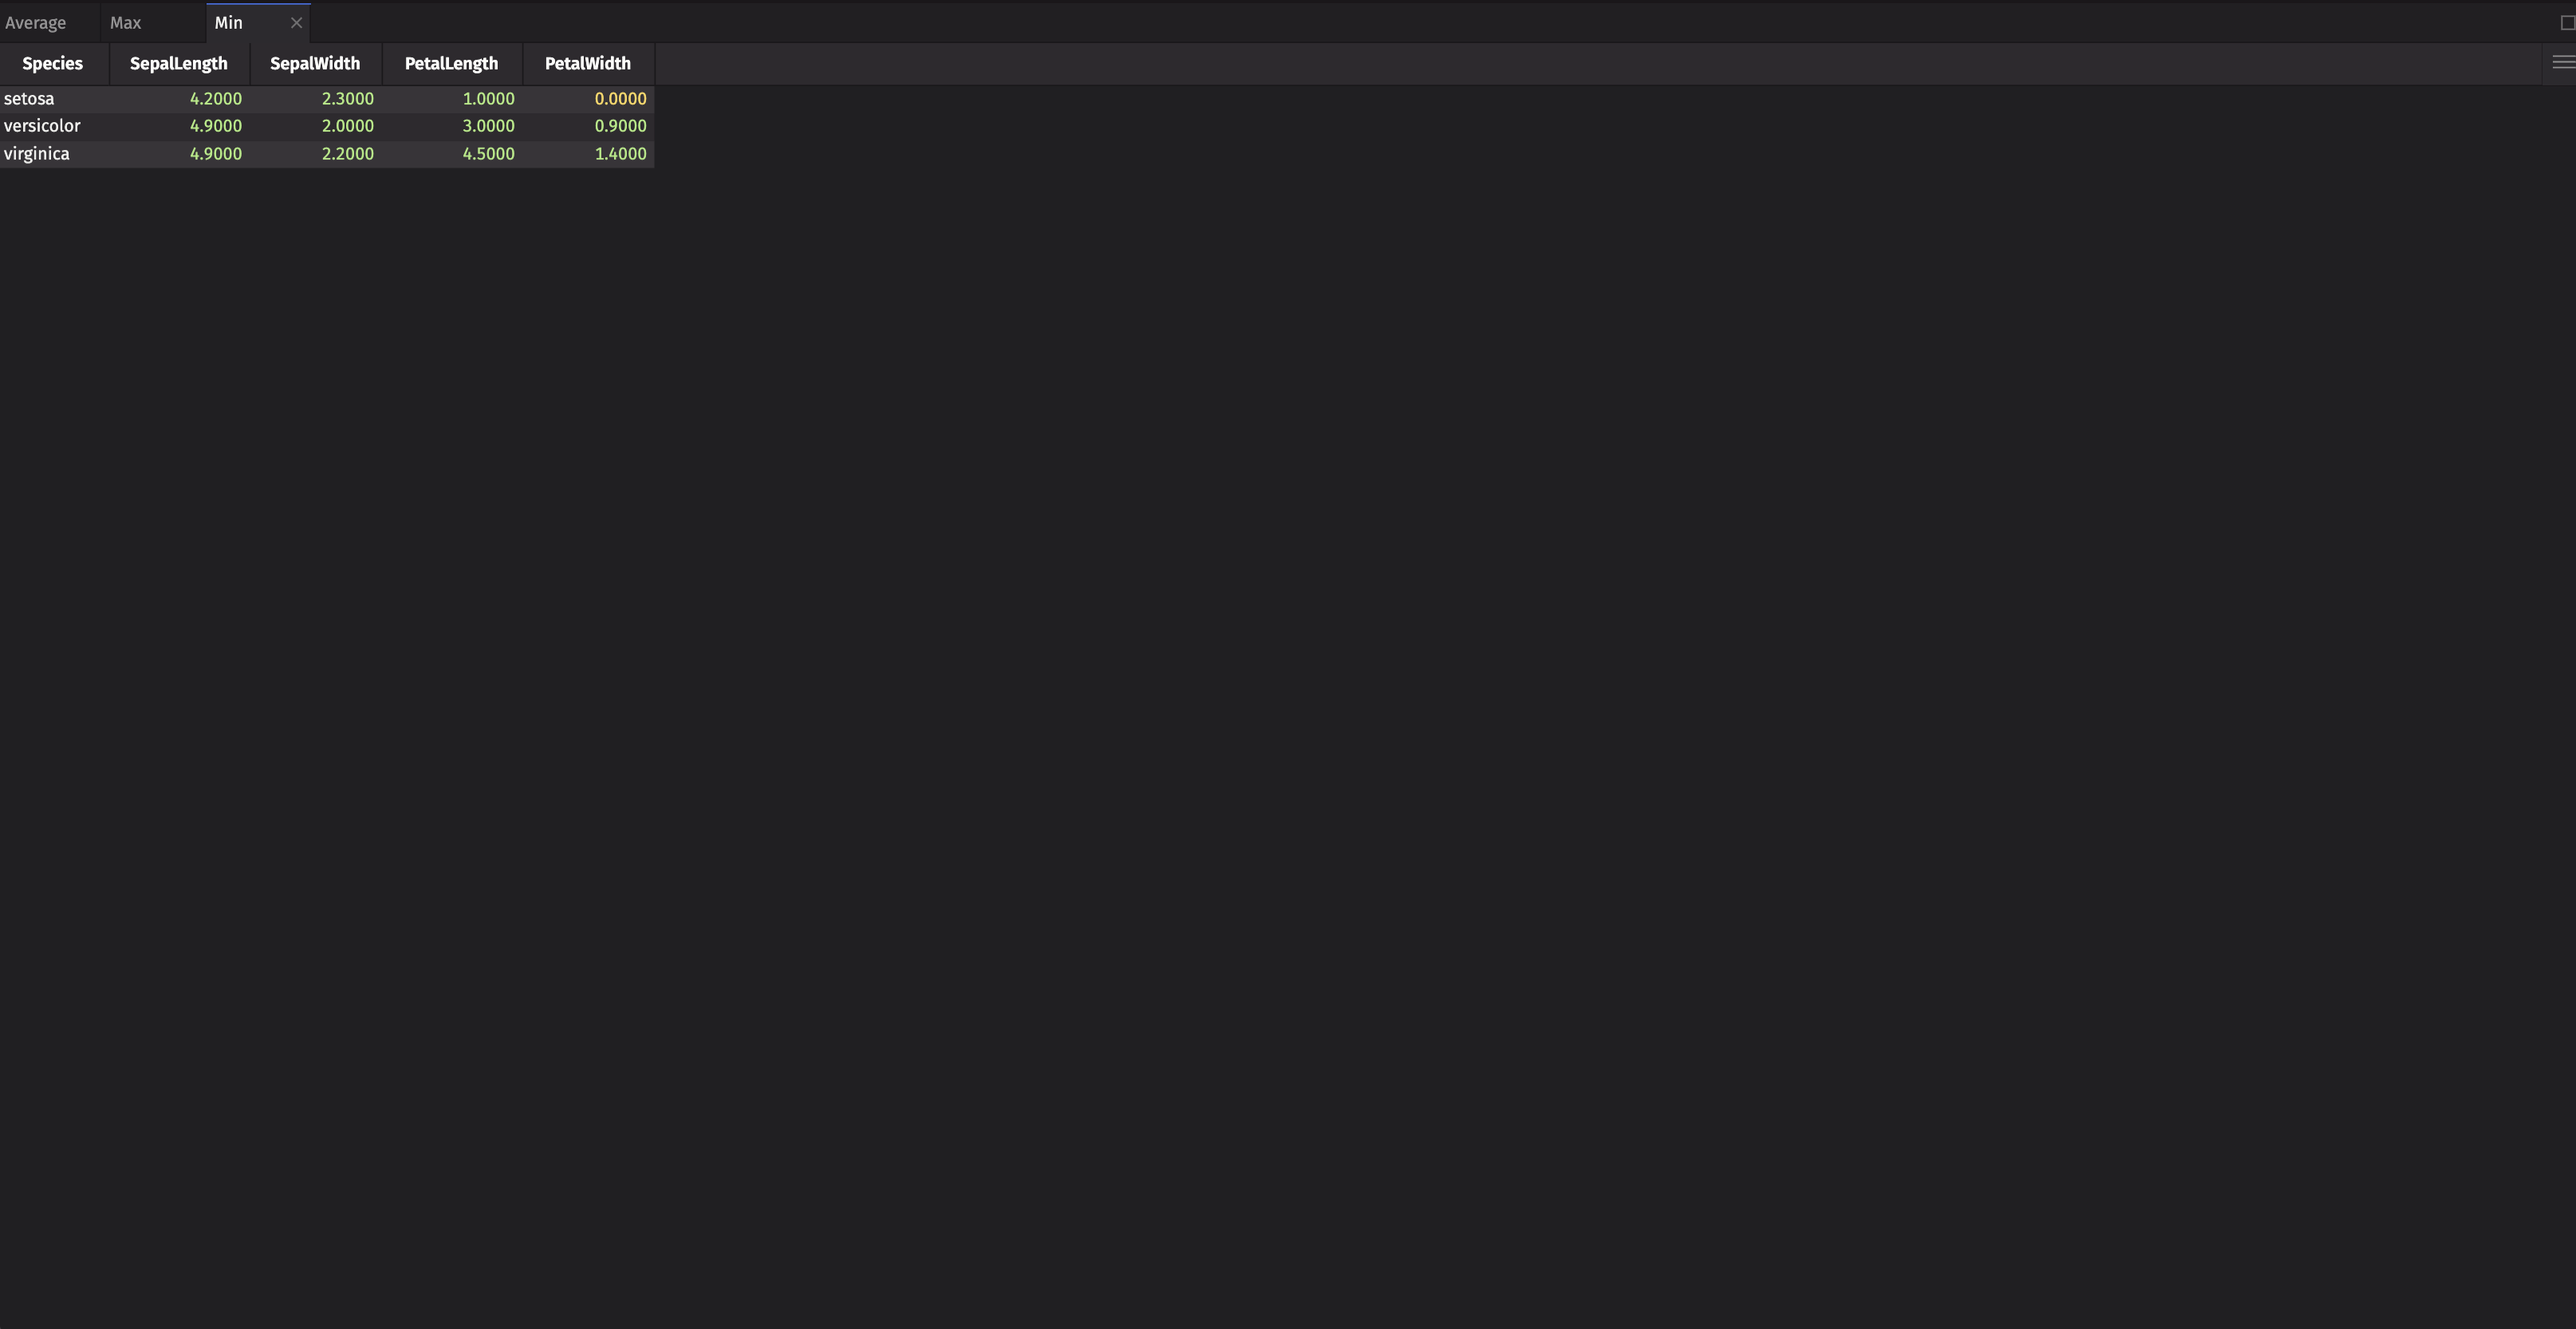
One more way to create a default layout is with ui.stack. The last panel is active by default.
ui.stack is useful if you want a tabbed layout but also the ability to move the individual components around, which is not possible with ui.tabs.
Create tabs that show the average, max, and min values of SepalLength, SepalWidth, PetalLength, and PetalWidth by Species.
You can compare a specific statistic across the different Species within the same panel or move between panels to compare different statistics across Species.
Interactivity
So far, you’ve worked with deephaven.ui components that don’t interact with each other. Now, you’ll create your own component with interactivity and embed it into your dashboard.
Since this walkthrough investigates SepalLength and SepalWidth, this section shows you how to create a dx.densityheatmap chart that shows the density of SepalLength and SepalWidth, with a Species filter.
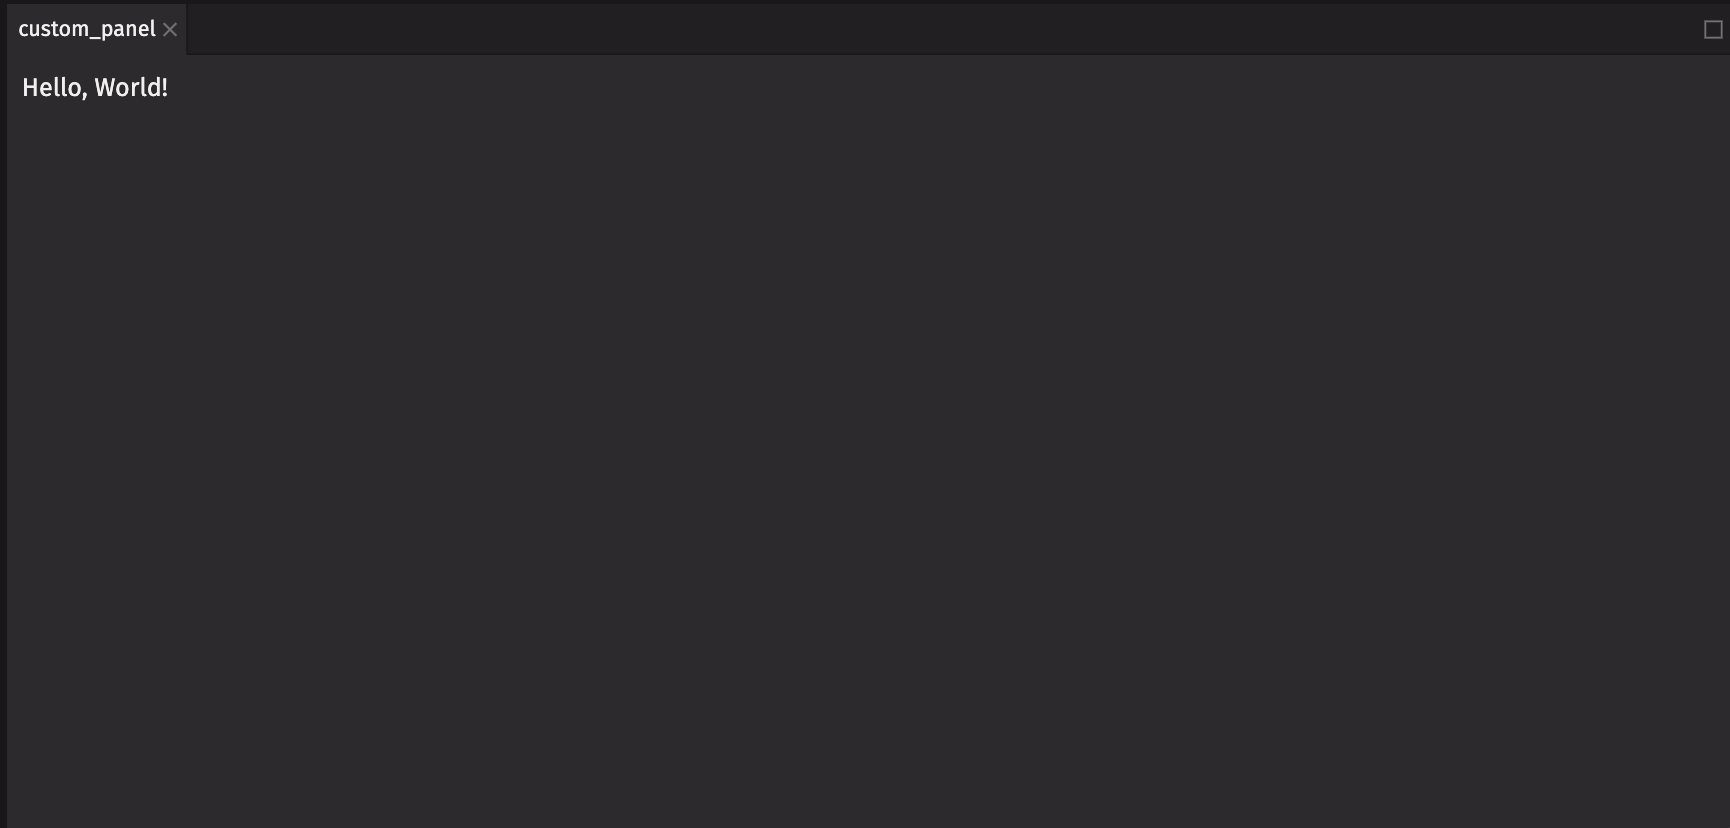
ui.component
A custom component uses the ui.component decorator. The decorator signals to the deephaven.ui rendering engine that this component needs to be rendered. Create a function with the ui.component decorator that returns "Hello, World!".
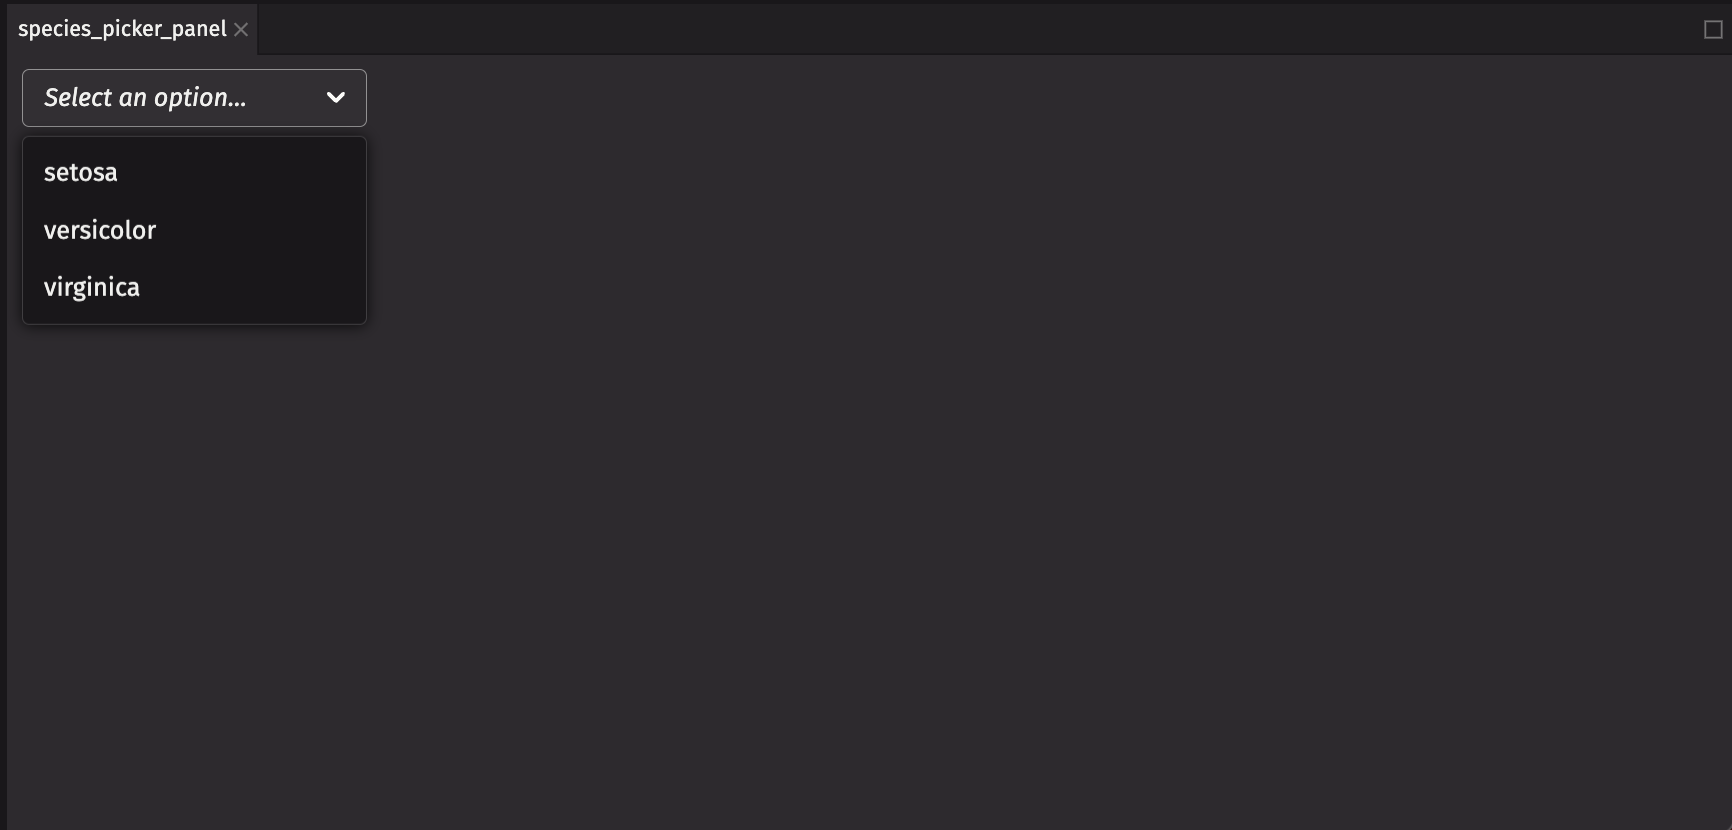
Picker
A ui.picker allows you to select options from a list.
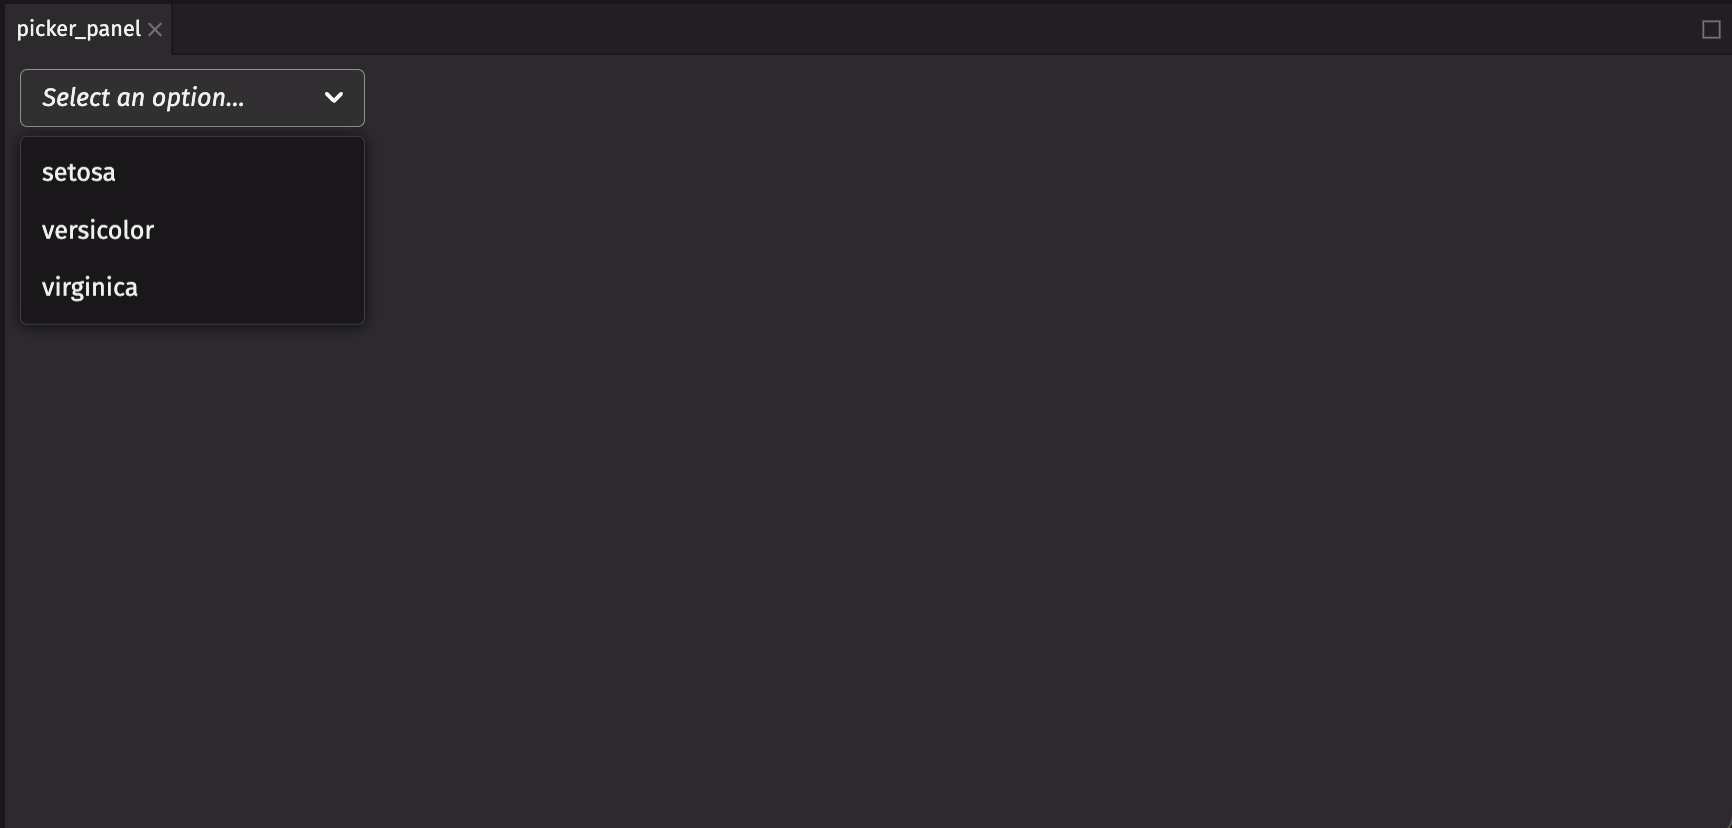
Table-backed ui.picker
ui.pickers can pull directly from a table so they update automatically based on a column in the table. Modify your ui.picker to pass in a table instead, which is recommended for dynamic data.
Note
It’s important to filter your table down to the distinct values you want. The ui.picker does not do this for you.
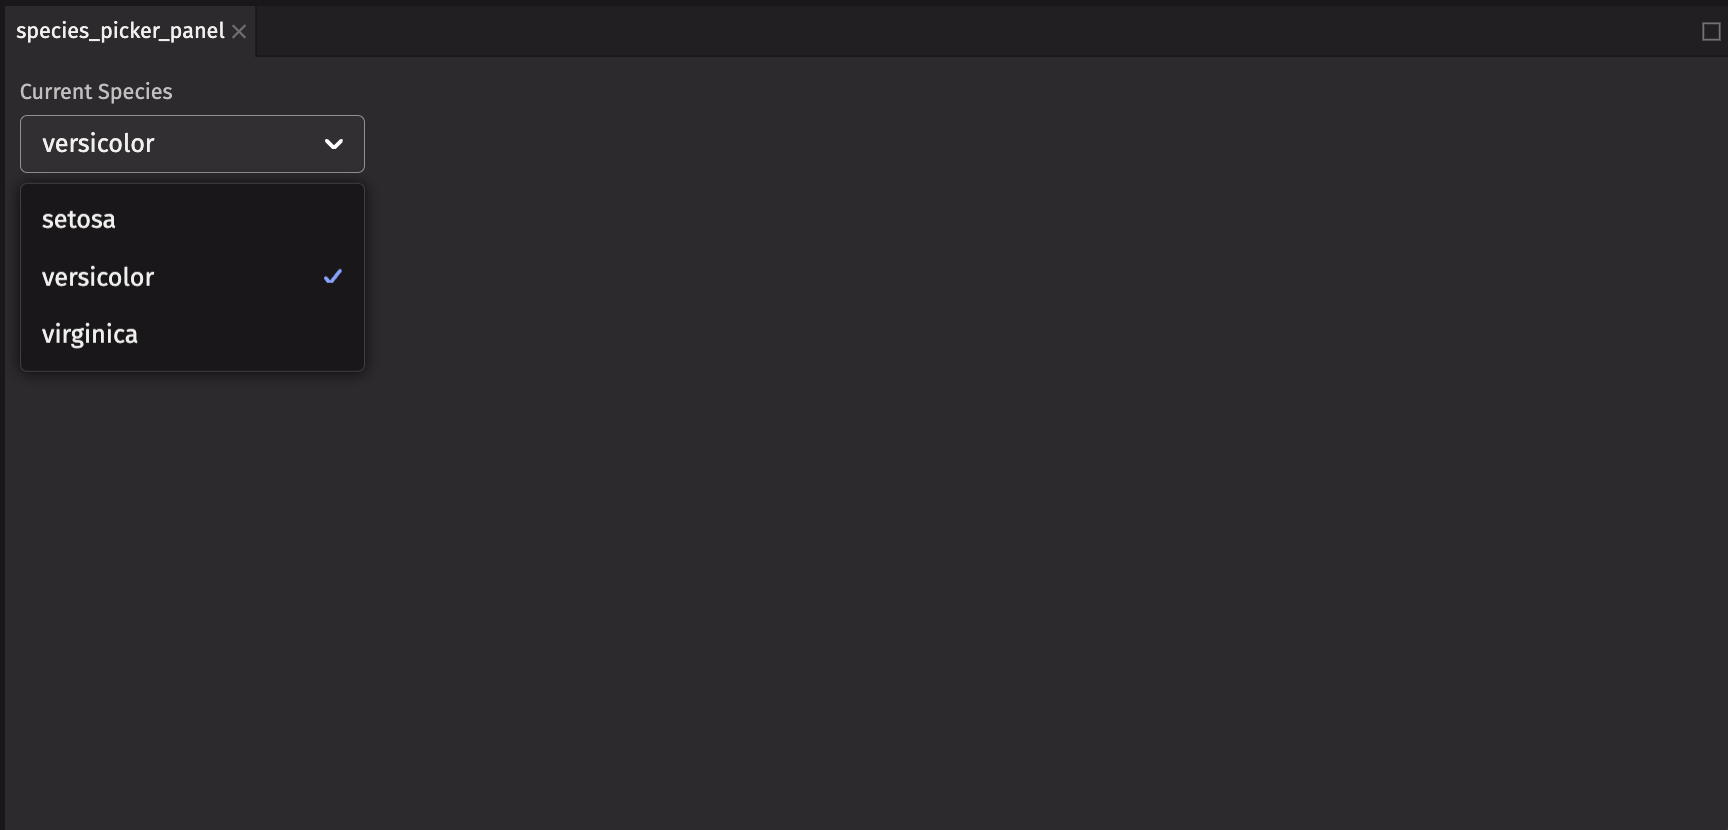
ui.use_state
The ui.use_state hook is how you’ll enable interactivity. The hook takes a starting value and returns a tuple of the current value and a function to set the value.
Next, modify your picker to take the species and set_species from the hook you just defined using on_change and selected_key. on_change is called whenever an option is selected. selected_key is the currently selected option. Using these makes the component controlled, meaning that the selected_key is controlled outside of the ui.picker itself. This allows you to use the selected_key in other ways such as filtering a table.
Warning
Hooks like ui.use_state are only available in components decorated with ui.component.
Additionally, hooks should not be called conditionally within a component. Create a new component if conditional rendering is needed.
Now, your picker is controlled by the rendering engine and updates as you pick values, and you have an up-to-date value from the table to filter on.
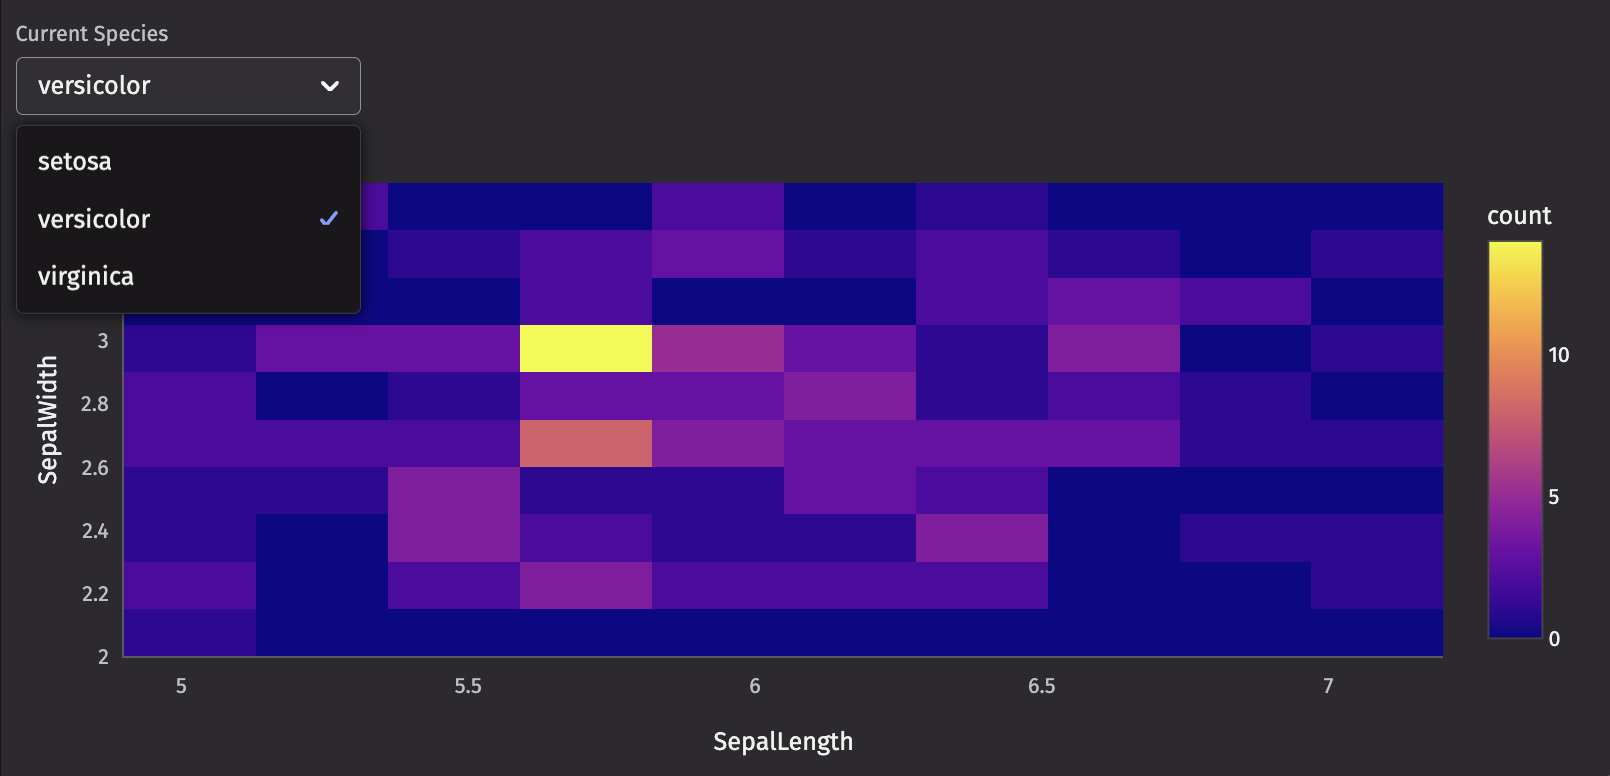
Utilizing State
Now, add a table filtered on this value and a chart that uses this filtered table. Return them with the picker.
You’ll create a dx.heatmap, which shows the joint density of SepalLength and SepalWidth (the variables of interest) filtered by Species.
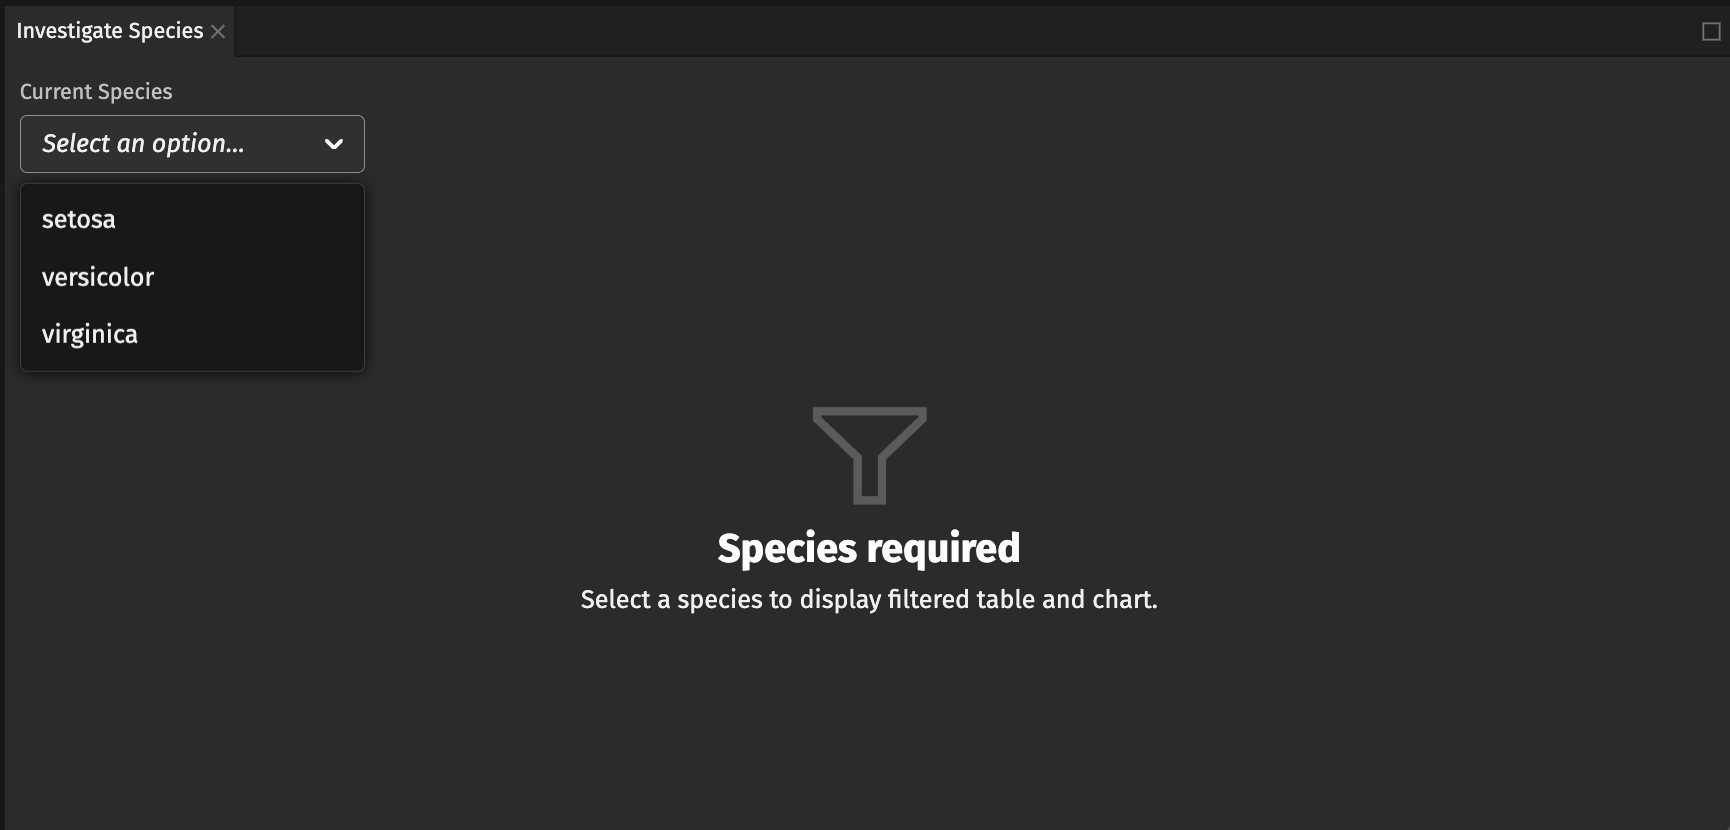
ui.illustrated_message
Currently, an empty table and chart appear if no species is selected. For a more user-friendly experience, add a ui.illustrated_message component to display instead if no species is selected.
Utilizing custom components
Next, embed your custom component in your dashboard.
The top row contains lots of empty space. Resize the height of the top row to 1 and the bottom row to 2 for a ratio of 1:2, so the bottom row is twice the height of the top row.
Dashboard state across panels
Currently, the ui.picker selects Species within a panel. You can change state across panels as well.
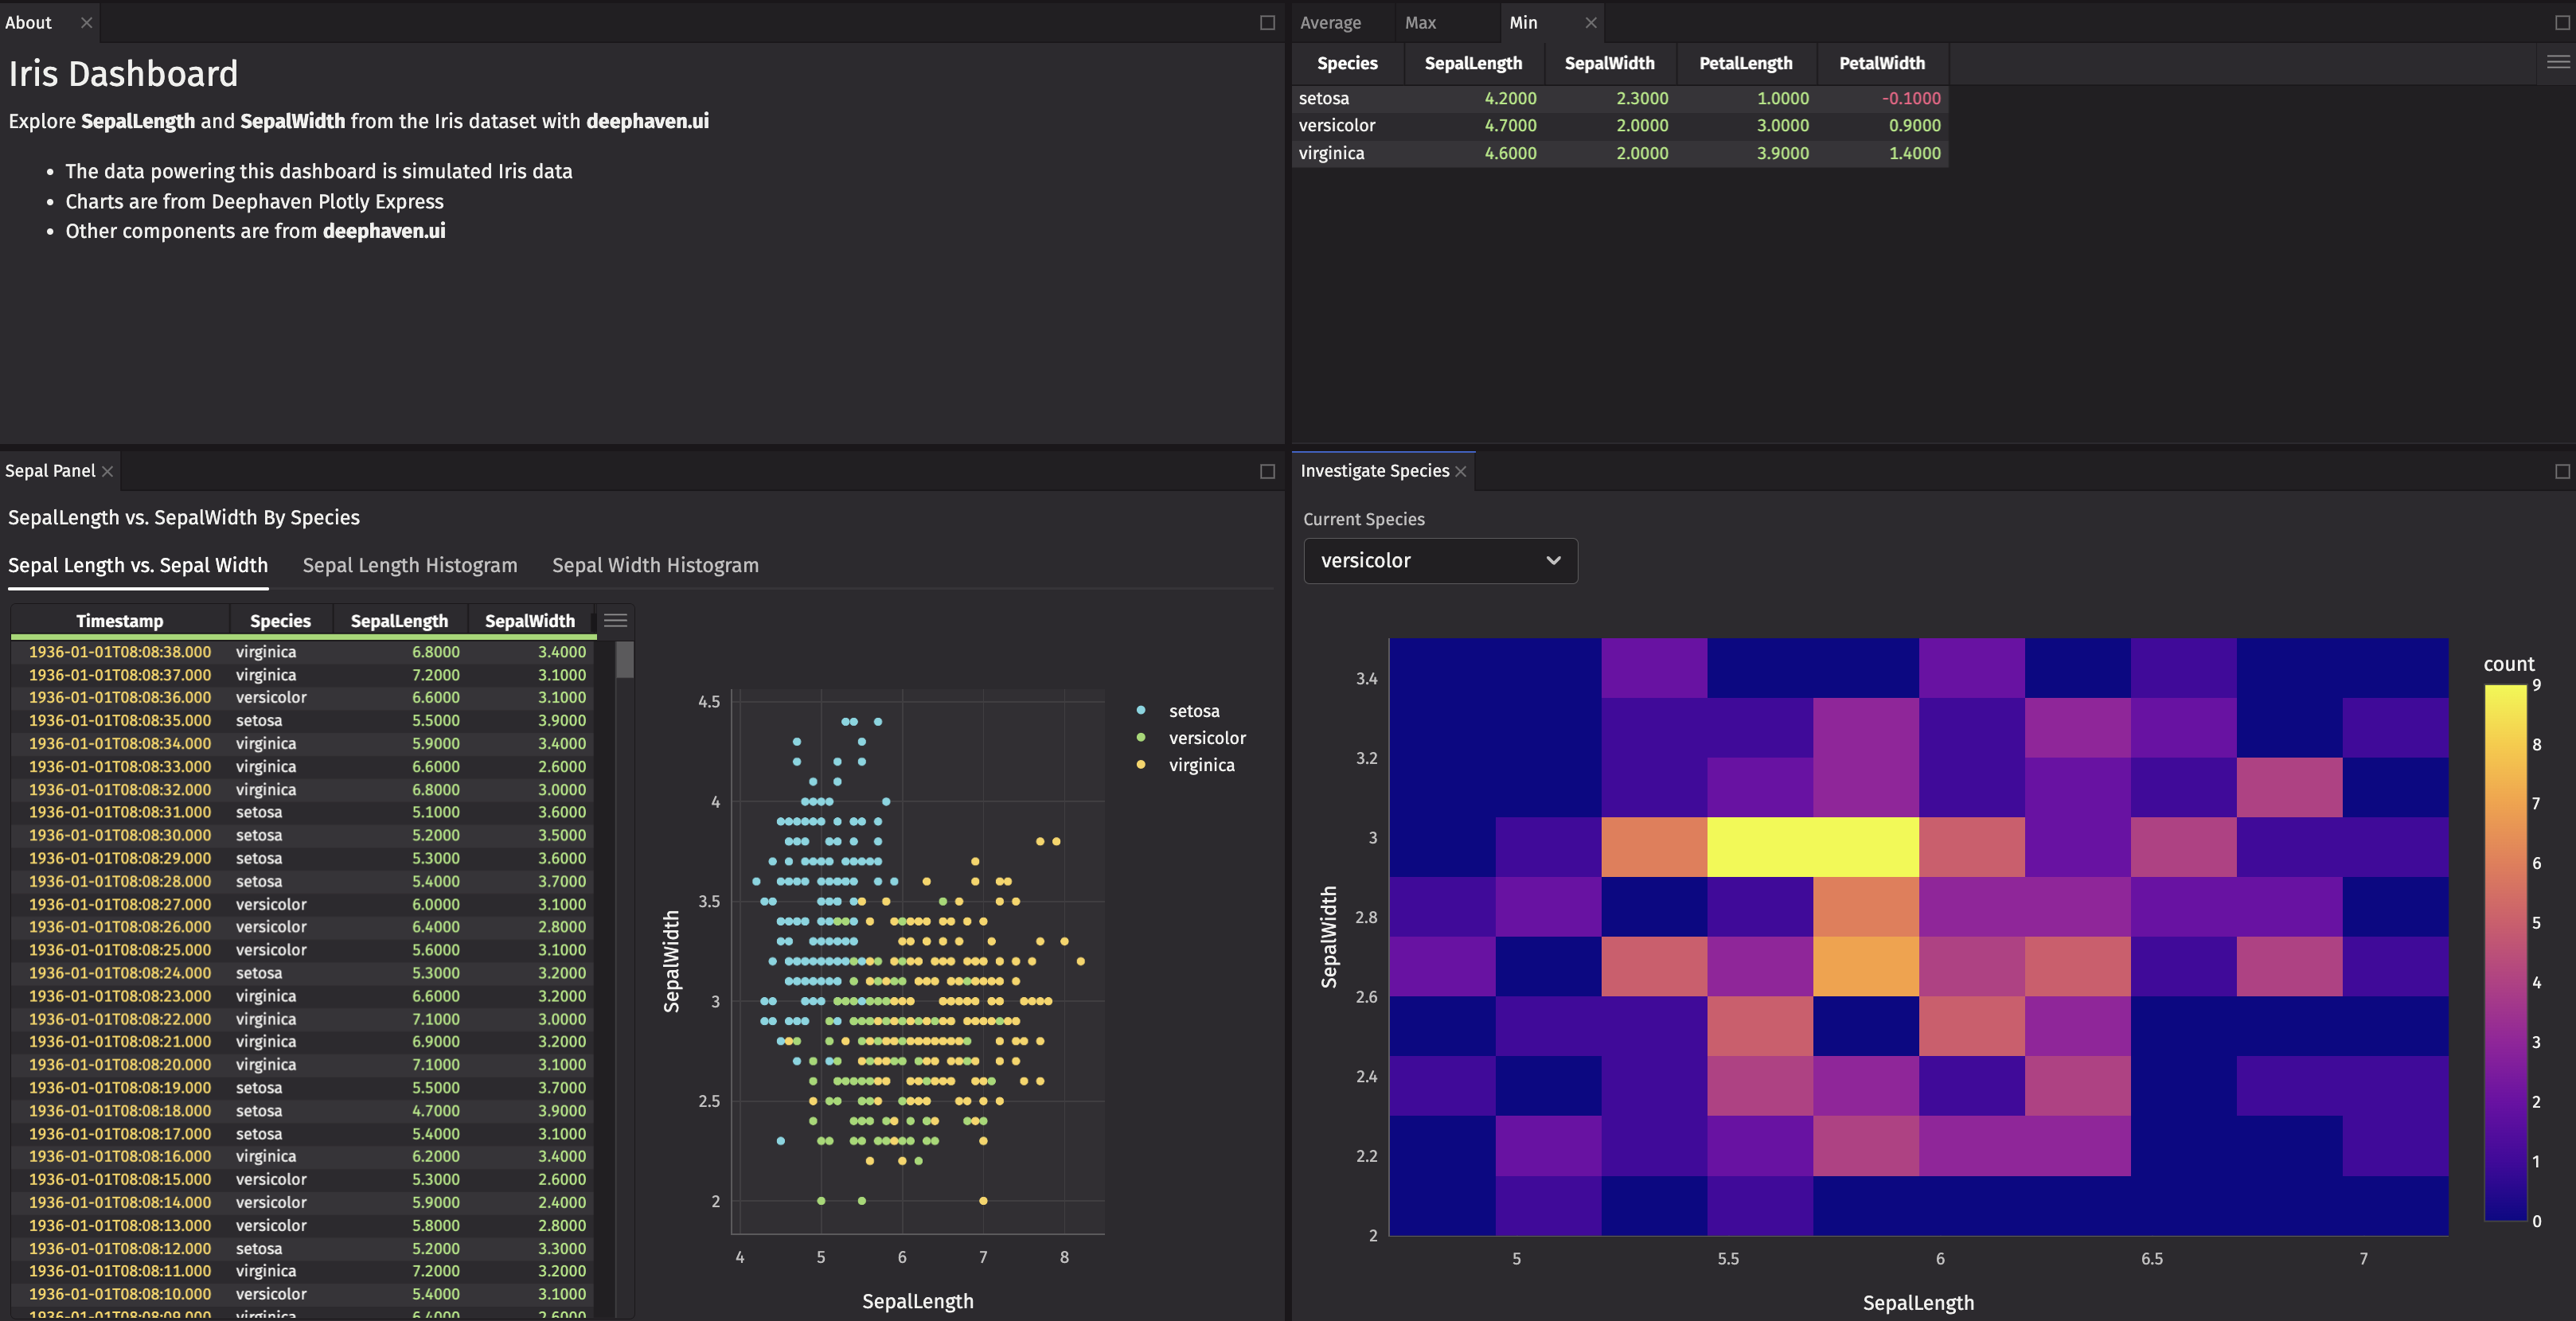
Recreate the sepal_flex_tabs panel within the create_sepal_panel function, which takes a set_species function as an argument. Now, we’ll add a ui.table event – these are useful if you see a row you want to investigate further.
- Add a listener (
on_row_double_press) to the table that is called when a row is double-clicked, returning the row data. This sets theSpeciesvalue displayed in theui.pickeranddx.density_heatmap. - Pull the
Speciesvalue from the row data and set it withset_species. - Then, create
sepal_panelwithcreate_sepal_panel, passingset_speciesto it.
ui.use_row_data and ui.badge
You’ve got a density heatmap that shows the density of SepalLength and SepalWidth by Species, but it’s tricky to see the min, max, and average overall values for SepalLength and SepalWidth for the selected Species. They’re in your table stack, but you can make them more prominent.
deephaven.ui provides hooks to access table data. Each hook provides access to a specific part of the table and is updated when the table changes.
The hooks are:
ui.use_cell_data- Accesses a single cell value.ui.use_row_data- Accesses a row of data.ui.use_row_list- Accesses a row as a list.ui.use_column_data- Accesses a column of data.ui.use_table_data- Accesses the entire table.
Warning
Filter your table to only the data you need the hook to pull out. The hooks do not filter the table for you.
Create a custom component that pulls the min, max, and average values for SepalLength and SepalWidth for the selected Species.
To display the values, wrap them in ui.badge components, which draw attention to specific values.
ui.use_memo
ui.use_memo allows you to cache expensive calculations so they are only recalculated when needed. It takes a function and a list of dependencies. If the dependencies change, the function is recalculated.
Since you’ve added badges to the dashboard, the dx.heatmap is recreated every time any of the badges change, but only needs to be recreated when the Species changes.
Heatmap is a fairly expensive chart to create (it requires a filtered table in this case) and changes rarely, so pull the heatmap creation into a separate function and use ui.use_memo to cache the heatmap creation.
Expand for final code
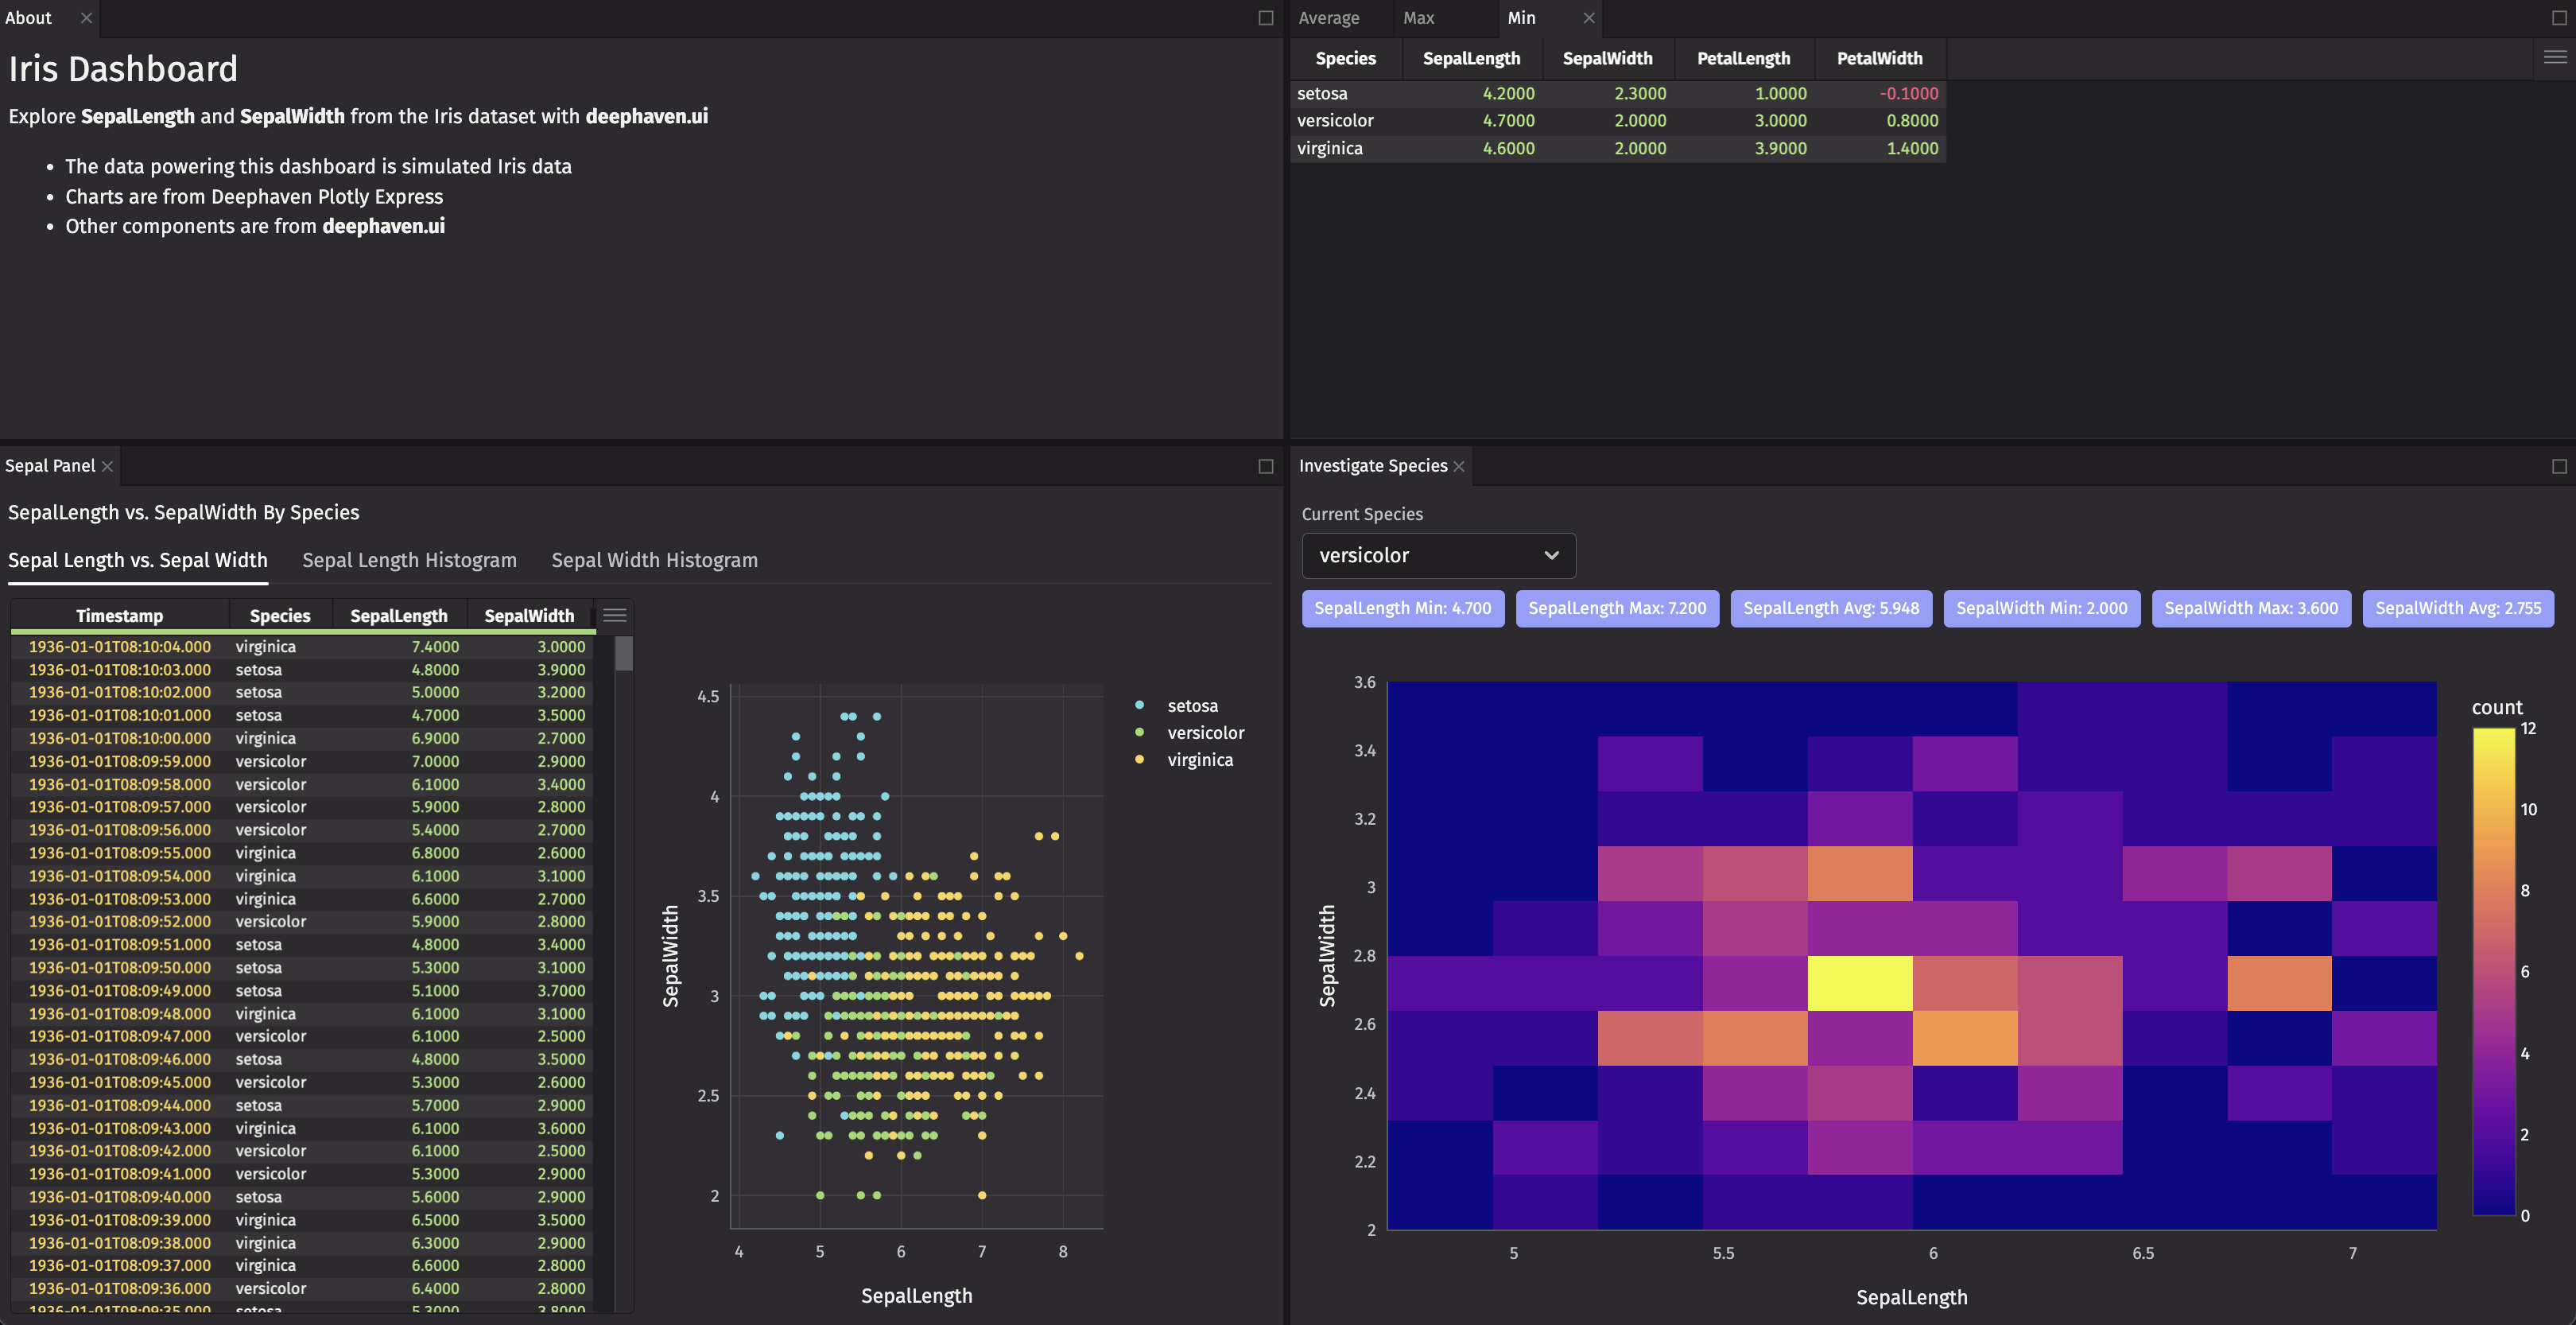
You’ve now completed this dashboard crash course with your custom component and interactivity.
Wrapping up
This wraps up the deephaven.ui dashboard crash course. In this course, you learned about the following components and concepts and created a dashboard with many of them: