User spotlight: Dylan Carter's AI model for analyzing Solana and Twitter
AP research supported by Deephaven
April 28 2022


We recently worked as an advisor to high school senior Dylan Carter as he completed his capstone project for AP Research, a college-level class that develops critical thinking and research skills.
Inspired by some of our example projects, Dylan wrote an AI model for analyzing Solana and Twitter sentiment. He used Deephaven to answer the questions, "What connection can be made between Solana price changes and Twitter data, and how can that connection be used to make short-term price predictions?" Given the accuracy of his model's results, Dylan concludes that by using similar predictions, investors can maximize potential profit or strategically enter/exit the market.
We're proud to be part of this project and to be making tools accessible to young data scientists entering the industry. We wish Dylan all the best as he continues his education in Computer Science at the University of Georgia this Fall.
With permission from Dylan and his AP instructor, his paper is shown in full below:
Solana Price Prediction Using Twitter Volume and Sentiment Analysis Data
Introduction
The historical transition to the digital world within the last decade has led to the profound growth of cryptocurrencies, or virtual currencies secured by cryptography. Cryptocurrencies such as Bitcoin, Ethereum, and Solana have experienced rapid value increases within the last few years. Some people view them as stores of value, while others view them as real currencies. Regardless, due to their volatile nature, many investors have been discouraged. Using Twitter metrics such as volume and sentiment can help investors take advantage of said volatility by making accurate price predictions of the cryptocurrency in focus: Solana (SOL).
Research Question and Hypothesis
This study’s research question is as follows: what connection can be made between Solana price changes and Twitter data, and how can that connection be used to make short-term price predictions?
This study examined whether the sentiment and volume of Solana-related tweets on Twitter would have a connection to fluctuations in Solana price. My hypothesis was that there would be a strong positive connection between them as previous research studies have found strong connections between Tweet sentiment/volume and people’s emotional state (Panger, 2017), public opinion in national polling (O’Connor et al., 2010), and Dow Jones Industrial Average (a major stock market index) price movements (Bollen et al., 2011). Due to these findings, I assumed that trends present on social media platforms would be reflective of value fluctuations of cryptocurrency investments.
Research Significance
Cryptocurrencies such as Solana have gathered notable momentum within the past year, leading to rises in their value and popularity. Although they have become intriguing choices for investors, their volatile nature has led to significant price swings. In order to take advantage of this volatility, it is important to look at the reasons why such changes occur. One way to measure this is to look at the tweet volume surrounding Solana on the social networking application known as Twitter. By analyzing tweet volume and sentiment, it should be easier to predict the corresponding volume and price action of Solana over time. More accurate predictions would, in turn, lead to more informed decision-making regarding the buying and selling of the cryptocurrency, as well as maximizing returns and profit.
Furthermore, as the world transitions towards carbon-neutrality and renewable energy, it’s important to recognize which networks provide the greatest efficiency and utility. Compared to its predecessors, Solana provides much greater efficiency as it offers exponentially greater network speeds at significantly lower energy/memory consumption. Previous research has been done on the relationship between Twitter and more popular cryptocurrencies such as Bitcoin, and Ethereum, but not Solana. Thus, research enabling investment in a greener network such as Solana could help lead to a more sustainable future for cryptocurrencies.
Literature Review
Before discussing the significance of Solana, addressing earlier cryptocurrencies Bitcoin and Ethereum is imperative.
Significance of Blockchain, Bitcoin, and Ethereum
According to IBM, a blockchain can be defined as a shared, immutable ledger that facilitates the process of recording transactions and tracking assets in a business network (IBM, n.d.). One of the key elements of blockchain is that it’s secured using cryptographic techniques. In essence, a fixed input, or message, is run through an algorithm where it’s mapped onto a fairly arbitrary output that can only be decrypted by the receiver. Various methods of cryptography are employed by different cryptocurrencies. For example, both Bitcoin and Solana utilize the cryptographic hash function SHA-256, while Ethereum uses Ethash. Cryptography ensures the security and trust needed to run such expansive networks of transactions.
Bitcoin’s anonymous creator, under the pseudonym Satoshi Nakomoto, developed a new system of processing transactions with blockchain as its fundamental attribute. Many suspect this was in response to the financial crisis in 2008 that was in part caused by overreliance on banks as intermediaries. Nakomoto generated Bitcoin as a solution where transactions are entirely peer to peer, removing the need of a centralized institution. This attribute has become one of the main utilities of cryptocurrencies, being that they are unable to be directly controlled by centralized entities, which can often detrimentally impact fiscal health.
Ethereum, another cryptocurrency, was created by co-founder Vitalik Buterin in 2013. Even though Ethereum has some similarities to Bitcoin, many of its technical attributes differ significantly. First, Bitcoin was created solely as a payment system, limiting the scope of its potential applications to mainly finance. Ethereum, however, has its own currency known as Ether (ETH) to fuel its smart contract platform and variety of decentralized applications (dApps). What makes this possible is that Ethereum has its own programming language built-in, meaning anyone can write smart contracts and decentralized applications so long as they have the ETH to fuel it (Ethereum, 2013).
As the world continues to adopt the various use-cases offered by different cryptocurrencies, it’s important to note which networks have the highest efficiency. In the following section, the problems associated with Bitcoin and Ethereum are explained.
Problems with Bitcoin and Ethereum
As previously mentioned, cryptocurrencies often differ in their network structure, a main component being the consensus mechanism. This aspect ensures that the nodes participating in the networks have identical copies of the data/transaction history. A profound issue with Ethereum and Bitcoin is that they use the consensus mechanism known as Proof of Work (PoW), which is characterized by slow transaction speeds and high energy consumption.
The Bitcoin network can only complete on average 5 transactions per second, while Visa processes nearly 1,700 transactions per second. Such low TPS would suggest Bitcoin isn’t a viable option for being the payment system of the future. Bitcoin also currently has a market capitalization of about $800 Billion, making it the largest cryptocurrency by a wide margin.
Although Bitcoin has beneficial use cases, its current energy consumption is unsustainable and harmful to the environment as demonstrated by the following statistics:
- Carbon footprint of 97.14 Megatonnes CO2 (comparable to the carbon footprint of Kuwait) (Digiconomist, 2022)
- Electricity usage of 204.5 TWh (comparable to the power consumption of Thailand) (Digiconomist, 2022)
- Electronic waste production of 32.44 kilotons (Comparable to the small IT equipment waste of the Netherlands) (Digiconomist, 2022)
As previously mentioned, Ethereum, like Bitcoin, utilizes the Proof of Work consensus mechanism, which is extremely inefficient in comparison to alternatives. Ethereum currently imposes significant environmental strain as well, using nearly 238 kWh per transaction (Statista, 2022). Ethereum's proof-of-work protocol currently has a total annualized power consumption approximately equal to that of Finland and carbon footprint similar to Switzerland (Ethereum, 2022). If a cryptocurrency is to have a net positive impact on the future of humanity, it must have high energy efficiency and be scalable enough for billions of people to use the network. Based on these statistics, neither Ethereum nor Bitcoin currently have this type of impact.
Significance of Solana
Solana was created with nearly identical intentions to that of Ethereum, having its own token (SOL) and payment system for fueling its network of dApps and smart contract platform. Where Solana intends to improve on, however, is changing many of its technological aspects to improve network efficiency and speed.
A major difference between Bitcoin/Ethereum and Solana is the size of their market caps. Bitcoin and Ethereum boast respective market caps of 330 billion, while Solana is comparatively much smaller at a market cap of nearly $38 billion. This is important to note as Solana is clearly much less well-established than the former two, but has greater upside potential in terms of investment and network adoption.
In addition to its smaller market share, the Solana network has a much more efficient network design. Unlike Bitcoin and Ethereum which use the Proof of Work consensus mechanism, Solana incorporates Proof of History (PoH) into its protocol along with Proof of Stake (PoS). PoH, rather, uses much less energy usage as it utilizes the nodes’ computing power to measure a verifiable passage of time, which reduces messaging overhead and the need for each node on the network to continuously update its list of transactions. Solana’s network design can be characterized as sequential, which differs significantly to that of Ethereum and Bitcoin where computing power is often squandered trying to piece together arbitrary transaction lists.
Due to these technological innovations, Solana boasts much faster network speeds than either of its predecessors with the capability of 65,000 transactions per second. In addition, its transaction fee is about 1.50 for Bitcoin and $40 for Ethereum. Having low transaction fees is important for a cryptocurrency to be utilized as a payment method as it encourages people to continue using the network over a competitor. Over time, transaction fees for Bitcoin and Ethereum will need to decrease significantly for them to remain relevant.
Crucially, Solana’s fast network speeds do not result in a tradeoff in efficiency. In fact, Solana has significantly lower energy usage than either Bitcoin or Ethereum. Only 0.00051 kWh are used per Solana transaction in comparison to 2,264 kWh per Bitcoin transaction and 238 kWh per Ethereum transaction. Furthermore, the entire Solana network uses on average only 0.011 TWh per year compared to the 204.5 TWh used by the Bitcoin network and nearly 100 TWh used by Ethereum (1 TWh = 1 billion kWh).
Based on the current environmental impact of the world’s two largest cryptocurrencies, Bitcoin and Ethereum, a more energy-efficient, sustainable network is needed. Looking at Solana’s significantly lower electricity usage and network efficiency, its adoption should be bolstered by those wary of current environmental conditions. Furthermore, the Solana Foundation announced that it achieved carbon neutrality for 2021, a monumental step for the future of sustainable energy usage of cryptocurrencies (Solana, 2021).
Importance of Twitter
Twitter is a popular social media platform that enables users to post brief messages known as tweets and interact with one another. Due to its brief nature, a tweet reflects short-term attitudes and opinions of its users well. Moreover, a paper about Bitcoin asserts Twitter is increasingly used as a news source influencing purchase decisions by informing users of Bitcoin and its increasing popularity (Abraham et al., 2018). Due to its strong internet presence, Twitter could also be a popular source for users to help make investing decisions regarding Solana. This corresponds to the way that trends observable on social media platforms can connect to the volatility of not just Solana, but all types of investments.
Related Work
A variety of research has previously been done on how well Twitter reflects the attitudes and opinions of the users posting tweets. A paper by Galen Thomas Panger discovered that sentiment on Twitter correlated with people’s general emotional state (Panger, 2017). Due to Solana’s immense digital presence on Twitter, experiencing the overall sentiment of the community could alter their own short-term perception of the cryptocurrency. Another paper by O’Connor et al. asserts sentiment of tweets reflected the public opinion of various topics in national polling (O’Connor et al, 2010). This demonstrates that Twitter is an accurate reflection of public opinion on topical issues.
A paper by Bollen et al. researched how Twitter data could be used to predict volatility in specifically the stock market (Bollen et al, 2011). To do so, they utilized a neural network to predict price changes in the Dow Jones Industrial Average with Twitter sentiment as the input. The study achieved 86.7% accuracy in doing so, demonstrating that it’s possible to use Twitter sentiment as a predictor of future price changes in investments.
One of the most comprehensive papers found looked at the relationship between Twitter data and Bitcoin price changes. The authors of the paper, Abraham et al., developed an accurate linear regression model and found strong correlation between Tweet volume and Bitcoin price changes with a Pearson R value of 0.841. Moreover, the authors found that tweet volume was a more accurate predictor of future prices as sentiment remained positive regardless of the change in value of the cryptocurrency (Abraham et al, 2018). In my research, I determine whether sentiment is constant with Solana as well.
In a 2020 study published by CoinTelegraph, Vidal determined that correlation between number of tweets and Bitcoin price often differentiated between years and market trends (Vidal, 2020). Because the correlation coefficient was only significant over certain courses of time, Vidal suggested that social metrics such as tweets should only be used to complement investment strategies. Due to this research, it is imperative that I assess the limitations of my paper in later sections.
Method
This study was conducted using the Twitter developer program, Deephaven IDE, bitinfocharts, a Pearson R-Value calculator, and a multivariable correlation calculator. The Twitter developer program enables access to the Twitter API, which allows researchers to tap into different kinds of Twitter data. The Deephaven IDE was used to run the Python algorithms for sentiment analysis and price prediction. Bitinfocharts was used to collect daily tweet volume surrounding Solana. Lastly, each correlation calculator was used to find the correlation between independent variables tweet sentiment and volume and dependent variable price changes.
Collection of Tweets from Twitter’s API
Note
Free access to the Twitter API is no longer available. However, the code and concepts in this blog are still valid for users with a paid developer account.
First, I collected the tweets I needed for sentiment analysis accessing Twitter’s API. This term is defined by IBM as a set of defined rules that explain how computers or applications communicate with one another (Education, I. C., 2021). To begin, I registered as a user in Twitter’s new developer platform. This enables users to gain access to specific Twitter data and abilities such as automating posts, pulling tweet data, etc. With this, I created a project for a Twitter bot that would collect tweets under my specified conditions.
Sentiment Analysis
The open-source code necessary for the sentiment analysis portion of this project was obtained from Deephaven’s website and approved by the owner themself, Dr. Amanda Martin. The code involved the downloading of several Python modules and packages, importation of keys and tokens from the Twitter project, cleaning, filters, and finally analysis.
According to Qualtrics, sentiment analysis can be defined as the process of determining the opinion, judgment , or emotion behind natural language (Qualtrics, 2021). This tool is applicable to my research as it can be used to find the opinion or emotion driving fluctuations in Solana price. The aim for this analysis is to analyze how changes in sentiment, whether positive or negative, connect with Solana price changes.
Next, tweets were “cleaned” for determining sentiment. Often, unnecessary characters or factors in a statement can distort the findings of the generator. The following aspects were removed from each tweet by pre-processing packages: URLs, tenses, exclamation or question marks, and capitalizations. This process made the sentiment score more accurate and less biased. The specific type of sentiment analysis used is known as VADER analysis (Valence Aware Dictionary for Sentiment Reasoning). This was used as words and scores used in this protocol are designed specifically for social media and microblogging platforms. The score ranges from 0 to 1 depending on the strength of sentiment. For example, a negative sentiment value of 0.001 would be slightly negative while a value of 0.9 would be extremely negative.
The collection of sentiment analysis data took place over 16 days spanning from 2/11/22 to 2/26/22. The sentiment analysis bot was run several times throughout the time period with the search term being “Solana”. The bot collected other scores such as polarity scores and an average compound value, but were ultimately excluded due to the complexity of the math that would have to be explained within this paper. As a result, the average positive and average negative scores were collected for each day instead. These values reflect the average of positive/negative scores from tweets collected throughout each day.
The chart below from dates 2/16-2/20 is an example of how the bot displayed the data. It includes the time each day, but putting the cursor over the beginning of the day gives a condensed daily value.
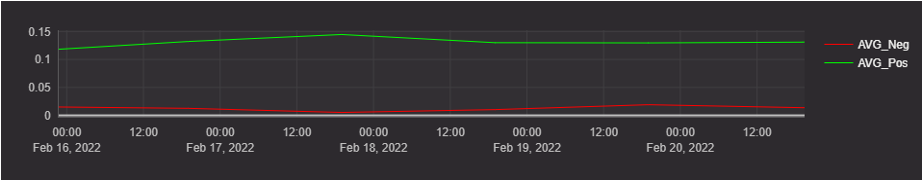
Fig. 1. Date and time (x-axis), Average Negative (red line, y-axis), Average Positive (green line, y-axis). Chart generated from Deephaven IDE.
Collecting Tweet Volume
Tweet volume can be defined as simply the number of tweets on a given day. Although Twitter’s API is useful for collecting a representative sample for sentiment analysis, they limit the total number of tweets that can be collected. Thus, it would not provide fully accurate data for tweet volume on a specific day. However, the site bitinfocharts.com provides the total number of tweets surrounding a cryptocurrency for each day dating back to 2014. Therefore, I determined this would be the best source for collecting the overall tweet volume for this study. Daily Solana tweet volume was collected from 2/01/22 to 3/03/22. In combination with tweet sentiment, volume was considered as it indicates the overall attention Solana may receive over a specific period of time.
Linear Regression & Standard Deviation
After collecting tweet sentiment data for the 16-day time period and tweet volume for the 31-day time period, multiple linear regression models were made demonstrating trends over time and relationship to the price of Solana. Two graphs were included for each relationship to demonstrate trends in each area. Each graph was created in Google Sheets using the data collected over the specified time periods.
The measure used to determine how well the data points fit the line of best fit is known as the r squared value. This explains how the amount of variation of the dependent variable connects to the variation of the independent variable. Since this study looks at how sentiment/volume may reflect price changes, they were used as the independent variable with prices as the dependent variable. In addition to the linear regression graphs, the mean of the data sets and standard deviation was calculated. This was done to help explain and confirm the data displayed by the linear regression graph, as both analyze the differentiation of data points from the average/line of best fit.
Determining Correlation
Although linear regression is effective for observing overall connection/trends between variables and predictions, correlation provides a greater understanding as to the strength of the relationship.A correlation coefficient (r-value) indicates the level of strength of a relationship between multiple variables with -1 signifying a negative relationship, 0 signifying no correlation, and 1 signifying positive correlation. Correlation was used in addition to linear regression as linear regression classifies variables as independent/dependent, while correlation views them only as variables. It’s also useful in confirming the type of relationship exemplified by the linear regression models.
Price Prediction
Based on the analysis of linear regression and correlation data, a prediction on the future Solana price was made. As my research looks at the ability to make short-term predictions, I simply deduced whether the Solana price 12 days from the final day of data collection would be greater or less than the price at the beginning of the 12 days.
Linear Regression
This section explores the data collected for sentiment analysis, volume, and price. In addition, linear regression models, correlation, and other relevant statistics were calculated for each data set. Both positive and negative tweet sentiment are connected to Solana prices in this section of data analysis. Values for sentiment were rounded to the nearest ten-thousandth while price values were rounded to the nearest cent.
Sentiment Analysis
The mean for daily positive sentiment was 0.1416, while the mean for average daily price was 5.95. From this data, we can deduce that positive sentiment had less connection to the mean than changes in Solana price throughout the time period. This point is furthered by the linear regression graph pictured below. As displayed, positive sentiment for Solana tweets trended upwards over the period of 16 days, while Solana price trended downward. Moreover, the r squared value for positive sentiment was 0.199, while the r squared value for Solana price was 0.588. This point indicates that Solana prices are fairly easier to follow based on trends in the mean compared to positive sentiment.
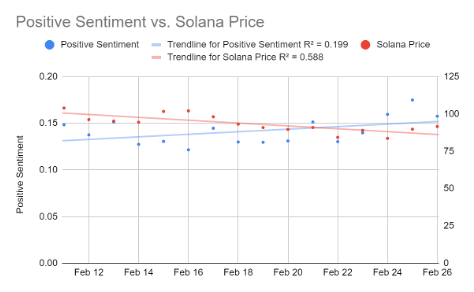
Fig. 2. Date (x-axis), Solana Price (red line, right y-axis), Positive Sentiment (blue line, left y-axis). Chart created in Microsoft Excel.
The below chart displays a linear regression graph without dates and is used more to compare the relationship distinctly between price and positive sentiment rather than over time. As shown, there’s a weak negative relationship between the variables as Solana price slightly decreases along the trend line as the average positive value increases. The r squared value for this trend line was only 0.073, reflecting a weak relationship between Solana price and positive sentiment. Based on this finding, it’s recommended that price prediction models refrain from utilizing changes in positive sentiment as a central variable.
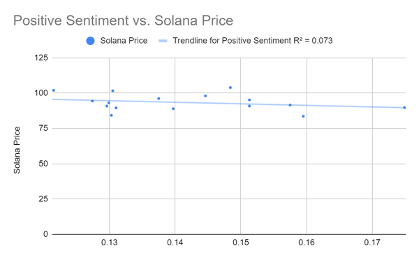
Fig. 3. Positive Sentiment (x-axis), Solana Price (y-axis). Chart created in Microsoft Excel.
Moving on, the mean for the negative sentiment data was 0.0154, while the mean for price was 5.95. Based on this, price continued to have a greater connection to the mean than any sentiment value when sorted by date. This can be explained further by the linear regression graph pictured below.
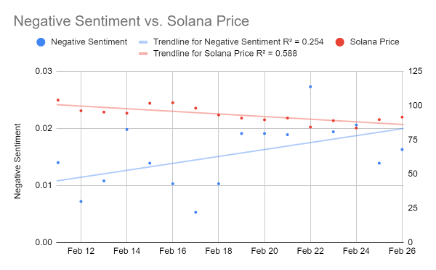
Fig. 4. Date (x-axis), Solana Price (red line, right y-axis), Negative Sentiment (blue line, left y-axis). Chart created in Microsoft Excel.
It can be seen that Solana price trended downwards while negative sentiment trended upwards. In addition, the r squared value for negative sentiment was 0.254, while the r squared value for Solana price was again 0.588. This reinforces the idea that prices have a stronger connection to the line of best fit over time. However, the other linear regression graph below portrays a different idea than the one above.
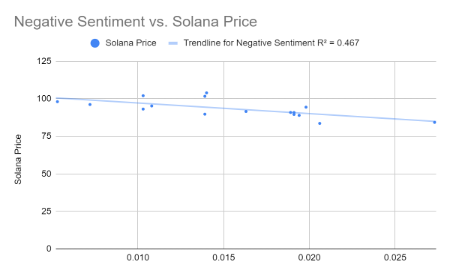
Fig. 5. Negative Sentiment (x-axis), Solana Price (y-axis). Chart created in Microsoft Excel.
The above graph looks at the relationship solely between Solana price and negative sentiment, establishing a more distinct relationship. Contrasting from the positive sentiment model, the r squared value for this data was 0.467, reflecting a much stronger relationship between average negative sentiment and Solana price changes. Based on these observations, Solana prices and negative sentiment have the strongest relationship to one another when analyzed from a linear regression perspective.
Volume
In this section, the relationship between Solana tweet volume and Solana prices are analyzed. Values for tweet volume were rounded to the nearest whole number while price values were rounded to the nearest cent. The mean for daily tweet volume in this data set was 64,870 tweets, while the mean for average daily price was 9.70. From these findings, it is deduced that from this time period, tweet volume had less connection to the mean than Solana price. The linear regression graph below displays the trendline of both tweet volume and price.
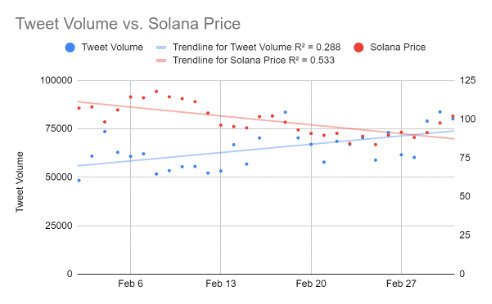
Fig. 6. Date (x-axis), Solana Price (red line, right y-axis), Tweet Volume (blue line, left y-axis). Chart created in Microsoft Excel.
Seen in the lines of best fit, Solana price again trended downward throughout the 31-day time period while tweet volume trended upward. The r squared value for tweet volume was 0.288 while the r squared value for price was 0.533. This point again indicates that Solana prices differentiate less from the line of best fit than the opposing variable. The final regression model pictured below looks at the relationship between price and volume as the only two variables.
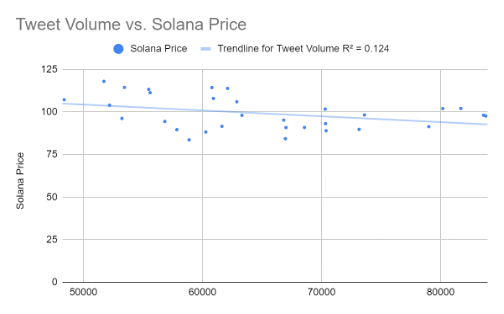
Fig. 7. Tweet Volume (x-axis), Solana Price (y-axis). Chart created in Microsoft Excel.
This line of best fit again trends downwards, indicating continued decreases in Solana prices as tweet volume rises. The r squared value for this relationship was 0.124. Although the connection in linear regression isn’t the strongest, this finding differs significantly from my hypothesis that there would be a strong positive connection between tweet volume and solana prices over time. Rather, there’s a moderate negative connection between them in that according to the scatter plot/linear regression line, when tweet volume increases, solana prices generally decrease.
Correlation
The following section explores the correlation between daily average positive/negative tweet sentiment and average daily price, as well as daily volume and average daily price.
Tweet Sentiment
Similar to the linear regression data, the correlation calculation reflected negative relationships between both sentiment classes and price changes. The correlation coefficient (r value) for positive sentiment and average price was -0.2708, indicating a weaker negative correlation between the two variables. Referring back to the r squared value of 0.073, the relationship between the two variables isn’t considered strong, but still reflects an observable inverse relationship.
On the other hand, the correlation coefficient for negative sentiment and average price was -0.6831, indicating a strong negative correlation. As the r squared value was 0.467 and r value being near 0.7, this relationship was clearly the most significant of those analyzed. Again, there’s an evident inverse relationship between negative sentiment and average daily price.
Tweet Volume
Lastly, the connection between daily tweet volume and average daily price is confirmed as the correlation coefficient of -0.3516 reflects a moderate negative correlation. Referring back to the r squared value of 0.124, the connection was somewhat weaker between these two variables. However, it does further accentuate the notion that there’s an inverse relationship between tweet sentiment/volume and daily solana price changes.
Application
As seen in the table below, the results of each section of the paper led to a negative price prediction for Solana in the short-term (12 days into the future). Although some varied in statistical strength, each suggested a reduced price in the near future.
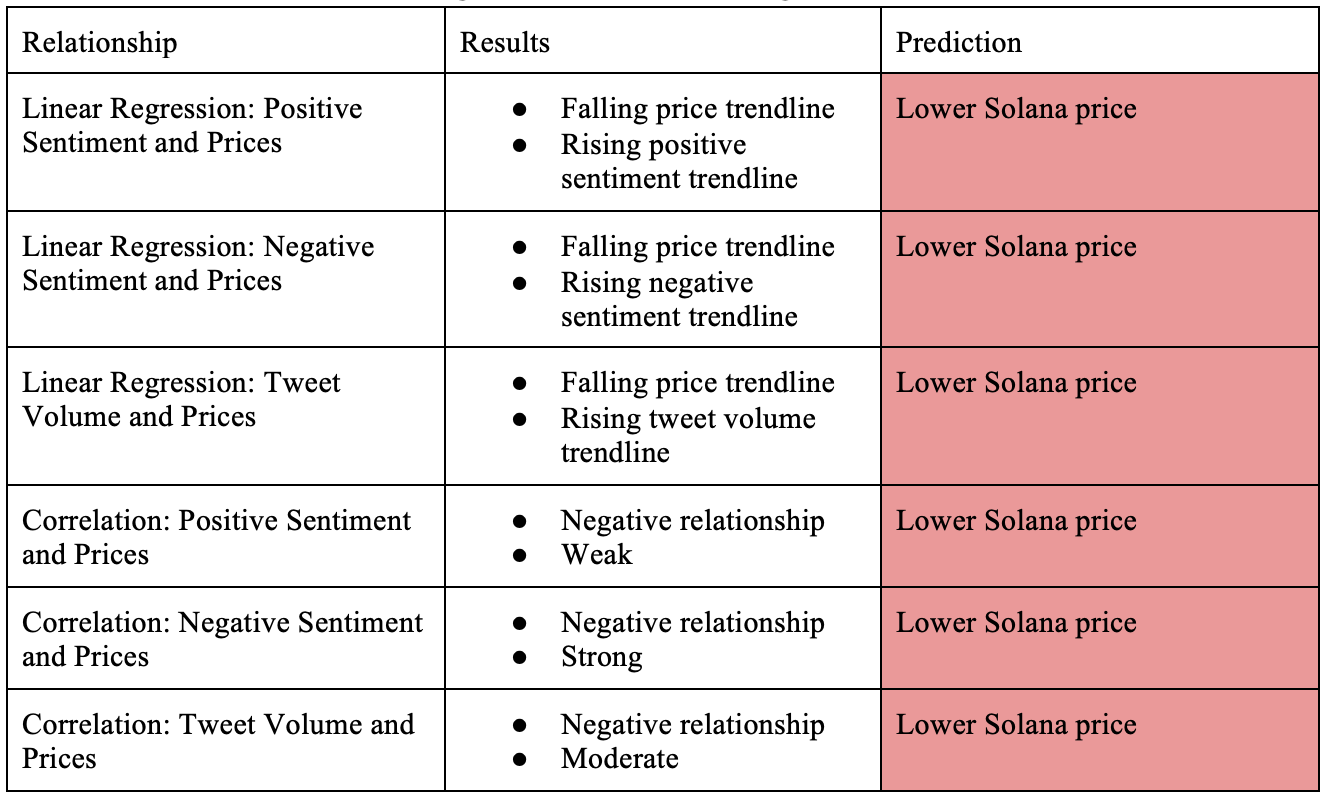
Fig. 8. Table created in Google Docs.
As the collection of tweet sentiment ended on February 27th, the changes in price from then to 12 days ahead on March 11th was observed and displayed in the graphs below. The price of Solana on 2/27 was 81.70. Based on these numbers and what can be observed in the graph below, the price of Solana continued to decrease following the end of data collection. Therefore, the sentiment-based prediction that the future price of Solana after 12 days would be lower than at the beginning of the time period was correct.
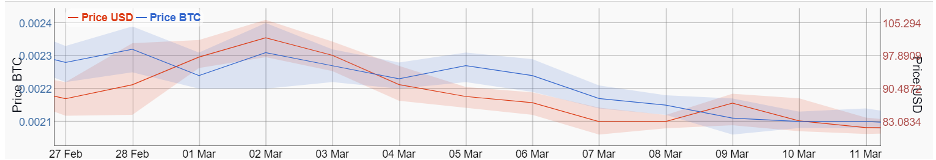
Fig. 9. Date (x-axis), Solana Price USD (red line, right y-axis), Solana Price BTC (blue line, left y-axis). Chart retrieved from bitinfocharts.
As the trendline for Solana price over the time period specific to tweet volume predicted future decreasing prices and a negative, although weaker relationship between tweet volume and Solana price was observed, it was predicted that the price of Solana would again be lower in the near future.
The collection of tweet volume ended on March 4th, the changes in price from then to 12 days ahead on March 16th was observed and displayed in the graph below. The price of Solana on 3/4 was 83.84. Based on these numbers and the trend observable in the graph, the price of Solana continued decreasing following the end of collecting volume data. Therefore, the prediction that the future price of Solana after 12 days would be lower than at the beginning based on volume data was also correct.
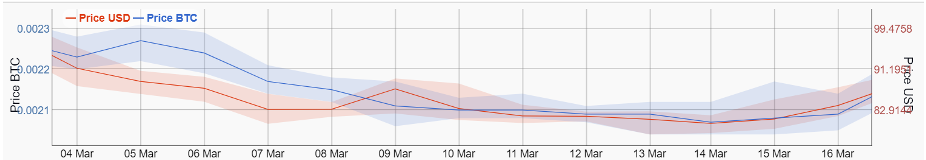
Fig. 10. Date (x-axis), Solana Price USD (red line, right y-axis), Solana Price BTC (blue line, left y-axis)
Ethics
As this study involved the collection of data made available by the microblogging service known as Twitter, it’s imperative that the ethics of data collection are addressed. First, as Twitter is a public social media platform, each tweet author acknowledges that their tweets may be viewed/judged by others following them or using the platform. Moreover, Twitter enables those registered with their developer program to access tweets with specific filters using their API. However, it is possible that many of these tweet authors did not intend on their opinions or statements to be collected/used in a research study. Therefore, it was decided that the personal information of these accounts would remain anonymous and would not play a part in data analysis. Additionally, the privacy of these accounts was protected as nothing other than the sentiment score of their tweets was recorded.
Limitations
With my method only taking place over 16 and 31 days, a significant correlation over that time period does not necessarily indicate that correlation will remain significant over other courses of time. Furthermore, if the correlation doesn’t remain intact, there is a strong chance that the price prediction model won’t be nearly as accurate as before. Another potential issue is price changes not being caused by changes in sentiment/attention and vice versa. In addition, there are many other complex factors influencing changes in price such as accumulation or dumping by crypto whales (holding large percentages of token), potential network outages, performance of other tokens, etc.
Another limitation is that the time periods for collection of volume and sentiment data were different due to difficulties with the sentiment analysis bot. In the future, it would be beneficial to use sentiment and volume data together to make price predictions. Even more importantly, there is no guarantee that Solana will remain relevant in the future as emerging crypto networks could possibly run more efficiently and have greater network speeds/scalability. Price prediction methods such as this should only be used for the short-term and complement investor conviction.
Conclusions, Implications, & Future Work
Using linear regression models and correlation data in analyzing the connection between variables tweet sentiment/volume and Solana prices, accurate near-term price predictions were made. As each linear regression graph suggested a downward trend in Solana prices and correlation data reflected a moderate to strong negative relationship, a continued decrease in price was accurately predicted following the end of data collection.
This fact indicates that investors potentially may be able to predict the future price changes in Solana using tweet volume and sentiment. This will allow them to buy coins at a cheaper price and sell them at a higher price if predictions are accurate, maximizing potential profits or allowing them to enter/exit positions at more beneficial levels.
More importantly, due to the significant r and r squared values for the relationship between negative sentiment and prices, it’s recommended that future research studies on this area incorporate that as a central variable in the price prediction process. More extensive collection of data points would improve upon the reliability and ultimately accuracy of price predictions.
With the results of this research study, there are several areas that future studies can improve upon and address in a more thorough manner. The first area that could be improved is the time period/number of daily time bins used in the Twitter bot. As this study incorporated a limited amount of time bins/day, future work could be more specific and utilize a greater amount of time bins to collect a greater total of tweets. In addition, the sentiment/volume data collected in this study only took place over the course of 16 and 31 days. Future studies could improve upon this by comparing the sentiment and volume across different trends in price changes. For example, it would be beneficial to look at how sentiment changes across time periods where price declines are prolonged compared to the sentiment changes in time periods where price continuously increases. This would provide more insight into how crypto communities may remain loyal to a specific cryptocurrency or if a lack of conviction causes them to liquidate their position. It is also recommended that future studies improve upon the complexity of variables and incorporate elements such as tweet polarity and neutrality.
Works Cited
-
Abraham, J. A., Higdon, D. H., Nelson, J. N., & Ibarra, J. I. (2018). Cryptocurrency Price Prediction Using Tweet Volumes and Sentiment Analysis. Scholar.Smu.Edu. Retrieved October 25, 2021, from https://scholar.smu.edu/cgi/viewcontent.cgi?article=1039&context=datasciencereview
-
Bitcoin Definition: How Does Bitcoin Work? (2021, October 17). Investopedia. Retrieved October 25, 2021, from https://www.investopedia.com/terms/b/bitcoin.asp
-
Cryptocurrency. (2021, August 10). Investopedia. Retrieved October 25, 2021, from https://www.investopedia.com/terms/c/cryptocurrency.asp
-
Nakamoto, S. N. (2008, October 31). Bitcoin: A Peer-to-Peer Electronic Cash System. https://bitcoin.org/. Retrieved October 25, 2021, from https://bitcoin.org/en/
-
Vidal, T. (2020, February 23). How Traders Can Use Twitter to Anticipate Bitcoin Price Moves, Volume. Cointelegraph. Retrieved October 25, 2021, from https://cointelegraph.com/ (Post no longer available on website)
-
Bollen, Johan, Huina Mao, and Xiaojun Zeng. "Twitter mood predicts the stock market." Journal of Computational Science 2.1 (2011): 1-8.
-
O’Connor, B., Balasubramanyan, R., Routledge, B.R., Smith, N.A.: From tweets to polls: Linking text sentiment to public opinion time series. In: Proceedings of the Fourth International AAAI Conference on WEblogs and Social Media. (2010)
-
Panger, G.T.: Emotion in Social Media. PhD thesis, University of California, Berkeley (2017)
-
Martin, A. M. (2022, January 11). Take Twitter’s temperature with Deephaven: a sentiment analysis tutorial. Deephaven. Retrieved January 18, 2022, from https://deephaven.io/blog/2022/01/11/twitter-sentiment/
-
Sentiment Analysis: Definition & Best Practices //. (2021, October 25). Qualtrics. Retrieved December 13, 2021, from https://www.qualtrics.com/experience-management/research/sentiment-analysis/
-
Anatoly Yakovenko (2019). Solana: A new architecture for a high performance blockchain [White paper]. Solana. Retrieved January 18, 2022 from https://solana.com/solana-whitepaper.pdf
-
BitInfoCharts. (n.d.). Solana Tweets Chart. Retrieved January 19, 2022, from https://bitinfocharts.com/comparison/solana-tweets.html
-
Ethereum. (2013). Ethereum Whitepaper. Ethereum.Org. Retrieved January 19, 2022, from https://ethereum.org/en/whitepaper
-
Bitcoin Energy Consumption Index. (2022, January 17). Digiconomist. Retrieved January 20, 2022, from https://digiconomist.net/ (Post no longer available on website)
-
Ethereum. (2022, January 7). Ethereum Energy Consumption. Ethereum.Org. Retrieved January 20, 2022, from https://ethereum.org/en/energy-consumption/
-
Smith, J. S. A. (2021, December 24). Solana’s Energy Use Report: November 2021. Solana | News. Retrieved January 20, 2022, from https://solana.com/news/solana-energy-usage-report-november-2021
-
IBM. (n.d.). What is Blockchain Technology? - IBM Blockchain | IBM. IBM Topics. Retrieved January 28, 2022, from https://www.ibm.com/topics/what-is-blockchain
-
Statista. (2022, January 10). Energy consumption of Ethereum (ETH) and VISA transaction as of January 10, 2022. Retrieved January 28, 2022, from https://www.statista.com/statistics/1265891/ethereum-energy-consumption-transaction-comparison-visa/
-
Statista. (2022a, January 10). Energy consumption of a Bitcoin (BTC, BTH) and VISA transaction as of January 2022. Retrieved January 28, 2022, from https://www.statista.com/statistics/881541/bitcoin-energy-consumption-transaction-comparison-visa/
-
Education, I. C. (2021, October 15). Application Programming Interface (API). IBM Cloud Learn Hub. Retrieved March 30, 2022, from https://www.ibm.com/cloud/learn/api