
Easily analyze real-time financial data like a pro

· 5 min read
DALL·E prompt: bitcoins on a keyboard, with a floating ohlc chart hologram UI in the background, shallow depth of field
Joshua Hilgartner
Intern day 4: Real-time data

For those of you who haven't been following my blog series, I am an intern at Deephaven, working on a project to learn Deephaven's software. I've now reached my goal of analyzing data in real time. In my last post, I used Deephaven to complete an analysis of MicroStrategy's $205 million Bitcoin-backed loan. While the prediction was good, the data I used was static and couldn't update as the trading day progresses.

To level up my analysis, I used Deephaven's powerful Interactive Brokers plugin to access and analyze real-time financial data in the Deephaven framework I've become comfortable with. Working with Deephaven-IB to get real-time data ended up being easy and straightforward - you don't need to be an expert or have prior experience to figure it out. In addition, I was able to see just how powerful Deephaven is when working with real-time data. I didn't have to learn anything new because Deephaven's table operations are the same on static and real-time data.

This is just the first of many real-time data projects. I feel confident enough in my abilities to take on any project with Deephaven. Plus, learning to use Deephaven-IB has opened up many opportunities to access real-time financial data.

Quick access to real-time financial data

Like all of my other projects, I first had to start with getting my data. To set up Deephaven-IB to access real-time data, I followed their tutorial on Github. Once I set up the Interactive Brokers Trader Workstation, I was ready to connect to the client.

#Connect to the IB API client
API_PORT = 7497

import deephaven_ib as dhib
client = dhib.IbSessionTws(host="host.docker.internal", port=API_PORT, read_only=False)
client.connect()

if client.is_connected():
print('Client connected!')
else:
raise RuntimeError("Client not connected!")

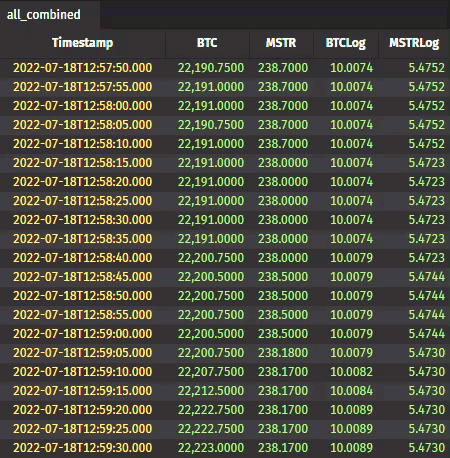
Next, I needed data for Microstrategy and Bitcoin. Their tutorial and reference documentation show how to request all the data I wanted. I used both historical and real-time data, combined them, and made an accurate prediction. The real-time data allowed me to update the prediction as more became available.

#Get market data for MSTR and BTC, both realtime and historical
from ibapi.contract import Contract

c = Contract()
c.symbol = 'MSTR'
c.secType = 'STK'
c.exchange = 'SMART'
c.currency = 'USD'

rc = client.get_registered_contract(c)
client.request_bars_historical(
rc,
duration=dhib.Duration.days(253),
bar_size=dhib.BarSize.DAY_1,
bar_type=dhib.BarDataType.TRADES
)
client.request_bars_realtime(rc, bar_type=dhib.BarDataType.TRADES)

c = Contract()
c.symbol = 'BTC'
c.secType = 'CRYPTO'
c.exchange = 'PAXOS'
c.currency = 'USD'

rc = client.get_registered_contract(c)
client.request_bars_historical(
rc,
duration=dhib.Duration.days(253),
bar_size=dhib.BarSize.DAY_1,
bar_type=dhib.BarDataType.AGGTRADES,
keep_up_to_date = False
)
client.request_bars_realtime(rc, bar_type=dhib.BarDataType.TRADES)

Once I have what I need, Deephaven makes merging historical and real-time data seamless.

#Get desired data and combine into tables
from deephaven import merge

bars_hist = client.tables["bars_historical"]
bars_btc_hist = bars_hist.where("Symbol=`BTC`")
bars_mstr_hist = bars_hist.where("Symbol=`MSTR`")

bars_realtime = client.tables['bars_realtime']
bars_btc_rt = bars_realtime.where("Symbol=`BTC`")
bars_mstr_rt = bars_realtime.where("Symbol=`MSTR`")

realtime_combined = bars_btc.view(["Timestamp","BTC = Close"])\
.natural_join(bars_mstr, on="Timestamp", joins="MSTR = Close")\
.where(filters=["!isNull(MSTR)","!isNull(BTC)"])\
.update(formulas=["BTCLog = log(BTC)", "MSTRLog = log(MSTR)"])

hist_combined = bars_btc_hist.view(["Timestamp","BTC = Close"])\
.natural_join(bars_mstr_hist, on="Timestamp", joins="MSTR = Close")\
.where(filters=["!isNull(MSTR)", "!isNull(BTC)"])\
.update(formulas=["BTCLog = log(BTC)", "MSTRLog = log(MSTR)"])

all_combined = merge([hist_combined, realtime_combined])

Crypto Data

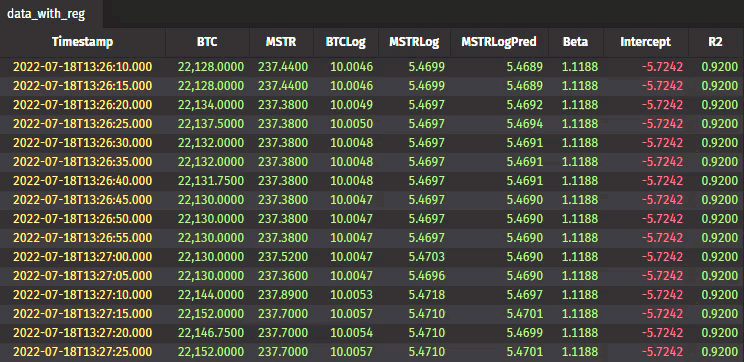
All that was left was to apply a linear regression model. To test to see if Deephaven truly could handle real-time and static data the same, I copied the exact code from my linear regression blog post and placed it into my project. It worked!

import numpy as np
import numpy.polynomial.polynomial as poly

#Calculate linear regression
def calc_reg(x,y):
x = np.array(x)
y = np.array(y)
reg, stats = poly.polyfit(x,y, 1, full=True)
m = reg[1]
c = reg[0]

SSR = stats[0][0]
diff = y - y.mean()
square_diff = diff ** 2
SST = square_diff.sum()
R2 = 1- SSR/SST

return (m, c, R2)

get_val = lambda rst, i: rst[i]

data_with_reg = all_combined\
.group_by()\
.update(formulas=["Reg = calc_reg(array(BTCLog), array(MSTRLog))", "Beta = (double) get_val(Reg,0)", "Intercept = (double) get_val(Reg,1)", "R2 = (double) get_val(Reg,2)"])\
.drop_columns(cols=["Reg"])\
.ungroup()\
.update("MSTRLogPred = Beta * BTCLog + Intercept")\
.move_columns(idx = 5, cols = "MSTRLogPred")

Crypto with regression data

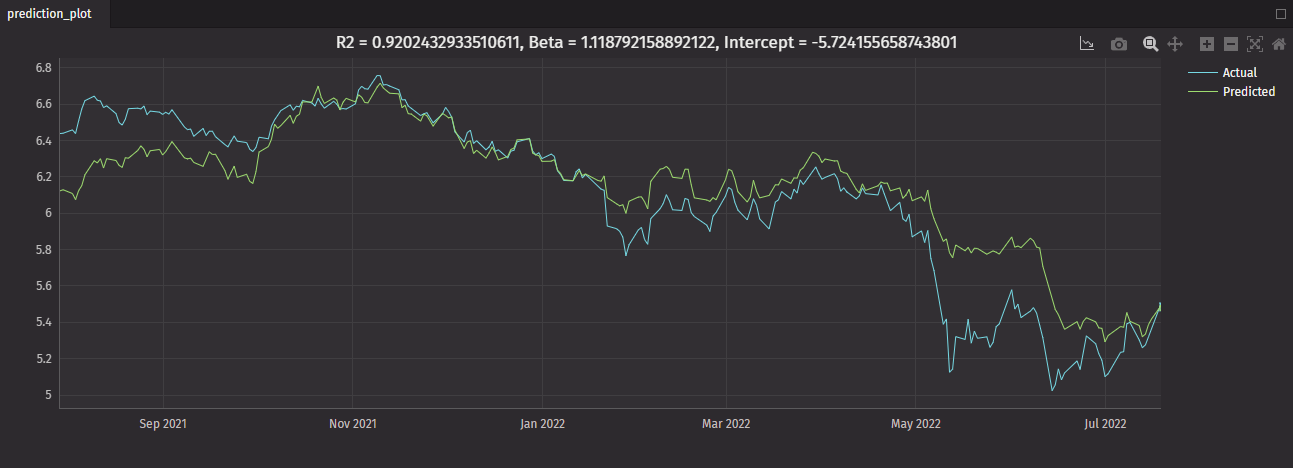
All that was left was to create a graph. Yet again, I copied the code from my previous project and had a graph made in a minute.

from deephaven.plot.figure import Figure
from deephaven.plot import PlotStyle, Colors, Shape
from deephaven.pandas import to_pandas

#Create pandas dataframes to display regression values as chart title
reg_info = to_pandas(data_with_reg.first_by())

#Show the predicted price from the linear regressions alongside the actual price
prediction_plot = Figure()\
.plot_xy(series_name="Actual", t=data_with_reg, x="Timestamp", y="MSTRLog")\
.plot_xy(series_name="Predicted", t=data_with_reg, x="Timestamp", y="MSTRLogPred")\
.chart_title(title=f"R2 = {reg_info['R2'][0]}, Beta = {reg_info['Beta'][0]}, Intercept = {reg_info['Intercept'][0]}") \
.show()

Crypto prediction plot

Universal code for any project

Incorporating both real-time and static data into my previously written code gave my predictions a new edge. Now the linear regression can stay up to date and serve as a better predictor of Microstrategy's price. Deephaven-IB has many tools at your disposal to take this prediction to the next level including automatic trades and risk monitoring. To top it all off, everything you create can be used with any data you want.

Want to get started with Deephaven and the Interactive Brokers plugin? Be sure to check out our documentation and examples or reach out to us on Slack to get started!