Connecting your March Madness dashboard to live data
Part 4 of the March Madness series: Swap simulation for real tournament feeds
March 19 2026


You've built the command center and added efficiency metrics, but there's one problem: the data is fake.
Simulated games are great for development, but when tip-off happens, you want real scores flowing through your dashboard. This is exactly what Deephaven is designed for: swap out the data source, and everything downstream — your queries, your analytics, your dashboard — just works.
Same queries, same dashboard, real data.
Catch up on the series:
- Part 1: Data-driven bracket picks — historical analysis and value picks.
- Part 2: Real-time March Madness analytics — build the live command center.
- Part 3: Understanding upsets — win probability and efficiency metrics.
Tip
New to Deephaven? Try the live demo or get started with Community Core — it's free and takes about 5 minutes.
Choosing a data source
In Part 2 and Part 3 of this blog series, we built a complete analytics dashboard — upset detection, scoring runs, bracket damage tracking, win probability. All of it powered by simulated data. The simulation was useful for development, but now we need the real thing.
Several APIs provide live sports data. Here's what matters for March Madness:
| API | Scores | Odds/Win Prob | Free Tier | Auth |
|---|---|---|---|---|
| The Odds API | ✓ | ✓ | 500 req/month | API key |
| ESPN (unofficial) | ✓ | ✗ | Unlimited | None |
| Sportradar | ✓ | ✓ | Trial only | API key |
We'll use The Odds API — it has a generous free tier, clean JSON responses, and includes win probabilities from major sportsbooks (which are more accurate than any model you'll build in an afternoon).
Getting started with The Odds API
- Sign up at the-odds-api.com (free tier works fine).
- Copy your API key from the dashboard.
- Store it as an environment variable — never commit keys to git.
Set the environment variable, then start Deephaven:
In your Python code, retrieve it with:
Caution
Never commit API keys to git. If you accidentally commit a key, rotate it immediately on the Odds API dashboard.
Fetching live scores
With your API key ready, let's see what real tournament data looks like. The Odds API returns scores for in-progress and completed games:
The response includes game IDs, team names, scores, and completion status — everything you need for your scoreboard.
Creating a ticking table from API data
Here's where everything comes together. Remember the simulated live_scoreboard table from Part 2? We're about to replace it with real data — and the beautiful part is that none of your downstream queries need to change.
We'll use a function-generated table to poll the API and produce a ticking table:
That's it. live_scores now updates every 5 minutes with real tournament data. Once you join in seed data (covered in "Putting it together" below), you're watching real upsets unfold.
Note
The free tier allows ~16 requests per day. A 5-minute refresh works for casual monitoring. For faster updates during games, consider a paid tier or use the caching strategy below to maximize your budget.
Adding win probabilities from odds
Remember the win probability model from Part 3? We built our own based on seed matchups and game state. But there's an easier way: let the sportsbooks do the math for you.
The Odds API provides betting odds, which we can convert to implied win probabilities:
These probabilities are derived from real money — millions of dollars wagered by people who care deeply about being right. It's a strong prior to have in your corner.
Rate limiting and caching
There's a catch with free APIs: they have limits. The Odds API allows 500 requests per month — about 16 per day. That's enough for casual monitoring, but you'll run out quickly when you're refreshing once a minute during a tight game.
Here's how to stretch your budget:
For tournament day with a paid tier, you might want:
- 1-minute refresh during games you're watching closely.
- 5-minute refresh for background monitoring.
- Cache between calls — scores don't change that fast.
Putting it together
Let's step back and appreciate what just happened. You built a complete analytics dashboard with simulated data. Now, with about 50 lines of API code, you've connected it to real tournament feeds.
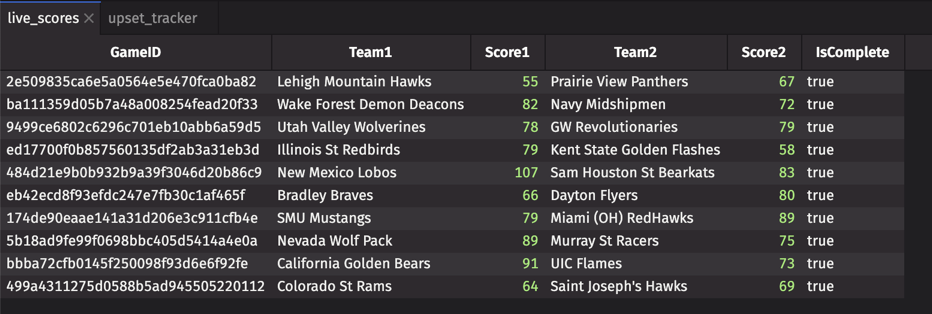
The scores endpoint gives you Team1, Score1, Team2, Score2, and IsComplete — enough for most analytics. One thing it doesn't include is seed numbers, which you need for true upset detection. The fix is a one-time join against a static seed lookup table:
Now the Part 2 upset detection works exactly as written:
![]()
live_scores_seeded is now a direct substitute for the simulated scoreboard from Parts 2 and 3. Scoring runs, bracket damage tracking, win probability — all of those queries work unchanged.
Complete working script
Note
No games right now? The active_upsets and win_probability tables will be empty outside of game times. During the tournament, games typically run Thursday–Sunday afternoons and evenings (ET).
The power of Deephaven's declarative approach: you describe what you want, not how to compute it. Swap the data source, and everything downstream updates automatically.
Swap the data source, keep the queries.
What's next
You now have a complete, production-ready March Madness analytics stack:
- Pre-tournament analysis — historical data for bracket picks.
- Real-time tracking — live upset detection and bracket damage.
- Contextual metrics — efficiency and win probability.
- Live data integration — real tournament feeds.
The same architecture works for any sport, any data source. NFL, NBA, soccer — if you can get the data, Deephaven can analyze it in real time.
Ready to build? Get started with Deephaven Community Core — free, open source, and built for exactly this.
Questions? Find us on Slack.