Draft smarter — NFL pick analysis with Deephaven
Tom Brady went 199th. Where do Pro Bowlers actually come from? We analyzed 20 years of draft data to find out
April 20 2026


The 2026 NFL Draft is days away. Teams have spent months scouting prospects and building their boards. Historically, about half of first-round picks don't live up to their draft position. Front offices know this. They keep doing it anyway.
Meanwhile, Tom Brady went 199th overall. Richard Sherman was a fifth-rounder. Dak Prescott lasted until the fourth round.
Half of first-round picks don't live up to their draft position. Where does the real value come from?
Where does draft value actually come from? Let's say your team picks 15th this year. Should they stay put, trade up for a quarterback, or trade down and stockpile picks? We'll dig into 20 years of data to find out — and build a system that updates the moment each selection is announced.
The data
We'll combine two datasets:
- Pro Football Reference draft history — every pick from 2000-2023, including career stats.
- NFL Combine results — measurables for prospects who participated.
Note
Data sourced from nflverse and hosted in the deephaven/examples repo for easy access.
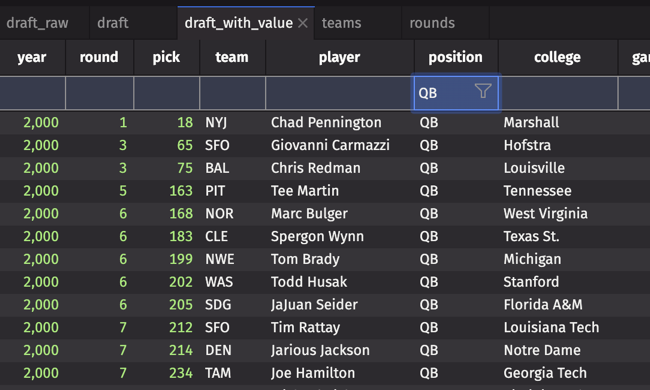
The draft table includes columns like:
| Column | Description |
|---|---|
year | Draft year |
round | Round (1-7) |
pick | Overall pick number |
team | Drafting team |
player | Player name |
position | Position (QB, WR, OT, etc.) |
college | College |
games_played | Career games |
pro_bowls | Pro Bowl selections |
all_pro | All-Pro selections |
approximate_value | Pro Football Reference's AV metric |
Defining "value"
Before we can analyze the draft, we need to define what "success" means. We'll add boolean columns to flag players who hit certain milestones:
Why 32 games for "starter"? That's two full seasons. If a player stuck around that long, he contributed. The "bust" definition is harsher: a first-round pick who couldn't last two years. We highlight those rows in red — scroll through the table and watch the cautionary tales pile up. This formatting propagates to any table derived from draft_with_value, so busts stay visible throughout your analysis.
Approximate Value (AV) is Pro Football Reference's catch-all metric for career production. It isn't perfect, but it lets us compare a linebacker to a kicker.
Pick value by round
Your GM is weighing a trade: move up from 15 to 5 for a quarterback, or trade back to 25 and pick up an extra second-rounder? The conventional wisdom says first-rounders are safer bets. How much safer, exactly?
We'll group all picks by round and compute averages using agg_by:
This gives us one row per round with the count and averages.
Round 1 picks become Pro Bowlers at 15x the rate of Round 7 picks — but they also cost 15x as much in trade value.
The drop-off from Round 1 to Round 2 is steep: Round 1 picks are nearly 50% more likely to become starters. After Round 3, though, the curves flatten. Rounds 5-7 are statistically similar.
Staying at 15 versus moving to 25? Historically, almost no difference. Moving up to 5 costs a fortune in draft capital for a marginal bump in expected value.
Position matters more than you think
Back to your trade decision. That top-5 pick would be for a quarterback — but not all positions carry the same risk.
Here's the same aggregation, now grouped by both position and round, then filtered to first-rounders only:
Run by_position and sort by bust_rate. Quarterbacks consistently top the list — by a wide margin over offensive linemen, who are historically the safest first-round investment. The specific gap in your dataset will vary by era, but the direction is reliable: skill positions bust more often than trenches.
If your roster is close, draft the lineman. Take the quarterback only if you can afford to be wrong.
Team drafting efficiency
Some franchises consistently find value. Others don't. Here's the efficiency math:
Sort team_efficiency by avg_av_per_pick. Seattle's there because Wilson (third round), Sherman (fifth round), and Wagner (second round) all put up career AV numbers that first-rounders would envy. Some front offices do this systematically. Most don't, and it shows.
Finding the "steal zones"
Where do late-round Pro Bowlers actually come from?
Over 20% of Pro Bowlers since 2000 came from picks 101 and later. Late rounds aren't lottery tickets. They're where Seattle found Richard Sherman (fifth round) and the Patriots found Tom Brady (sixth).
Trade back from 15 to 25 and pick up an extra fourth-rounder. The numbers favor volume.
Combine metrics vs career success
Do combine measurables predict NFL success?
We'll use natural_join to add combine metrics to each player's draft record. The join matches on player name and year, pulling in measurables like 40-yard dash time:
Now each row has both career outcomes and athletic testing. We filter to receivers with recorded 40 times to check if speed predicts success.
The correlation is weak. Darrius Heyward-Bey ran a 4.30 and barely lasted five years. Anquan Boldin ran a 4.71 and made the Hall of Fame.
The stopwatch measures one thing. Football IQ, route running, hands — none of that shows up at the combine.
Trade value analysis
Is trading up worth it? The math is brutal.
The Jimmy Johnson trade value chart assigns point values to each pick: pick 1 is worth 3,000 points, and the value decays exponentially from there. We'll compute each pick's "efficiency": career value divided by trade cost.
Higher efficiency means more career value per trade point spent. The data suggests the late first round and early second round — picks 20-40 — offer the best return on investment: first-round talent at second-round prices. Teams trading up into the top 5? They're often overpaying.
So what should your team do at 15? The math says: trade back. Pick up extra picks in the 20-40 range where value efficiency peaks — unless you've genuinely found your franchise quarterback.
Real-time draft tracking
Historical analysis is useful prep work. When you're on the clock, though, yesterday's numbers don't tell you what just happened two picks ago.
Every table in this post works identically on live data. Wrap your draft API call in a function_generated_table that polls every 30 seconds, and live_picks becomes the new source. Your bust rates, AV lookups, and trade efficiency calculations all update automatically as each pick is announced — no code changes required.
Ask questions in plain English
Draft night moves fast. Connect Claude, Cursor, or Windsurf to your session via MCP and ask questions instead of writing queries. Right-click any column and use Quick Filter to slice by position or college instantly.
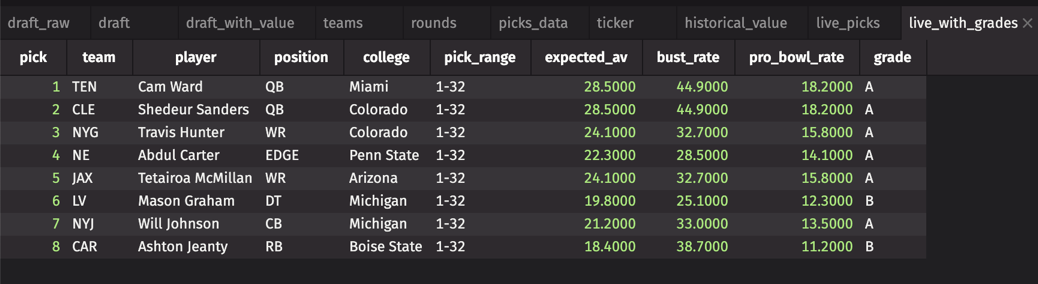
You: Which positions have the highest bust rate in the first round?
Claude: I'll query
by_positionsorted bybust_rateand return the ranking.
Result:
The AI reads the live table, writes the query, and returns the result. You focus on the draft board, not syntax.
Draft day takeaways
Based on 20+ years of data:
- Offensive linemen are the safest first-round picks — consistently the lowest bust rate among skill positions, and they contribute for years even when they're not stars.
- Quarterbacks are the riskiest — the highest bust rate in the first round, but the ones who stick define franchises.
- Rounds 4-7 aren't throwaway picks. One in five Pro Bowlers in this dataset was a Day 3 selection. The teams that know this win the draft without winning the lottery.
- Combine numbers are overrated — measurables explain less career variance than you'd expect.
- Trading down usually wins — picks 20-40 return more career value per draft capital spent than any other range.
Try it yourself
- Try it in the browser — no install required.
- Install Deephaven — free, takes five minutes.
- Connect an AI assistant — ask draft questions in plain English.
Load your team's last decade of picks. Sort by AV. Look at where the hits actually came from.
The answer is usually not where the fanbase thinks. And when your GM makes a move you don't understand, you'll have the data to know whether to trust it.
Questions or want to share your analysis? Join us on Slack.