Private Credit Portfolio Analysis, Part 2: Live Excel Reporting with Deephaven
Connect your portfolio stress analysis directly to Excel — no exports, no copy-paste, live data every quarter
July 23 2026

In Part 1, we built a portfolio stress detection system: segmenting borrowers by risk, stress testing coverage ratios, quantifying sector concentration, and pattern-matching against known problem loans. The analysis lives in Deephaven. This post covers the last step — getting it in front of your LPs and team in the spreadsheet they're already using.
Taking it to Excel
The analysis runs in Deephaven, but your LPs and team need the data in a format they can open. With the Deephaven Excel add-in, you can connect these tables directly to a spreadsheet — no export step, no copy-paste. The watch list is only useful if it stays current; this is how you make sure it does.
The watch list is only useful if it stays current — live Excel subscriptions make sure it does.
For the Excel formulas to work, the analysis needs to run as a Persistent Query (PQ) — a named, managed worker in Deephaven Enterprise that keeps your tables in memory and accessible to clients. Create a PQ called portfolio_pq in the Enterprise UI, paste the full analysis script below as the script body, and start it. The PQ keeps portfolio_health, stress_scenarios, stress_summary, and watch_list_summary in memory and accessible to Excel by name.
Before starting the PQ, the CSVs need to actually exist at those paths. /db/Users/<username>/ is your personal directory in Enterprise's DB storage, reachable from any console or PQ session under your login. If you're using real loan data, export it from your loan management system and upload it there through the Enterprise UI's file browser. If you're following along with the sample data from Part 1, open a console session under your own user and run the same generation script, pointing write_csv at your Enterprise path instead of /data/.
write_csv doesn't create missing directories, so if /db/Users/<username>/ hasn't been written to before, create it first:
Click to expand: Sample data generation script
Click to expand: Full portfolio_pq script
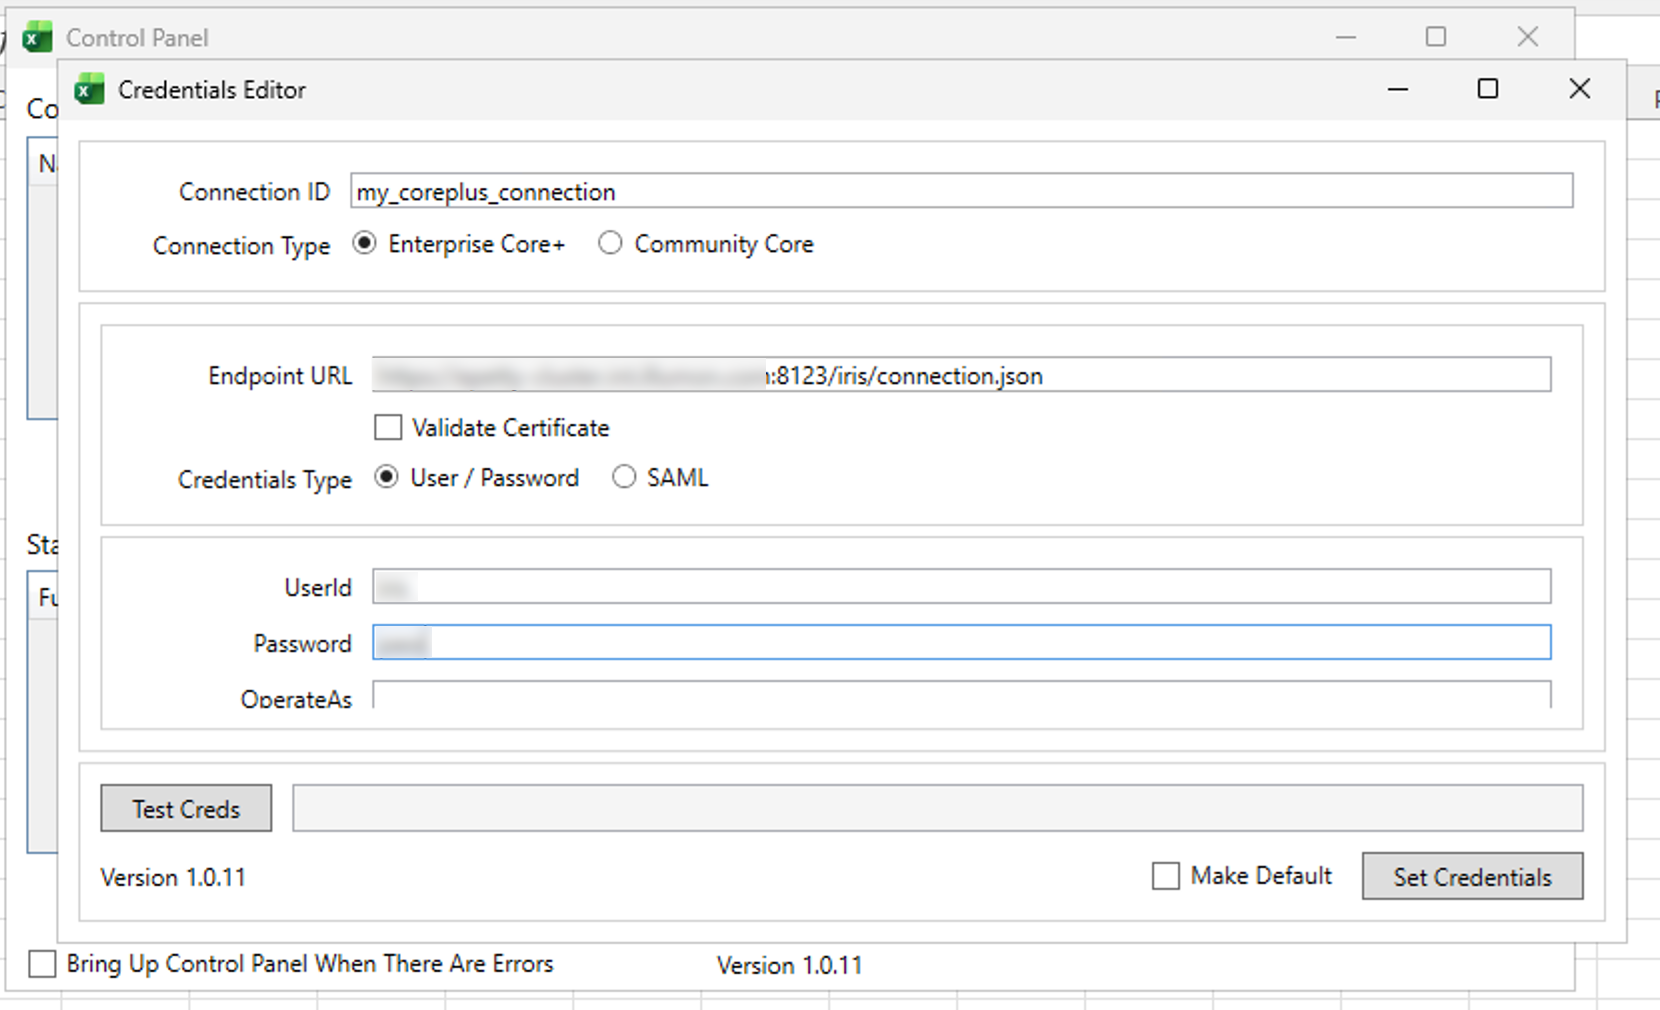
Once the PQ is running, connect to it from Excel using ConnectionID:PQName/TableName.
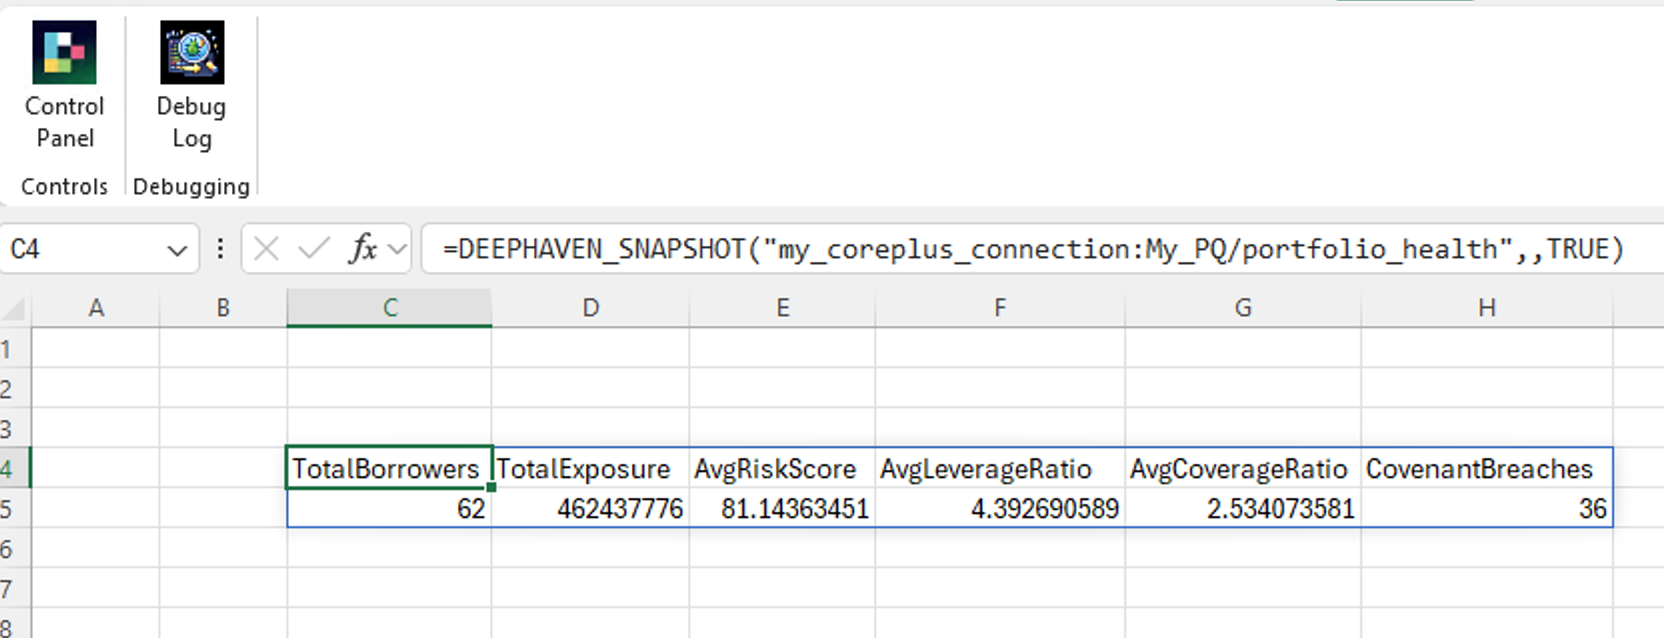
For LP quarterly reports, use DEEPHAVEN_SNAPSHOT — it pulls a point-in-time copy of the data, which is what you want for a static report that reflects a specific quarter. Pull portfolio_health into your existing template:
For ongoing monitoring, subscribe to stress_scenarios — it gives you one row per borrower with coverage ratios under each rate scenario and breach flags, which is well-suited for Excel's conditional formatting and formula tools:
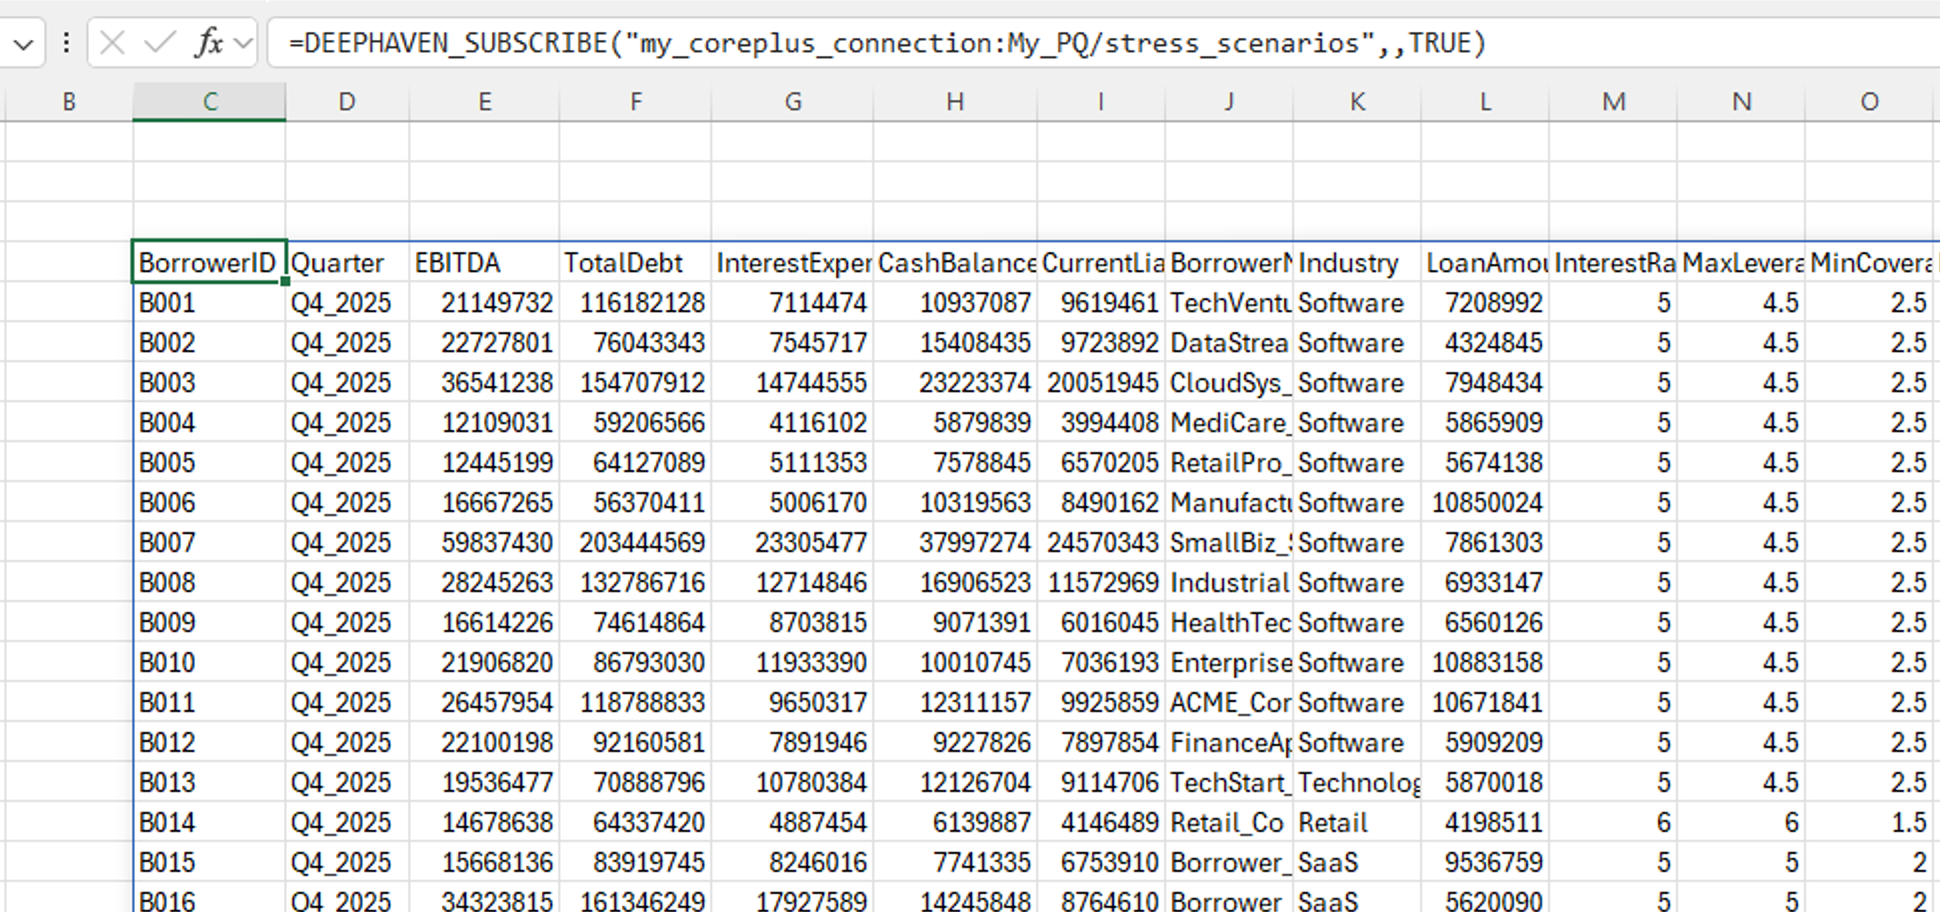
From there, it's your spreadsheet — conditional formatting, pivot tables, FILTER, whatever your workflow calls for. When Q1 data arrives and you restart the PQ, the subscribed cells update on their own.
Formula examples
Once stress_scenarios is subscribed in your sheet, the breach flags and coverage ratios are just cells — Excel's native tools work on them the same as any other range.
To see only the highly leveraged borrowers, wrap the subscribed range in FILTER:
A2:AI63 covers the table's full 35 columns and 62 data rows (with A1:AI1 as the header row above it). IsHighLeverage is a reasonable condition to filter on since Part 1's analysis found high leverage across a meaningful share of the portfolio in every quarter tested. The if_empty argument still matters as a safeguard: without it, FILTER returns #CALC! whenever zero rows match, since Excel refuses to spill an empty array. As the PQ ticks new data, the filtered view updates without you touching the formula.
Note
If you add or remove columns in the script, every column after the change shifts letters. Recount from the header row in row 1 rather than assuming these letters still apply after editing portfolio_pq.
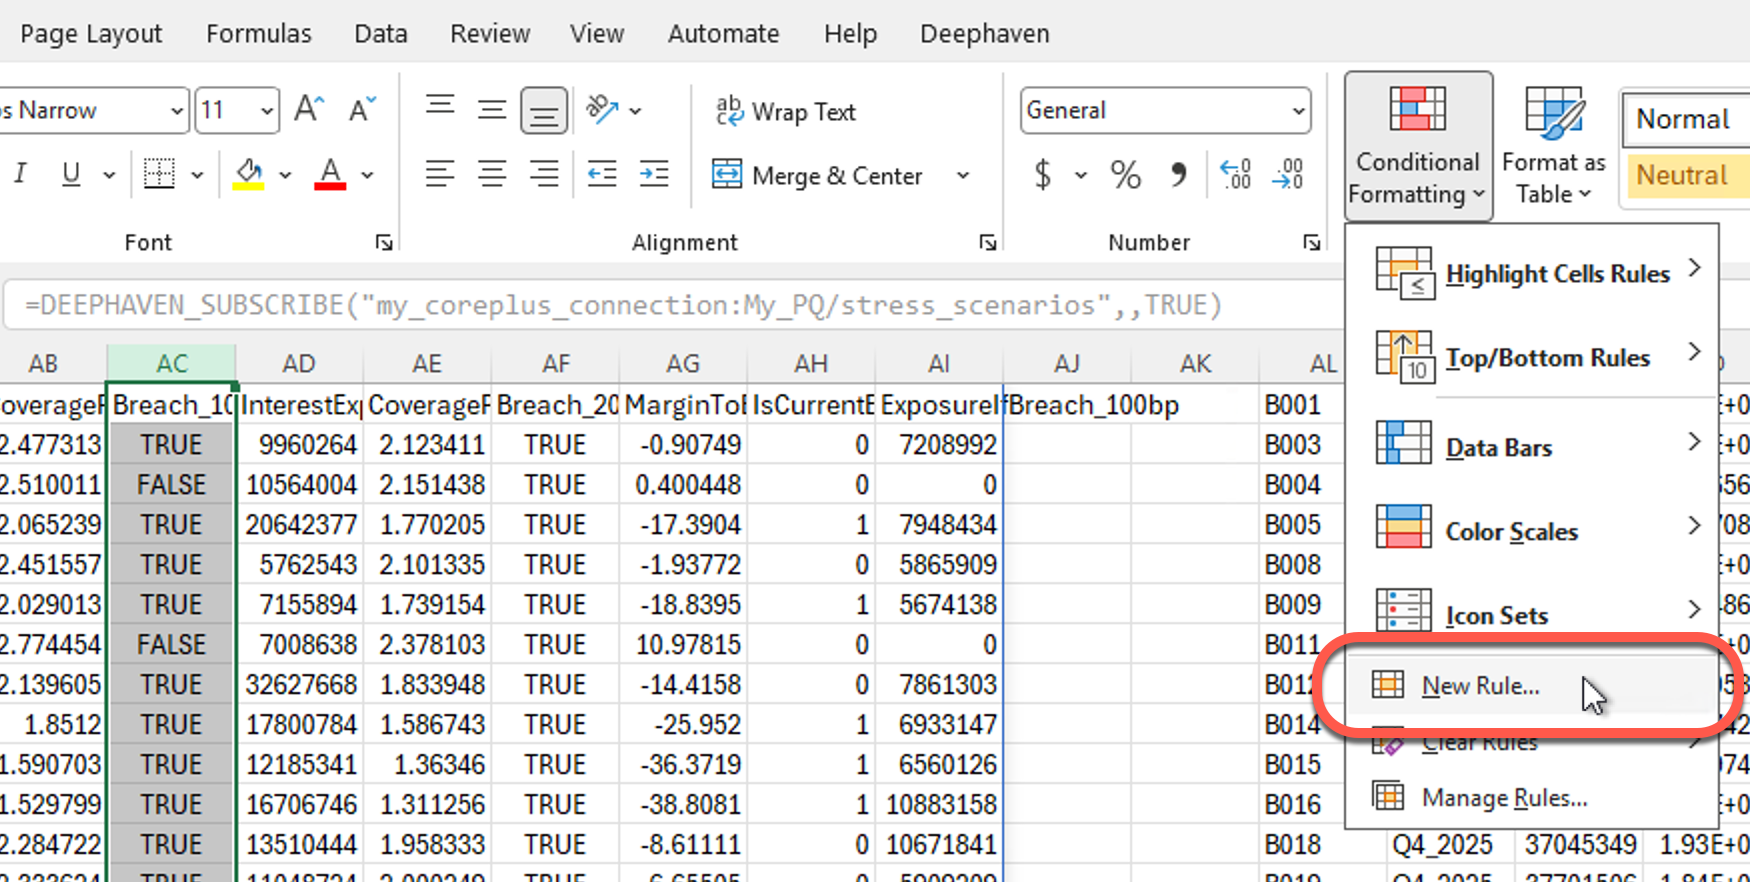
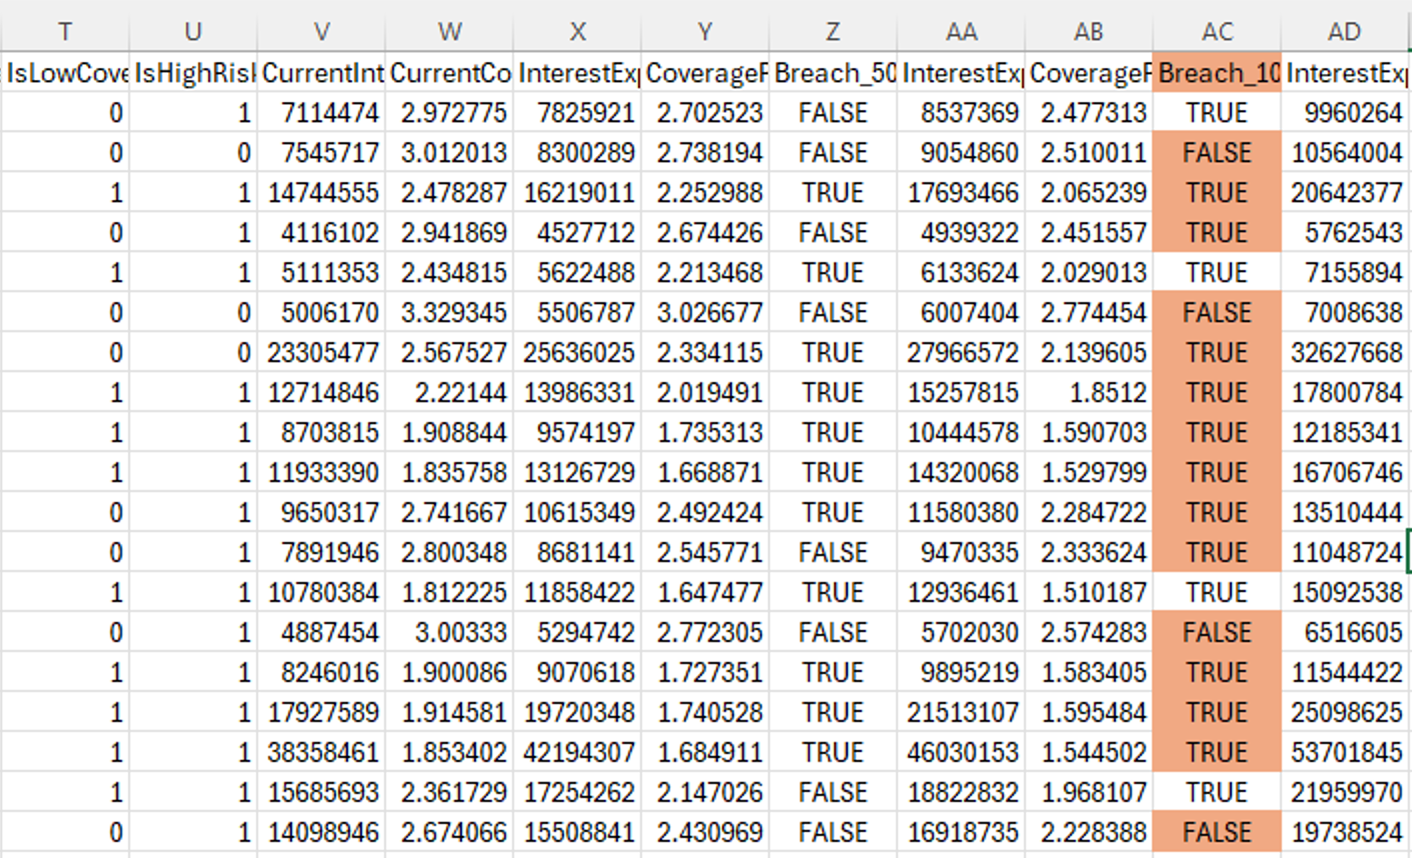
Conditional formatting makes breaches visible at a glance without a helper column. Breach_100bp is column 29, AC. Select that column, then Home > Conditional Formatting > New Rule > Use a formula to determine which cells to format, and enter:
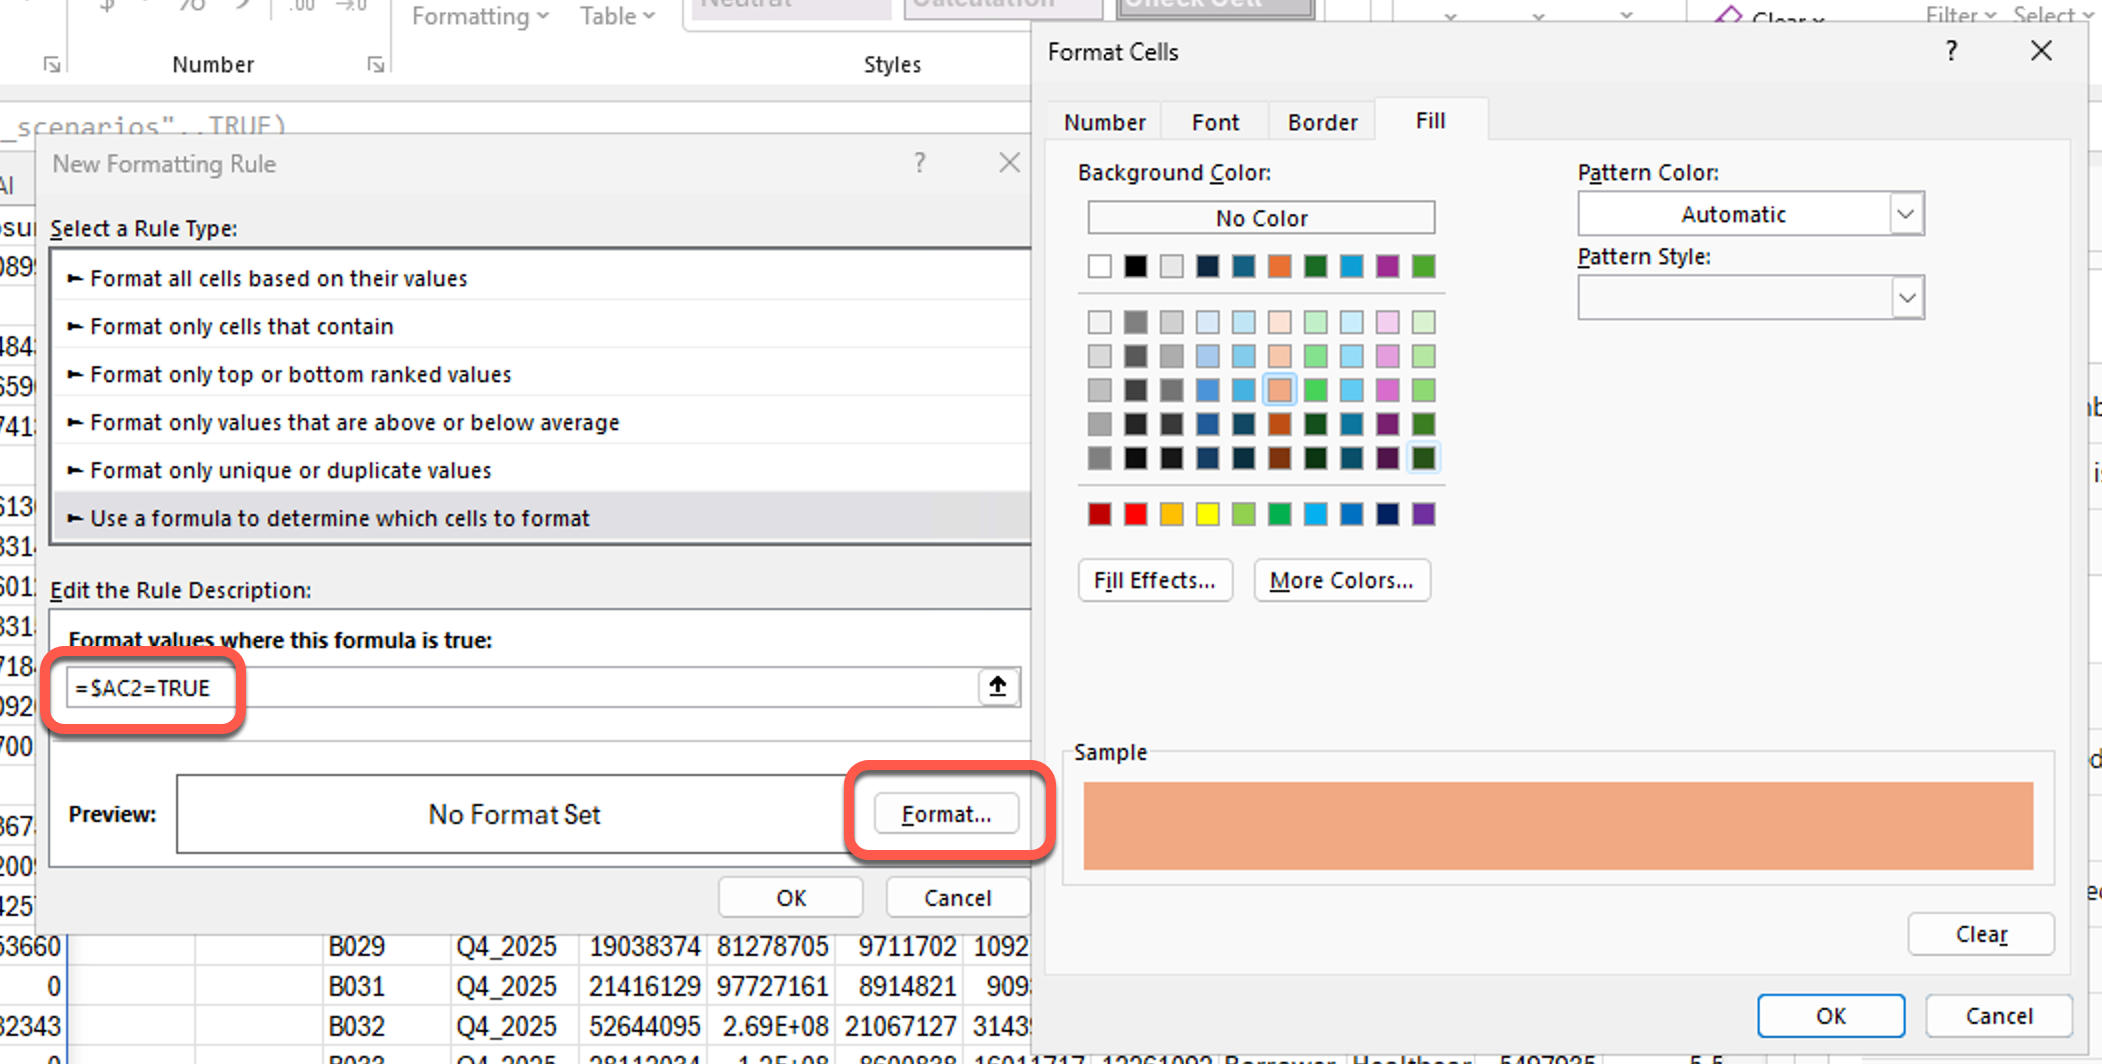
Set the fill to your color of choice via the Format button in the Conditional Formatting dialog. Every row that breaches at 100bp highlights itself as the underlying table changes — no macro, no refresh button.
For sector-level exposure, pivot the same subscribed range: drag Industry to Rows and LoanAmount to Values (Sum), then add Breach_100bp to Values (Average) to see breach rate alongside exposure per sector. Because the source range is a live subscription, refreshing the pivot table picks up whatever the PQ has computed as of that moment.
Building the LP report spreadsheet
A quarterly LP report is really three tabs, each pulling a different table with a different formula:
- Portfolio Health —
DEEPHAVEN_SNAPSHOTonportfolio_health. This is the point-in-time summary LPs expect in a quarterly letter, so it should stay frozen until you explicitly re-pull it for the next quarter. - Stress Scenarios —
DEEPHAVEN_SUBSCRIBEonstress_scenarios, with theFILTERand conditional formatting from the section above. This tab is for your team's ongoing monitoring, not the static LP letter, so it's fine for it to keep updating. - Watch List —
DEEPHAVEN_SNAPSHOTonwatch_list_summary, since the whole point of a watch list in an LP report is to show the borrowers you flagged as of that quarter, not a list that reshuffles under the reader.
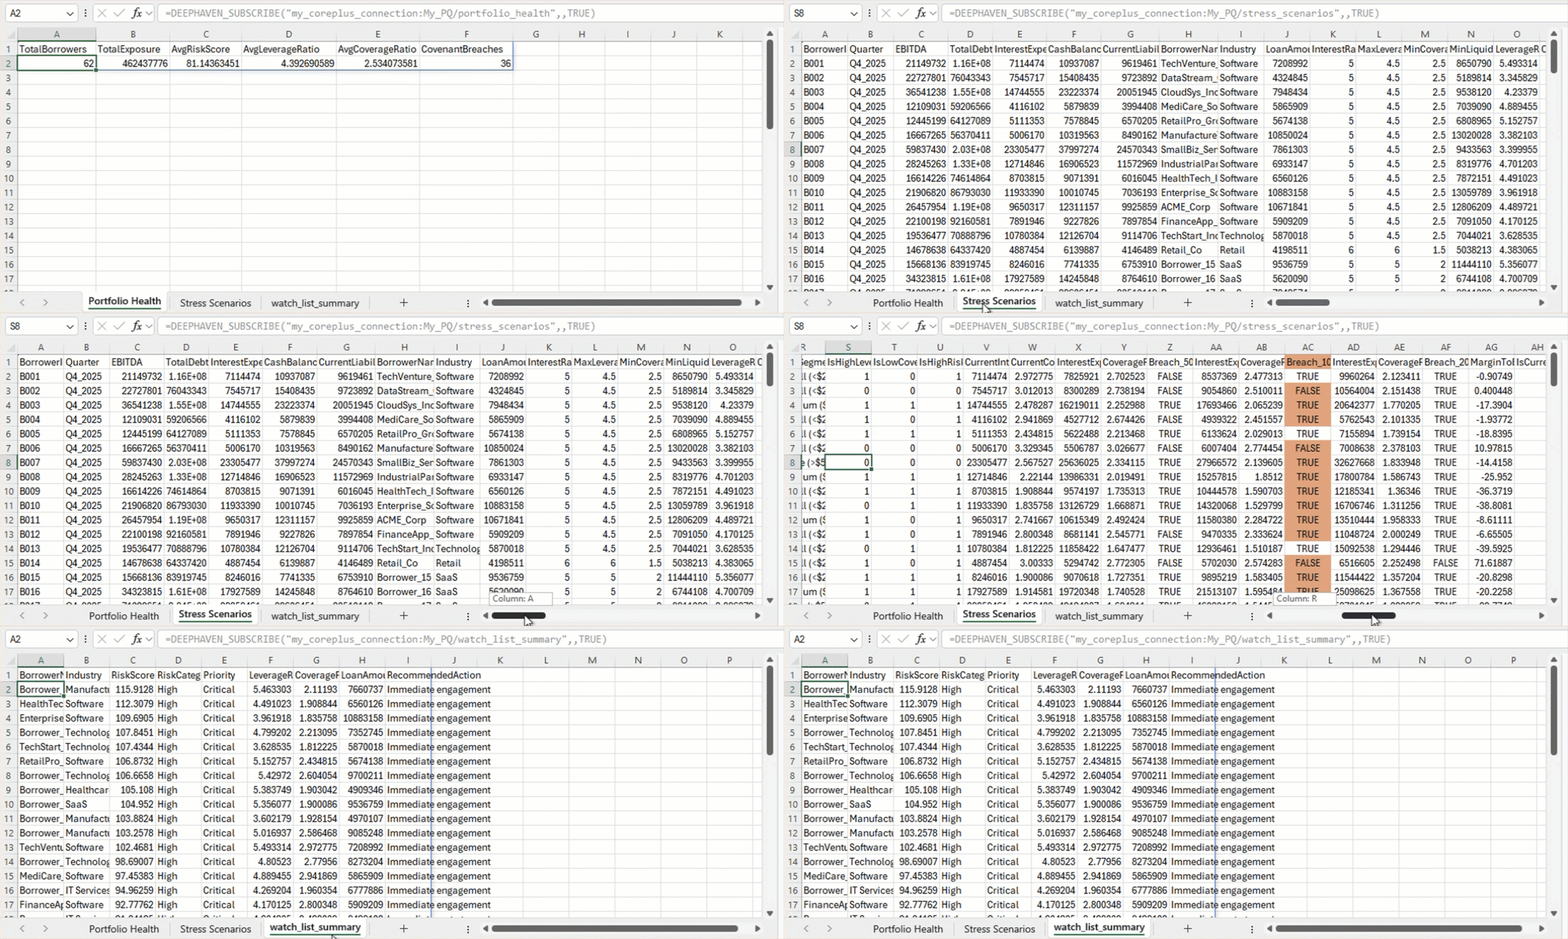
For quarterly reuse, keep the sheet itself untouched — the tab structure, formulas, and formatting don't change. When Q1 data lands, update the CSVs portfolio_pq reads from and restart the PQ. The DEEPHAVEN_SUBSCRIBE cells on the Stress Scenarios tab pick up the new data automatically. For the Portfolio Health and Watch List tabs, re-run the DEEPHAVEN_SNAPSHOT formulas — right-click the cell and Recalculate, or press F9 — to pull the new quarter's point-in-time values. The same sheet works quarter after quarter; only the underlying data changes.
Try it yourself
- Try it in the browser — no install required.
- Install Deephaven — free, takes about five minutes.
- Set up the Excel add-in and connect it to your Enterprise instance.
- Point
portfolio_pqat your own loan data and pullportfolio_healthinto a fresh sheet withDEEPHAVEN_SNAPSHOT. - Subscribe to
stress_scenariosand add a conditional formatting rule for your own breach threshold.
Your LPs don't need another PDF next quarter — they need the sheet that's already open to update itself. Questions? Join us on Slack.