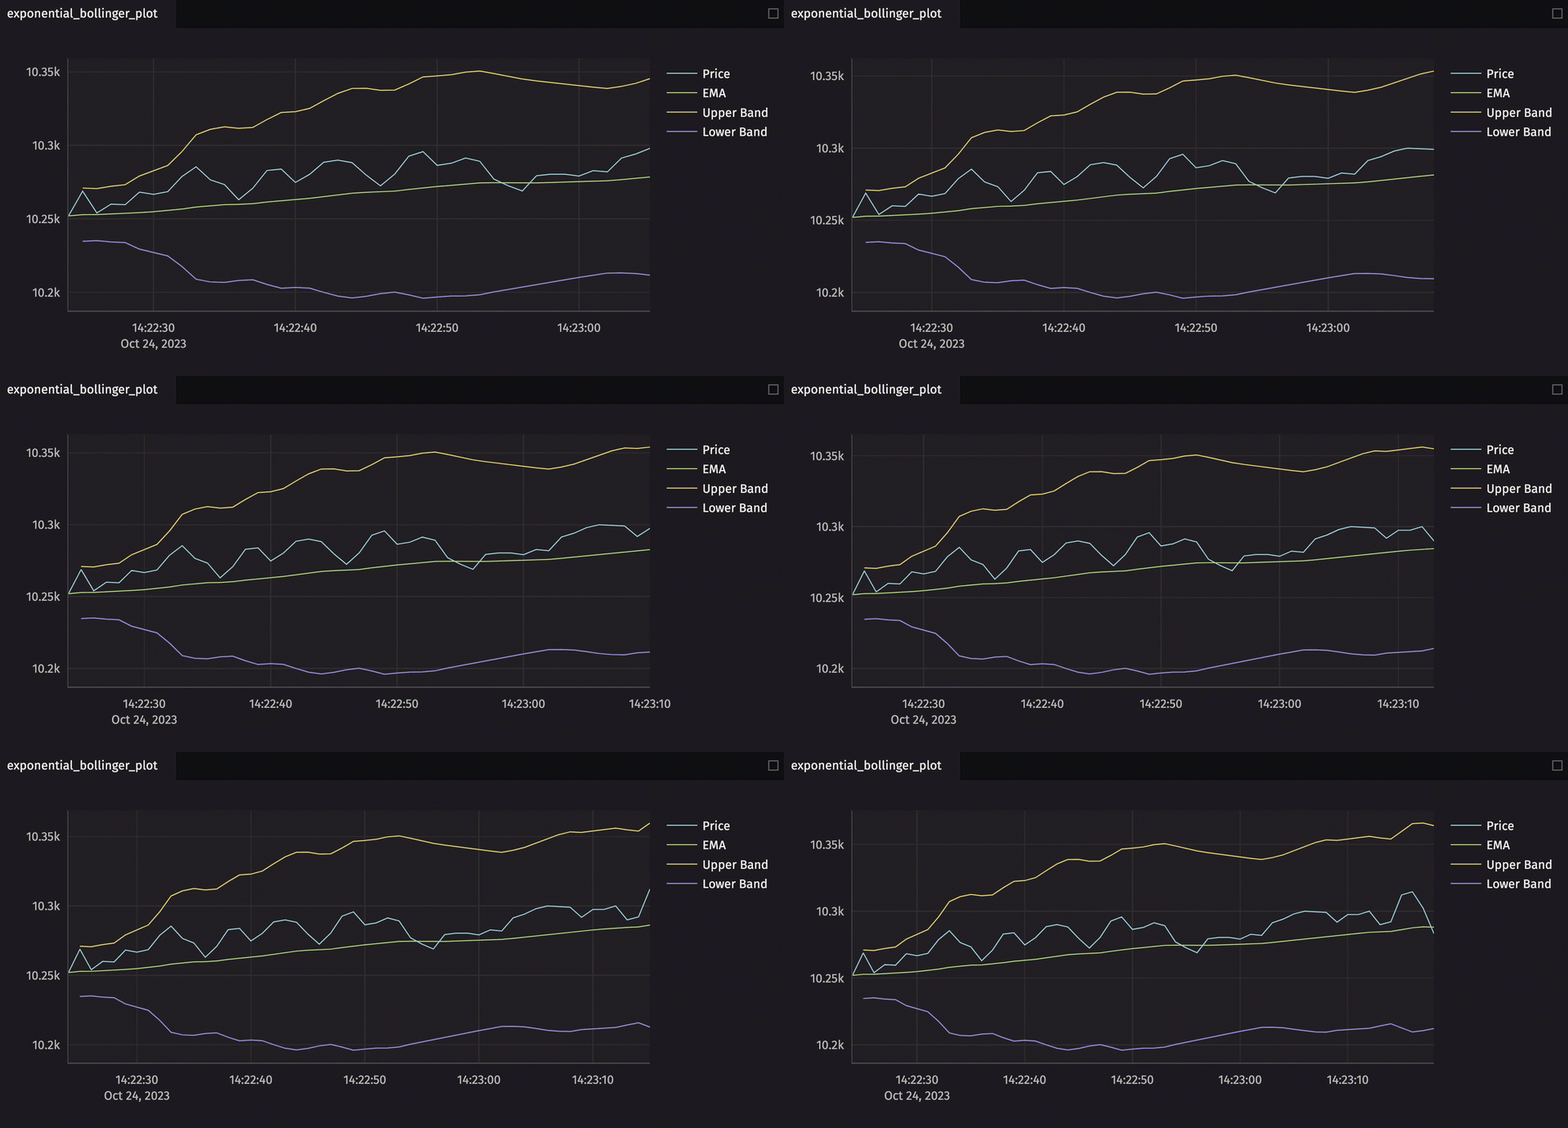
Bollinger Bands have been a popular technical analysis tool since the 1980s. Typically associated with computational finance, they are used to identify the volatility of an asset and if it is overbought or oversold. Bollinger Bands also have applications in manufacturing, aviation, healthcare, and various other fields.
A Bollinger band is visualized as an envelope around a measurement. In finance, that measurement is the price of a stock, option, or other asset. The envelope is defined by two calculations: a moving average and standard deviation. The envelope is centered around the average, and the upper and lower bounds of the envelope are defined by the average plus or minus a constant times the standard deviation. The average and standard deviation can be simple or exponential in nature.
In Deephaven, it takes only two table operations to create Bollinger Bands. The first calculates the moving average and standard deviation with update_by. The second creates new columns with the upper and lower bands with update_view.
Data
For this blog, we'll be using the Crypto dataset. It contains cryptocurrency price data from September 7, 2021 with timestamps. Given the time series nature of the data, we'll be using the time-based table operations to create Bollinger Bands. Columns unrelated to our calculations are removed for the sake of simplicity. Additionally, the table is sorted on the timestamp column so that we can replay it in real time later.
from deephaven import read_csv

crypto_prices = read_csv("https://media.githubusercontent.com/media/deephaven/examples/main/CryptoCurrencyHistory/CSV/crypto_sept7.csv").\
    sort(["dateTime"]).\
    select(["dateTime", "Coin", "Price = close"])
- crypto_prices
Equations and code
Bollinger Bands can be created with simple moving average and standard deviation or their exponential counterparts. Each will be shown in the sections below.
Simple moving average (SMA) and standard deviation
An SMA is the mean of the last N measurements. A simple moving standard deviation describes how much those last N measurements vary from the mean. These calculations are extremely useful despite their simplicity.
The code below creates Bollinger Bands using time-based SMA and standard deviation for the cryptocurrency prices with a decay rate of 20 minutes. The calculations are done on a per-coin basis, so multiple SMAs and standard deviations are calculated in one operation. The upper and lower bands are 5 standard deviations above and below the average, respectively.
from deephaven.updateby import rolling_avg_time, rolling_std_time

bollinger_ops = [
    rolling_avg_time(ts_col="dateTime", cols=["Avg = Price"], rev_time="PT20m", fwd_time=0),
    rolling_std_time(ts_col="dateTime", cols=["Std = Price"], rev_time="PT20m", fwd_time=0)
]

crypto_bollinger_sma = crypto_prices.update_by(
    ops=bollinger_ops,
    by=["Coin"]
).update([
    "UpperBand = Avg + 5 * Std",
    "LowerBand = Avg - 5 * Std"
])
- crypto_bollinger_sma
Plotting the results for just Bitcoin shows our Bollinger Band in action!
from deephaven.plot.figure import Figure

bitcoin_bollinger_sma = crypto_bollinger_sma.where(["Coin == `BTC`"])

simple_bollinger_plot = Figure().\
    plot_xy(series_name="Price", t=bitcoin_bollinger_sma, x="dateTime", y="Price").\
    plot_xy(series_name="SMA", t=bitcoin_bollinger_sma, x="dateTime", y="Avg").\
    plot_xy(series_name="Upper Band", t=bitcoin_bollinger_sma, x="dateTime", y="UpperBand").\
    plot_xy(series_name="Lower Band", t=bitcoin_bollinger_sma, x="dateTime", y="LowerBand").\
    show()
- simple_bollinger_plot
- bitcoin_bollinger_sma
Exponential moving average (EMA) and standard deviation (EMSTD)
An EMA is a weighted average of current and past measurements. Unlike SMA, which is windowed, EMA accounts for all previous measurements. Measurement weights approach zero the older they get compared to the current measurement. The rate at which weights decrease is known as the decay rate. An SMSTD is the same, but for standard deviation instead of mean.
The code below creates Bollinger Bands using time-based EMA and time-based EMSTD for the Bitcoin prices with a decay rate of 20 minutes. The upper and lower bands are 5 standard deviations above and below the average, respectively.
from deephaven.updateby import ema_time, emstd_time

bollinger_ops = [
    ema_time(ts_col="dateTime", decay_time="PT20m", cols=["EMA = Price"]),
    emstd_time(ts_col="dateTime", decay_time="PT20m", cols=["EMStd = Price"])
]

crypto_bollinger_ema = crypto_prices.update_by(
    ops=bollinger_ops,
    by=["Coin"]
).update_view([
    "UpperBand = EMA + 5 * EMStd",
    "LowerBand = EMA - 5 * EMStd"
])
- crypto_bollinger_ema
Once again, plot the results to see Bitcoin's volatility, but this time using exponential moving statistics.
from deephaven.plot.figure import Figure

bitcoin_bollinger_ema = crypto_bollinger_ema.where(["Coin == `BTC`"])

exponential_bollinger_plot = Figure().\
    plot_xy(series_name="Price", t=bitcoin_bollinger_ema, x="dateTime", y="Price").\
    plot_xy(series_name="EMA", t=bitcoin_bollinger_ema, x="dateTime", y="EMA").\
    plot_xy(series_name="Upper Band", t=bitcoin_bollinger_ema, x="dateTime", y="UpperBand").\
    plot_xy(series_name="Lower Band", t=bitcoin_bollinger_ema, x="dateTime", y="LowerBand").\
    show()
- exponential_bollinger_plot
In real time!
None of this is exciting unless it can be done in real time.
With Deephaven, working with real-time calculations is just as easy as working with static ones.
To create real-time Bollinger Bands, all we need is a ticking table, and we can just rerun the code from above. Usually, we'd replay the table data. In this case, though, prices are spaced a minute apart - a table that ticks once a minute is too slow for this demonstration. Instead, we'll use a time table and join it with the original crypto_prices table to create data that ticks every second.
from deephaven.time import to_j_instant
from deephaven import time_table

start_time = to_j_instant("2021-09-07T00:00:00 ET")

tt = time_table("PT1s").update(["dateTime = start_time + i * MINUTE"])

crypto_live = tt.join(table=crypto_prices, on=["dateTime"]).drop_columns(["Timestamp"])
With our data now ticking every second, all that's left to do is redoing the EMA and EMSTD Bollinger Bands by copy/pasting the code from above. We'll just change the table name to crypto_live in the calculations.
bollinger_ops = [
    ema_time(ts_col="dateTime", decay_time="PT20m", cols=["EMA = Price"]),
    emstd_time(ts_col="dateTime", decay_time="PT20m", cols=["EMStd = Price"])
]

crypto_bollinger_live = crypto_live.update_by(
    ops=bollinger_ops,
    by=["Coin"]
).update_view([
    "UpperBand = EMA + 5 * EMStd",
    "LowerBand = EMA - 5 * EMStd"
])

bitcoin_bollinger_live = crypto_bollinger_live.where(["Coin == `BTC`"])

exponential_bollinger_plot = Figure().\
    plot_xy(series_name="Price", t=bitcoin_bollinger_live, x="dateTime", y="Price").\
    plot_xy(series_name="EMA", t=bitcoin_bollinger_live, x="dateTime", y="EMA").\
    plot_xy(series_name="Upper Band", t=bitcoin_bollinger_live, x="dateTime", y="UpperBand").\
    plot_xy(series_name="Lower Band", t=bitcoin_bollinger_live, x="dateTime", y="LowerBand").\
    show()

Reach out
Our Community documentation has more information on Deephaven's features such as the ones shown in this blog. Our Slack community continues to grow, and we'd love to have you join us! If you have any questions, comments, or suggestions, please feel free to reach out to us there.

