Use TensorBoard with Deephaven
This guide will show you how to use TensorBoard with either TensorFlow or PyTorch in Deephaven queries.
TensorBoard is one of the most useful tools when training deep neural networks. Many consider the neural network to be a black box, but TensorBoard can shed some light on how to improve your model. TensorBoard can track your experiment metrics like loss and accuracy, visualize the model’s architecture, check model weights and biases, profile your model to see its performance, help tune hyperparameters, project embeddings to a lower dimensional space, and much more. If the training time of your neural network is a couple of hours/days, you can watch updating statistics in a TensorBoard dashboard in real time, making it a natural pairing with Deephaven.
Don't sweat: using TensorBoard with Deephaven's powerful table engine is easy and requires just a couple of lines of code!
Using TensorBoard with TensorFlow
In our example, we will be using one of the pre-built Deephaven Docker images: Python with TensorFlow. If you need detailed instructions on how to launch Deephaven from pre-built images, please see this guide.
Classification example
We will classify the Iris dataset with Deephaven tables and use the same Keras neural network we built in our TensorFlow tutorial. We will only need to add a few lines of code to enable TensorBoard!
First, we have to set a log directory. This is where TensorBoard will store the logs. It will read these logs to show various visualizations:
Second, we need to run TensorBoard and provide the log directory and port number:
After that, your TensorBoard dashboard will be available via the browser using the following URL: http://localhost:6006
The TensorBoard dashboard is not active yet. To have some meaningful information in it, we need to specify the TensorBoard callback during the model’s fit method. The TensorBoard callback is just an object that will allow us to write to Tensorboard logs after every epoch:
The final step is to pass the callback to the function that trains the model:
So the complete script looks like this:
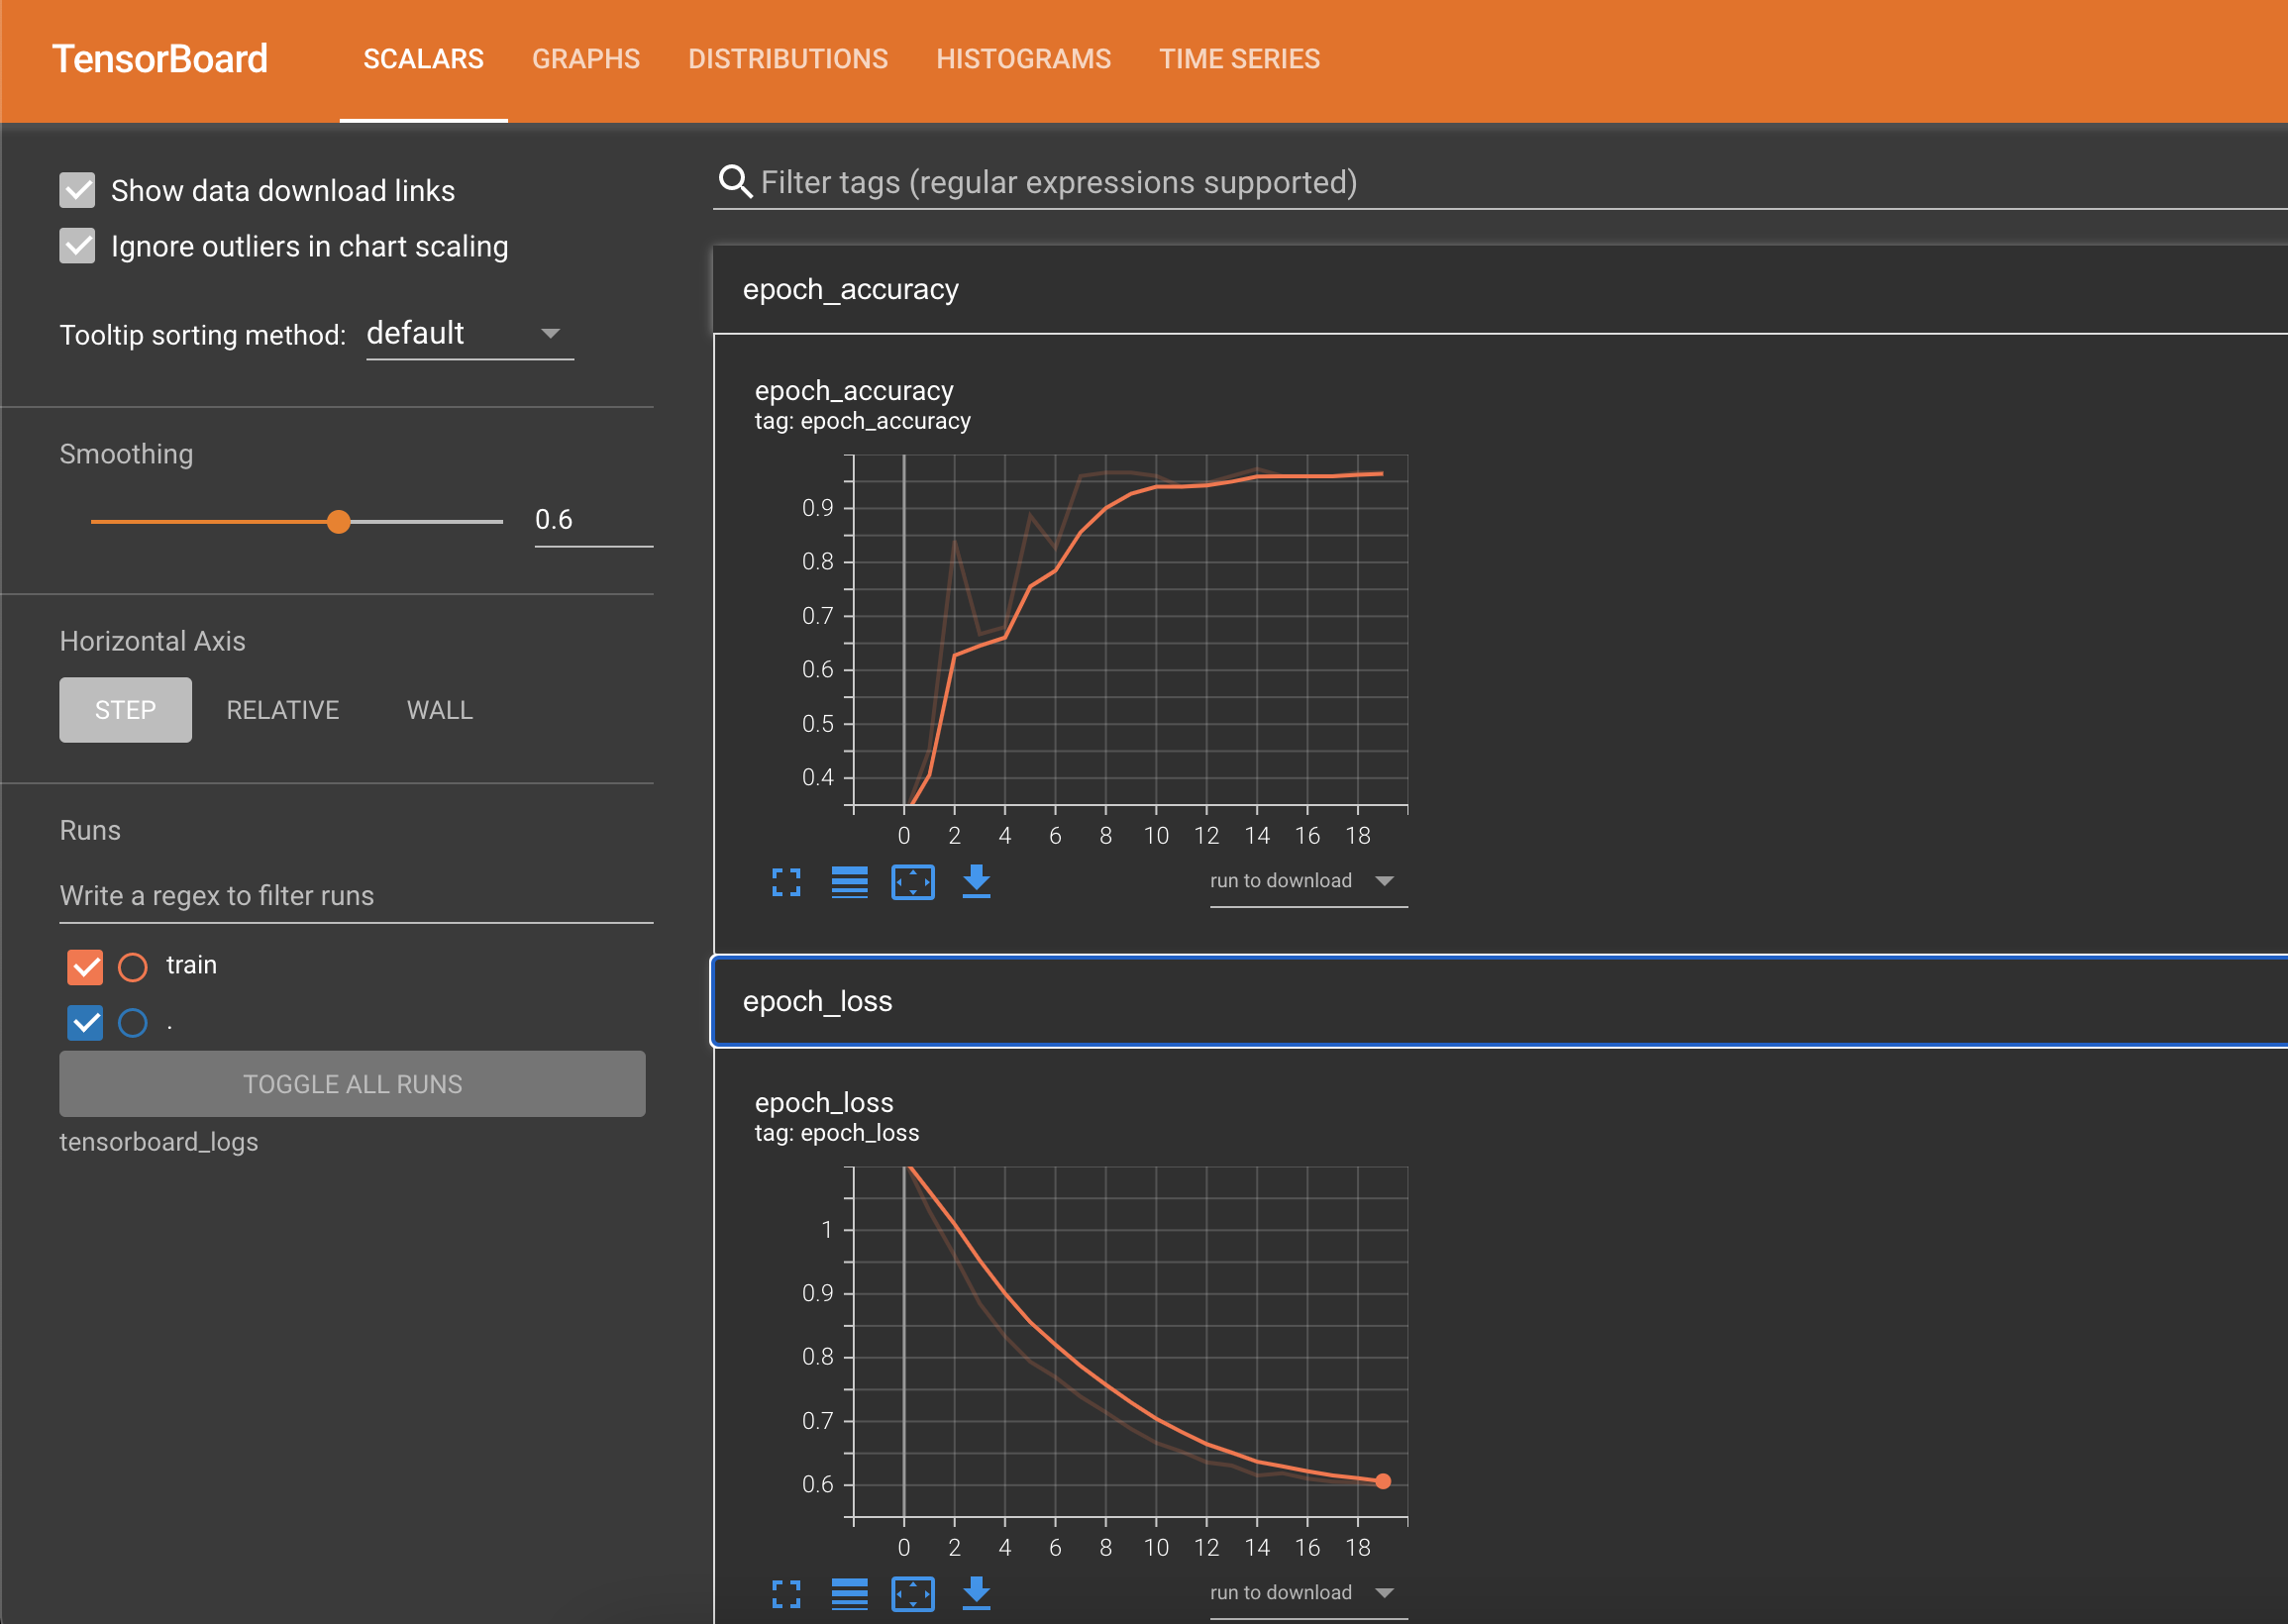
After training the model, you can open the Tensorboard dashboard with http://localhost:6006 and explore the gathered data. The Scalars tab shows changes in the loss and metrics over the epochs. It can be used to track other scalar values, such as learning rate and training speed:
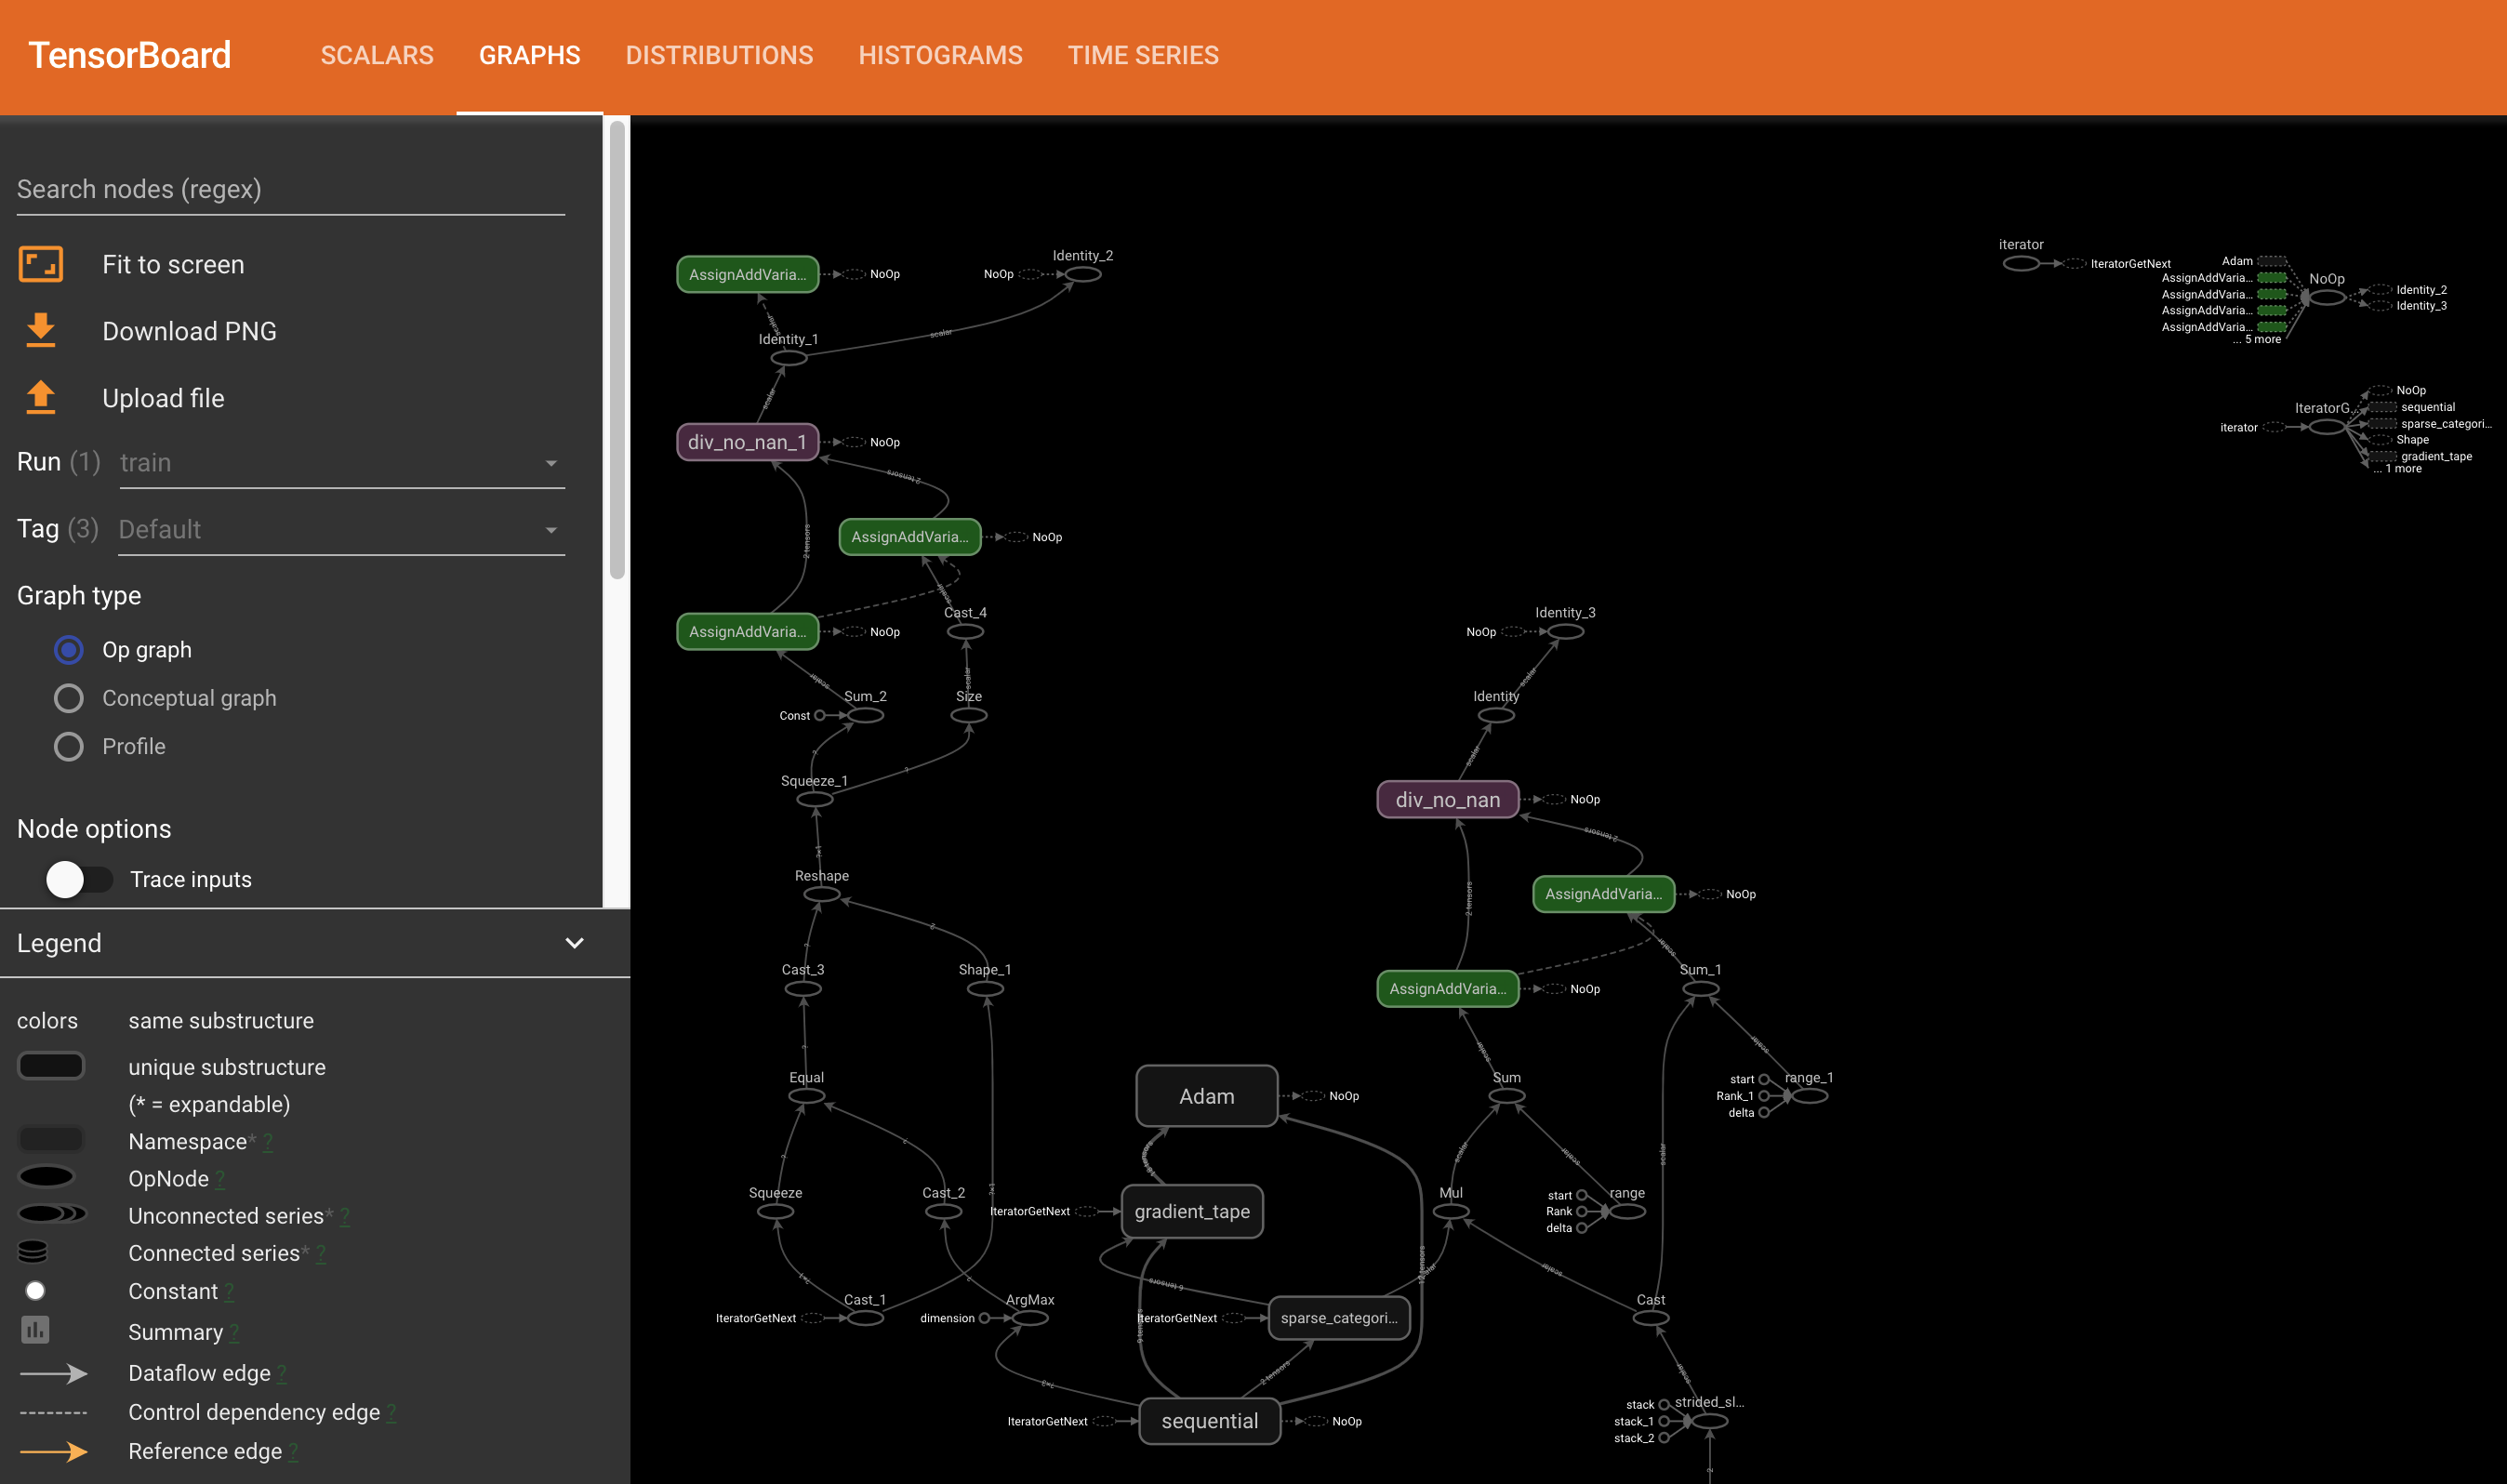
The Graphs tab shows your model’s layers. You can use this to check if the model's architecture looks as intended.
You can also use TensorBoard to check the distribution of the weights and biases over each epoch, visualize any vector representation (e.g., word embeddings and images), track the performance of every TensorFlow operation that has been executed, monitor hyperparameters and other cool things!
Using TensorBoard with PyTorch
In this example, we will be using one of the pre-built Deephaven Docker images: Python with PyTorch. If you need detailed instructions on how to launch Deephaven from pre-built images, please see this guide.
Classification example
We will classify the Iris dataset with Deephaven tables and use the same Keras neural network we built in our how-to use PyTorch guide. We will only need to add a few lines of code to enable TensorBoard!
First, we need to create a SummaryWriter instance to log data for consumption and visualization by TensorBoard:
Writer will output to ./runs/ directory by default.
Second, we need to run TensorBoard and provide the log directory and port number:
After that, your TensorBoard dashboard will be available via the browser using the following URL: http://localhost:6006
The TensorBoard dashboard is not active yet. To have some meaningful information in it, let's use our SummaryWriter to write the model evaluation features that we want, e.g. loss:
The complete script looks like this:
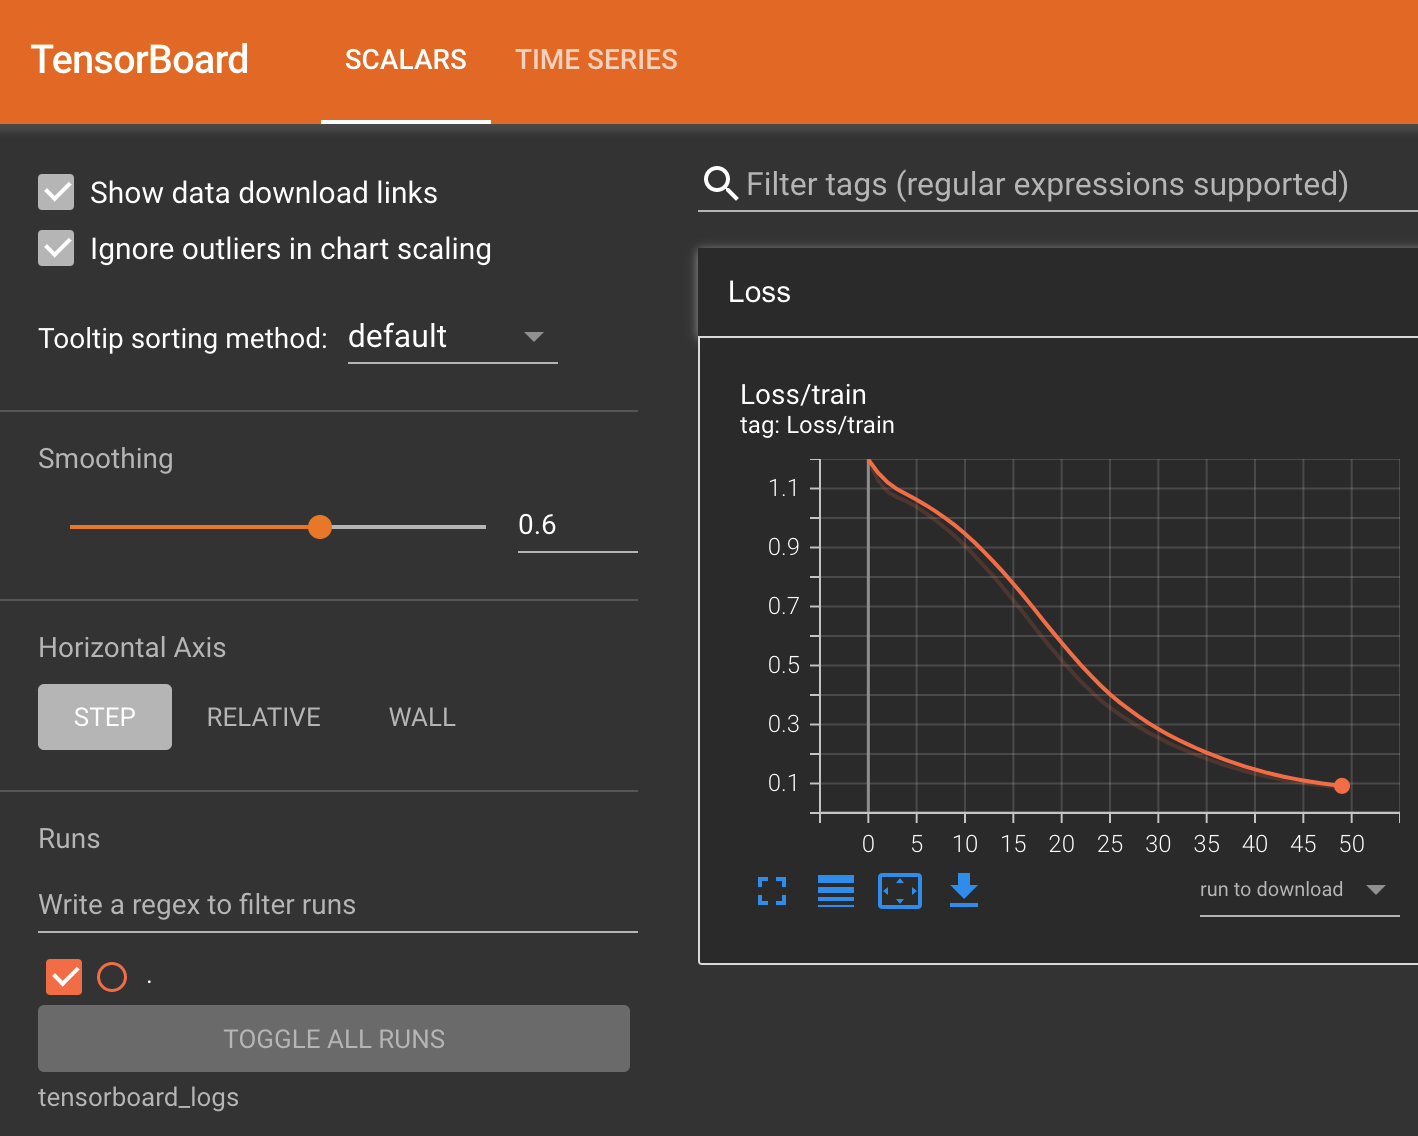
After training the model, you can open the Tensorboard dashboard with http://localhost:6006 and see the results of your neutral networks training runs:
You can also use TensorBoard to check the distribution of the weights and biases over each epoch, visualize any vector representation (e.g., word embeddings and images), track the performance of every TensorFlow operation that has been executed, monitor hyperparameters, and more.