Real-time intrusion detection: flag attacks in milliseconds, not minutes
Build a streaming intrusion detection system in Deephaven that computes behavioral baselines and flags anomalies as each flow arrives — port scans, beaconing, and exfiltration detected before attackers move laterally.
July 31 2028


Your security alert fires — 47 minutes after the attacker already broke into three servers. By the time you see it, they're long gone.
Most security tools check logs on a schedule. Whether checks run every 5 minutes or every hour, the delay in between is a window of opportunity for hackers. A real-time system watches every network connection as it happens and flags suspicious activity immediately.
This post builds a live intrusion detection system in Deephaven. You'll simulate network traffic, track what "normal" looks like for each device, and detect three attack patterns — all updating continuously as data arrives.
The data: network flow records
Network flow data (NetFlow, IPFIX, sFlow) summarizes connections without storing full packet payloads. Each record captures a source IP, destination IP, ports, protocol, byte counts, and timestamps. That's enough for traffic analysis at scale.
Note
The code in this post runs in a Deephaven console. If you don't have Deephaven running yet, see the quickstart guide — Docker or pip, under five minutes.
Tip
The simulation below includes intentional attack patterns — port scanning, beaconing, and data exfiltration — so you can see the detectors populate with meaningful results. In production, you'd connect to real NetFlow sources instead.
Let's simulate a flow stream. The time_table function creates a ticking table that emits a new row at each interval — here, every 100ms. The chained update call computes columns for each row using formulas written in Deephaven's query language:
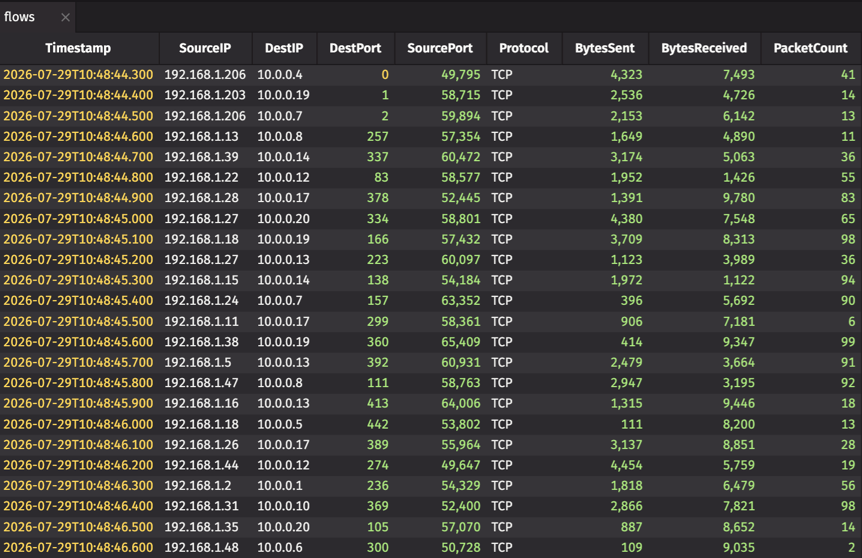
This creates a ticking table with ~10 flows per second. The simulated attackers (192.168.1.201-206) exhibit port scanning, beaconing, and large outbound transfers. Give the simulation 3-5 minutes to accumulate enough data for the detectors to populate.
Every flow carries its own context: how does this transfer compare to what's normal for this source?
Establishing baselines with rolling statistics
Anomaly detection requires knowing what's normal. Most streaming platforms make you choose: either recompute statistics from scratch on every update (slow), or maintain complex state management code (error-prone). Deephaven's update_by operations handle this natively — rolling windows update incrementally as each row arrives, with no extra code and no performance penalty.
Note that this video reverses the table, so you can see updates ticking in.
Every incoming flow now carries its context: how does this transfer compare to this source's recent behavior? A Z-score above 3 means this flow is more than three standard deviations from the source's norm — statistically rare and worth investigating.
Notice what's not here: no windowing boilerplate, no state checkpointing, no manual memory management. The engine handles incremental updates internally. When a new flow arrives, only the affected rolling windows recompute.
You write the detection logic. The engine handles the state.
Detecting attack patterns
With baselines established, we can layer on detection rules for specific attack signatures.
Port scan detection
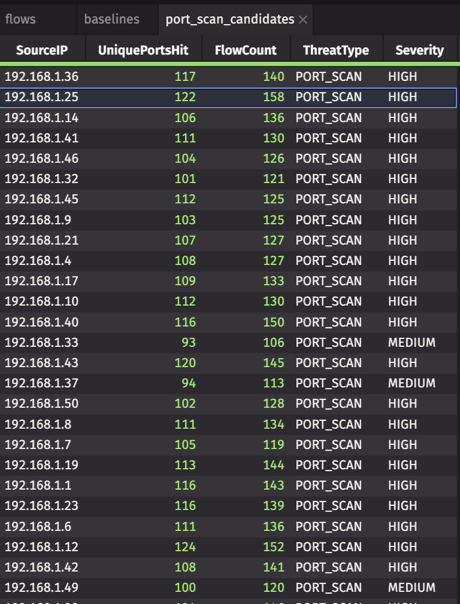
Port scans probe many ports on a target in rapid succession. The agg_by operation groups rows by SourceIP and computes aggregations — here, counting distinct ports and total flows. The where filter keeps only sources hitting many ports, and update_view adds classification columns:
Beaconing detection
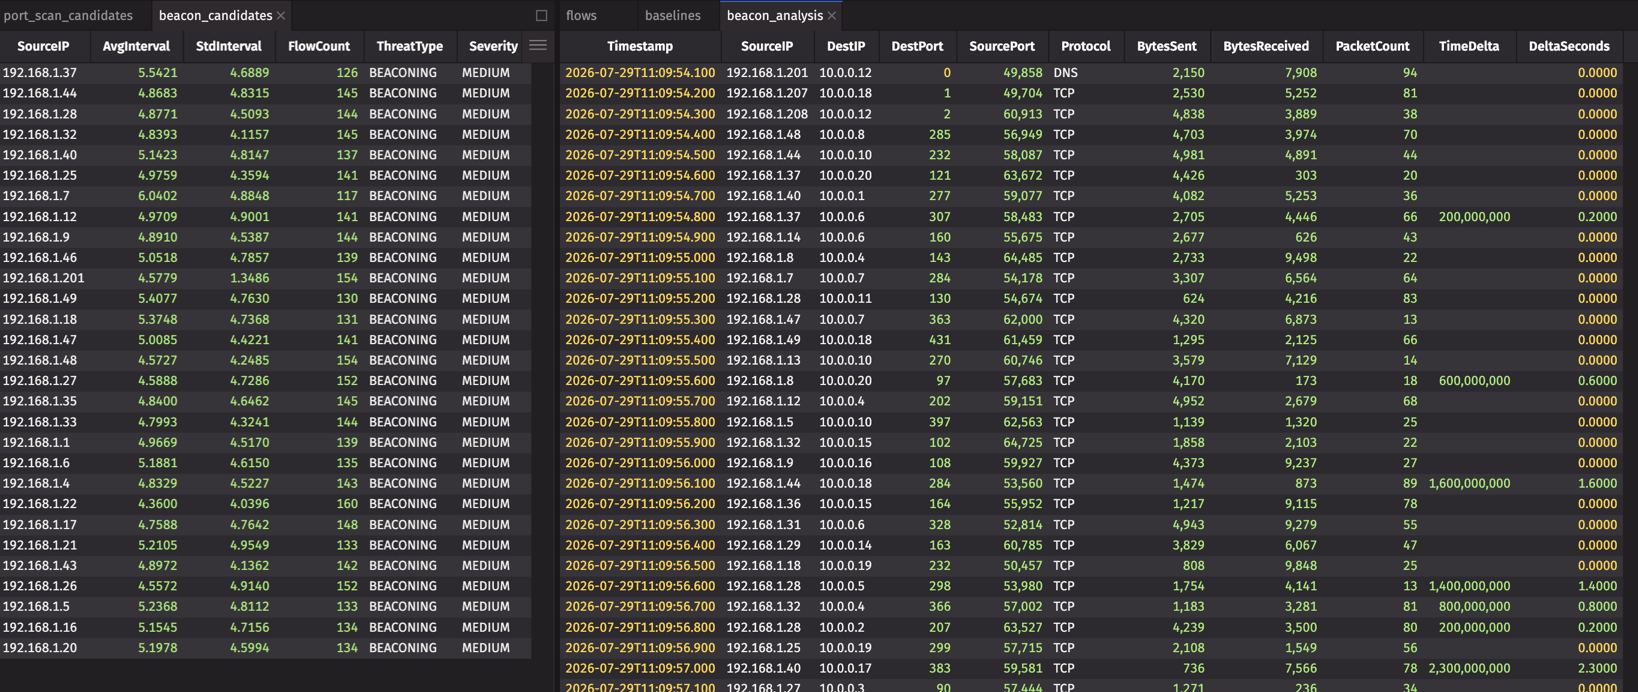
Command-and-control malware often "phones home" at regular intervals. We detect this using delta, which computes the difference between consecutive values — here, the time gap between each flow from the same source. Then we aggregate those gaps to find sources with suspiciously consistent timing:
Data exfiltration detection
Large outbound transfers may indicate data theft. This query filters for flows exceeding 100KB, then aggregates by source-destination pair to find sustained large transfers:
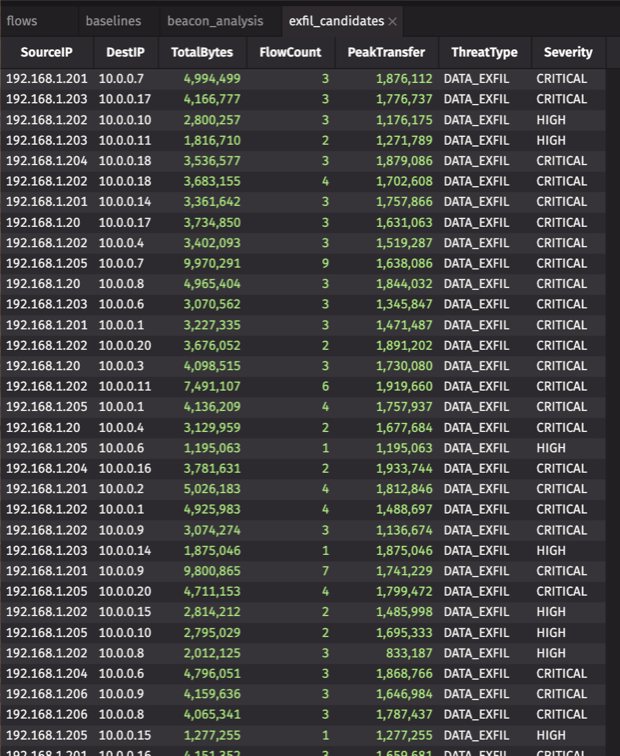
Unified alert stream
The merge operation combines multiple tables with the same schema into one. We extract matching columns from each detector, merge them, add a priority score, and sort to surface critical alerts first:
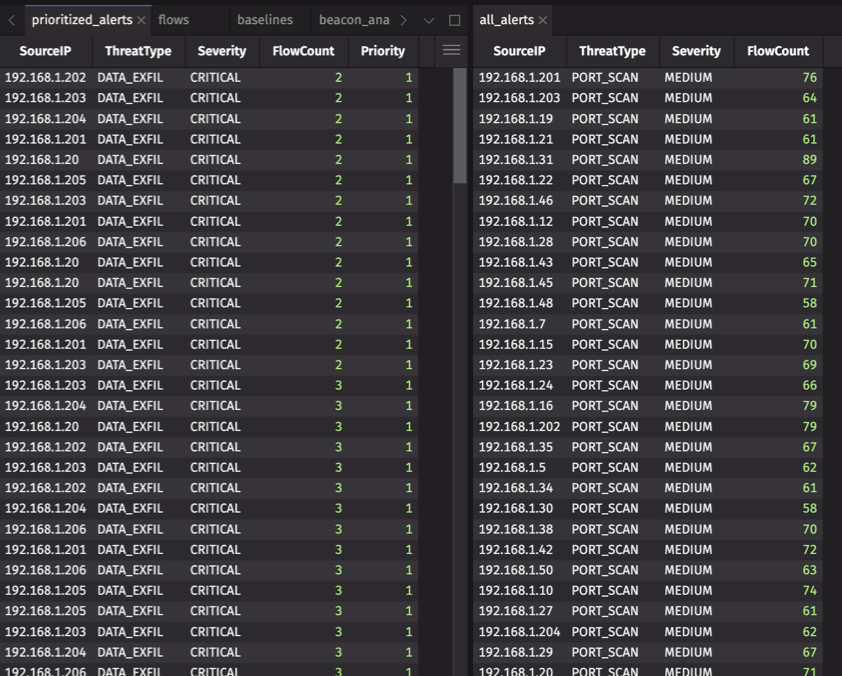
For a real analyst workstation, color-coded severity makes triage faster. The deephaven.ui library adds conditional formatting:
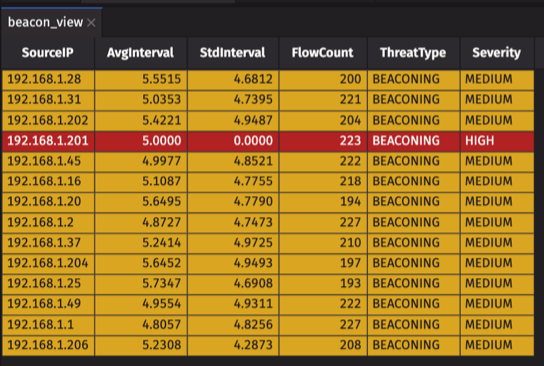
The true beaconing host (192.168.1.201, with near-zero timing variance) shows red; other candidates with higher variance show gold.
Threat dashboard
Detection logic is only half the story. Analysts need to see what's happening — and that's where deephaven.ui transforms your Python scripts into production dashboards.
You stay in Python — the same language you used for detection logic — and Deephaven renders a live, interactive dashboard that updates as your tables tick:
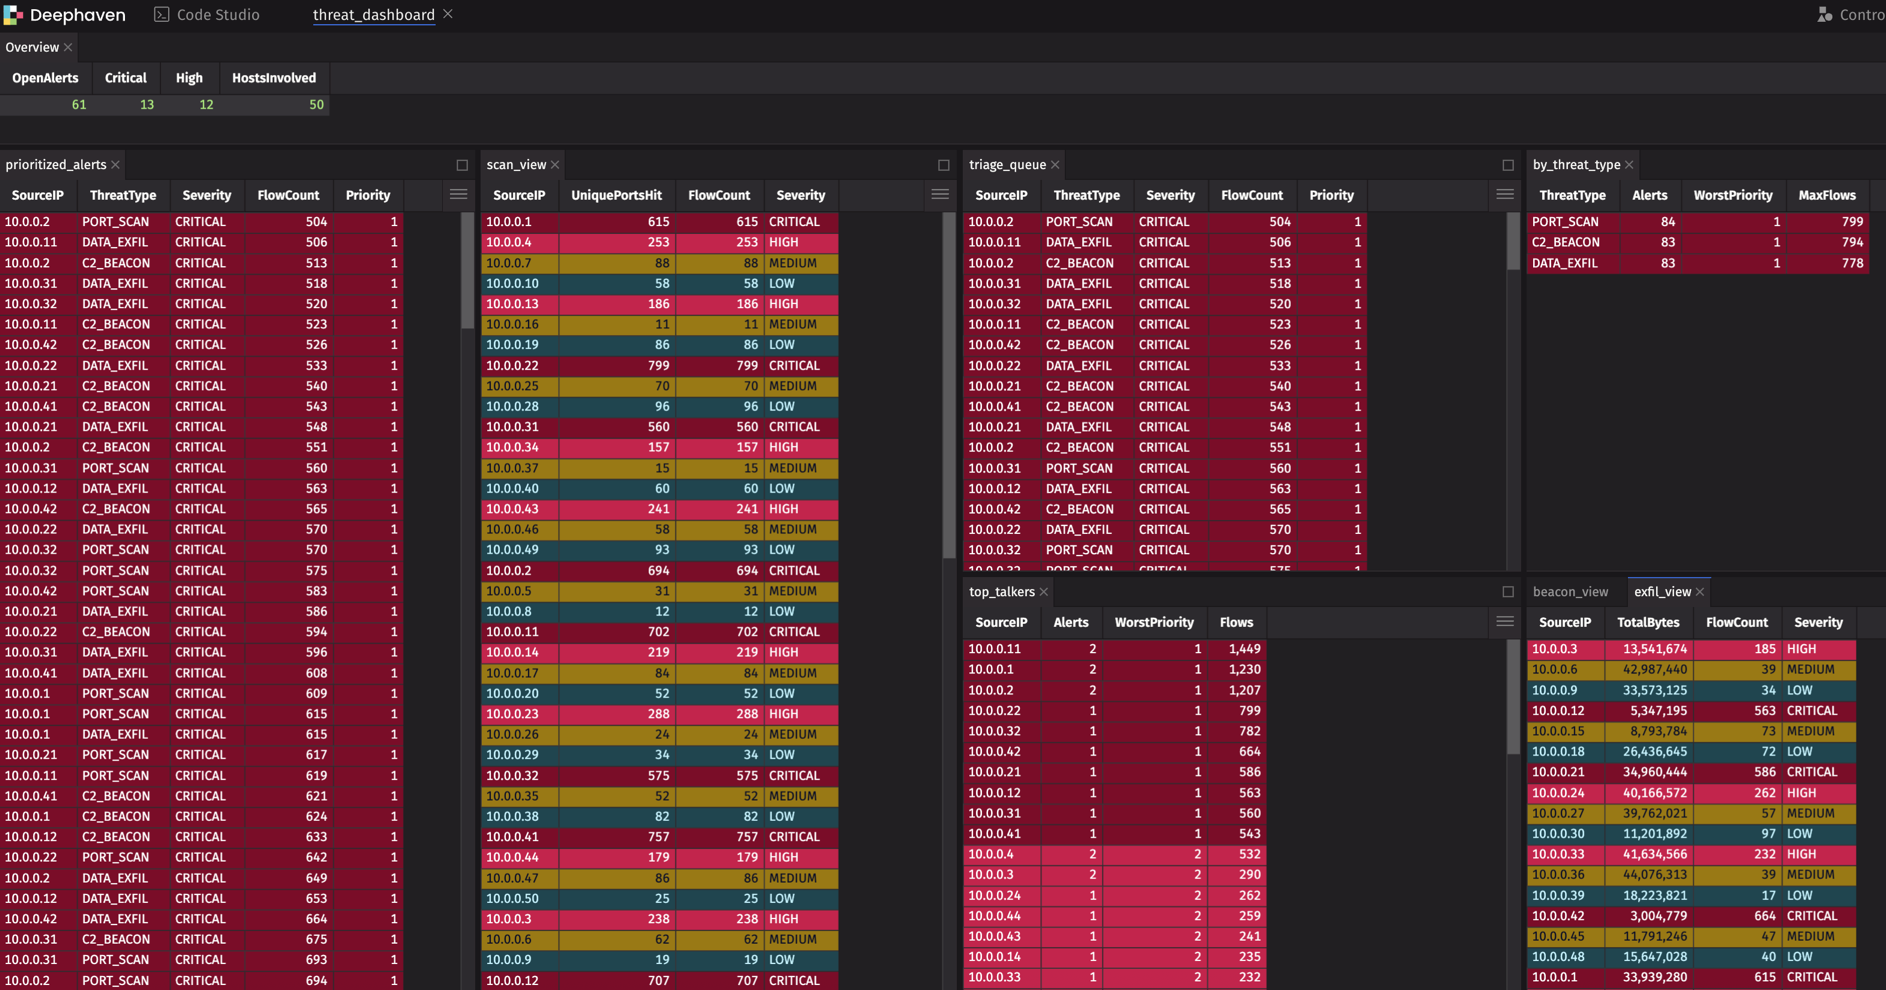
Every panel in this dashboard updates in real-time. The KPI counts tick up as new alerts arrive. The triage queue reorders as priorities change. The color-coded severity formatting — CRITICAL in dark red, HIGH in pink, MEDIUM in gold, LOW in teal — makes pattern recognition instant.
The dashboard includes:
- Overview KPI bar: Open alerts, critical/high counts, hosts involved
- Tabbed detector views: Switch between prioritized alerts and individual detector outputs
- Triage queue: Filtered to CRITICAL and HIGH severity for immediate attention
- Summary panels: Alerts by threat type and top talkers by flow volume
Here's a reference layout using deephaven.ui. This snippet shows a more complete dashboard than the tables we've built — including KPI summaries, triage queues, and aggregations by threat type. Use it as a template for your own dashboards:
The ui.dashboard arranges panels in rows and columns with relative sizing. Wrap multiple panels in ui.stack to create tabbed views. The width and height parameters control relative proportions — here, 50/25/25 for a three-column layout.
The same Python code that defines your detection logic also defines your dashboard. Change a query, and the visualization updates automatically.
Adding threat intelligence
Real-world IDS systems correlate against known-bad indicators. The natural_join operation matches each flow's destination IP against a threat intelligence table, pulling in threat metadata for any matches:
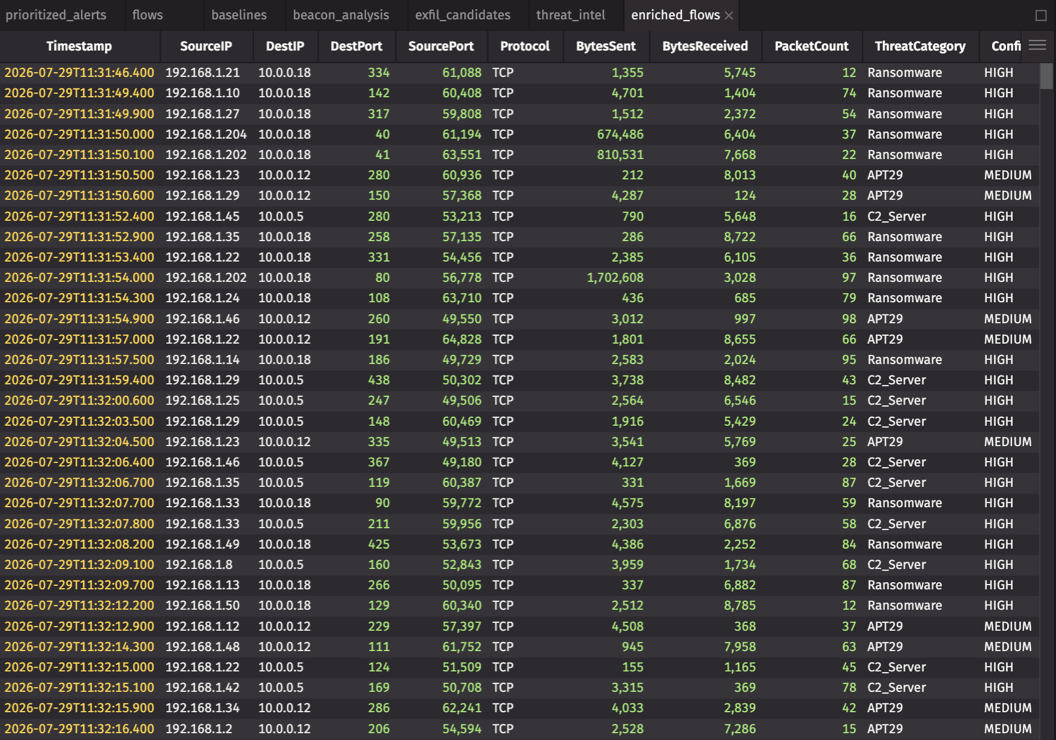
Now any flow to a known-malicious IP is flagged instantly with context about the threat actor.
When the threat feed updates, every downstream table — alerts, dashboards, escalations — updates automatically.
Why streaming beats batch
Traditional SIEMs run detection queries on a schedule — every 5 minutes, every hour. That lag creates a window where attackers operate undetected.
| Batch approach | Streaming approach |
|---|---|
| Query runs on schedule | Detection runs continuously |
| Alert delay = batch interval | Alert delay = milliseconds |
| Historical context requires separate queries | Rolling statistics built into every row |
| Scaling requires bigger batches | Scaling is horizontal and incremental |
But "streaming" alone isn't the differentiator. Kafka, Flink, and Spark Streaming all process data continuously. The difference is how you build detection logic:
- Flink/Spark: Write Java or Scala, manage state explicitly, deploy compiled jobs. Iteration cycles measured in hours.
- kdb+/q: Powerful but specialized syntax with a steep learning curve. Limited Python ecosystem integration.
- Custom pipelines: Glue together Kafka, Redis, and a rules engine. Maintain three systems instead of one.
- Deephaven: Write Python. Tables update incrementally — rolling statistics, joins, and aggregations are just table operations. Change a threshold, see results immediately. The same code runs on historical data for backtesting and live feeds for production.
That last point matters for security teams: you can develop and tune detection rules against last month's logs, then deploy the identical queries against live traffic. No rewrite, no translation layer.
Try it yourself
The full notebook runs in any Deephaven instance. Launch our free demo sandbox (no install) or install Deephaven locally, paste the code blocks above, and watch the alerts tick in as simulated attacks unfold.
For production deployments:
- Replace the simulated
time_tablewith your actual NetFlow source (Kafka, syslog, database subscription). - Tune detection thresholds based on your network's baseline.
- Add deephaven.ui dashboards for analyst workstations.
The detection logic stays the same whether you're processing 100 flows per second in a lab or 100,000 per second in a SOC — and unlike micro-batch systems, latency doesn't degrade as volume increases.
Have questions or want to share what you're building? Join the conversation on Slack.