Debug Docker-run Deephaven with PyCharm
This guide shows you how to set up PyCharm's remote debugging server to debug Deephaven code running in a Docker container.
When Deephaven runs in Docker, the engine and user code execute inside a Docker container. Debugging uses the remote debugging server in PyCharm. PyCharm listens on a port on your machine. Code you run in Deephaven connects out to that port by calling settrace from the pydevd debugger package inside the container.
Warning
Use PyCharm 2024 or later. Debugging Deephaven with PyCharm 2023 has known problems.
Note
PyCharm's remote debugging server is a paid feature. In releases before 2025.1, it was part of PyCharm Professional. PyCharm 2025.1 and later ship as a single product, with the remote debugging server among its Pro subscription features.
1. Define a Deephaven image with pydevd
Remote debugging in PyCharm requires the pydevd Python package in the Docker container where the Deephaven server runs. In this step, you create the files that define a Deephaven image with pydevd installed. Step 4 builds it.
Create a new, empty directory with an empty data subdirectory, and place these three files in it:
requirements.txt
Dockerfile
docker-compose.yml
The extra_hosts entry lets the container reach your machine at host.docker.internal, which step 4 uses. Docker Desktop defines this hostname on its own, but Docker Engine on Linux needs the entry.
Note
The -DAuthHandlers=io.deephaven.auth.AnonymousAuthenticationHandler setting in this docker-compose.yml enables anonymous authentication, which lets any client connect without a password. With it enabled, you can open the Deephaven IDE without a pre-shared key. It is a convenience, not a requirement for the debugger.
The 127.0.0.1: prefix in the ports entry publishes port 10000 only on your own machine, so other computers on your network can't reach the server. Keep the 127.0.0.1: prefix while anonymous authentication is enabled.
Note
To try pydevd without building an image, replace build: . with image: ghcr.io/deephaven/server:latest in docker-compose.yml. After step 4 starts the container, and before you run the settrace code, install pydevd into it. Run docker compose exec deephaven pip install pydevd from the project directory in a second terminal, since docker compose up keeps the first one busy.
The package lasts only as long as the container. Reinstall it whenever the container is recreated, for example after docker compose down.
2. Create a PyCharm project
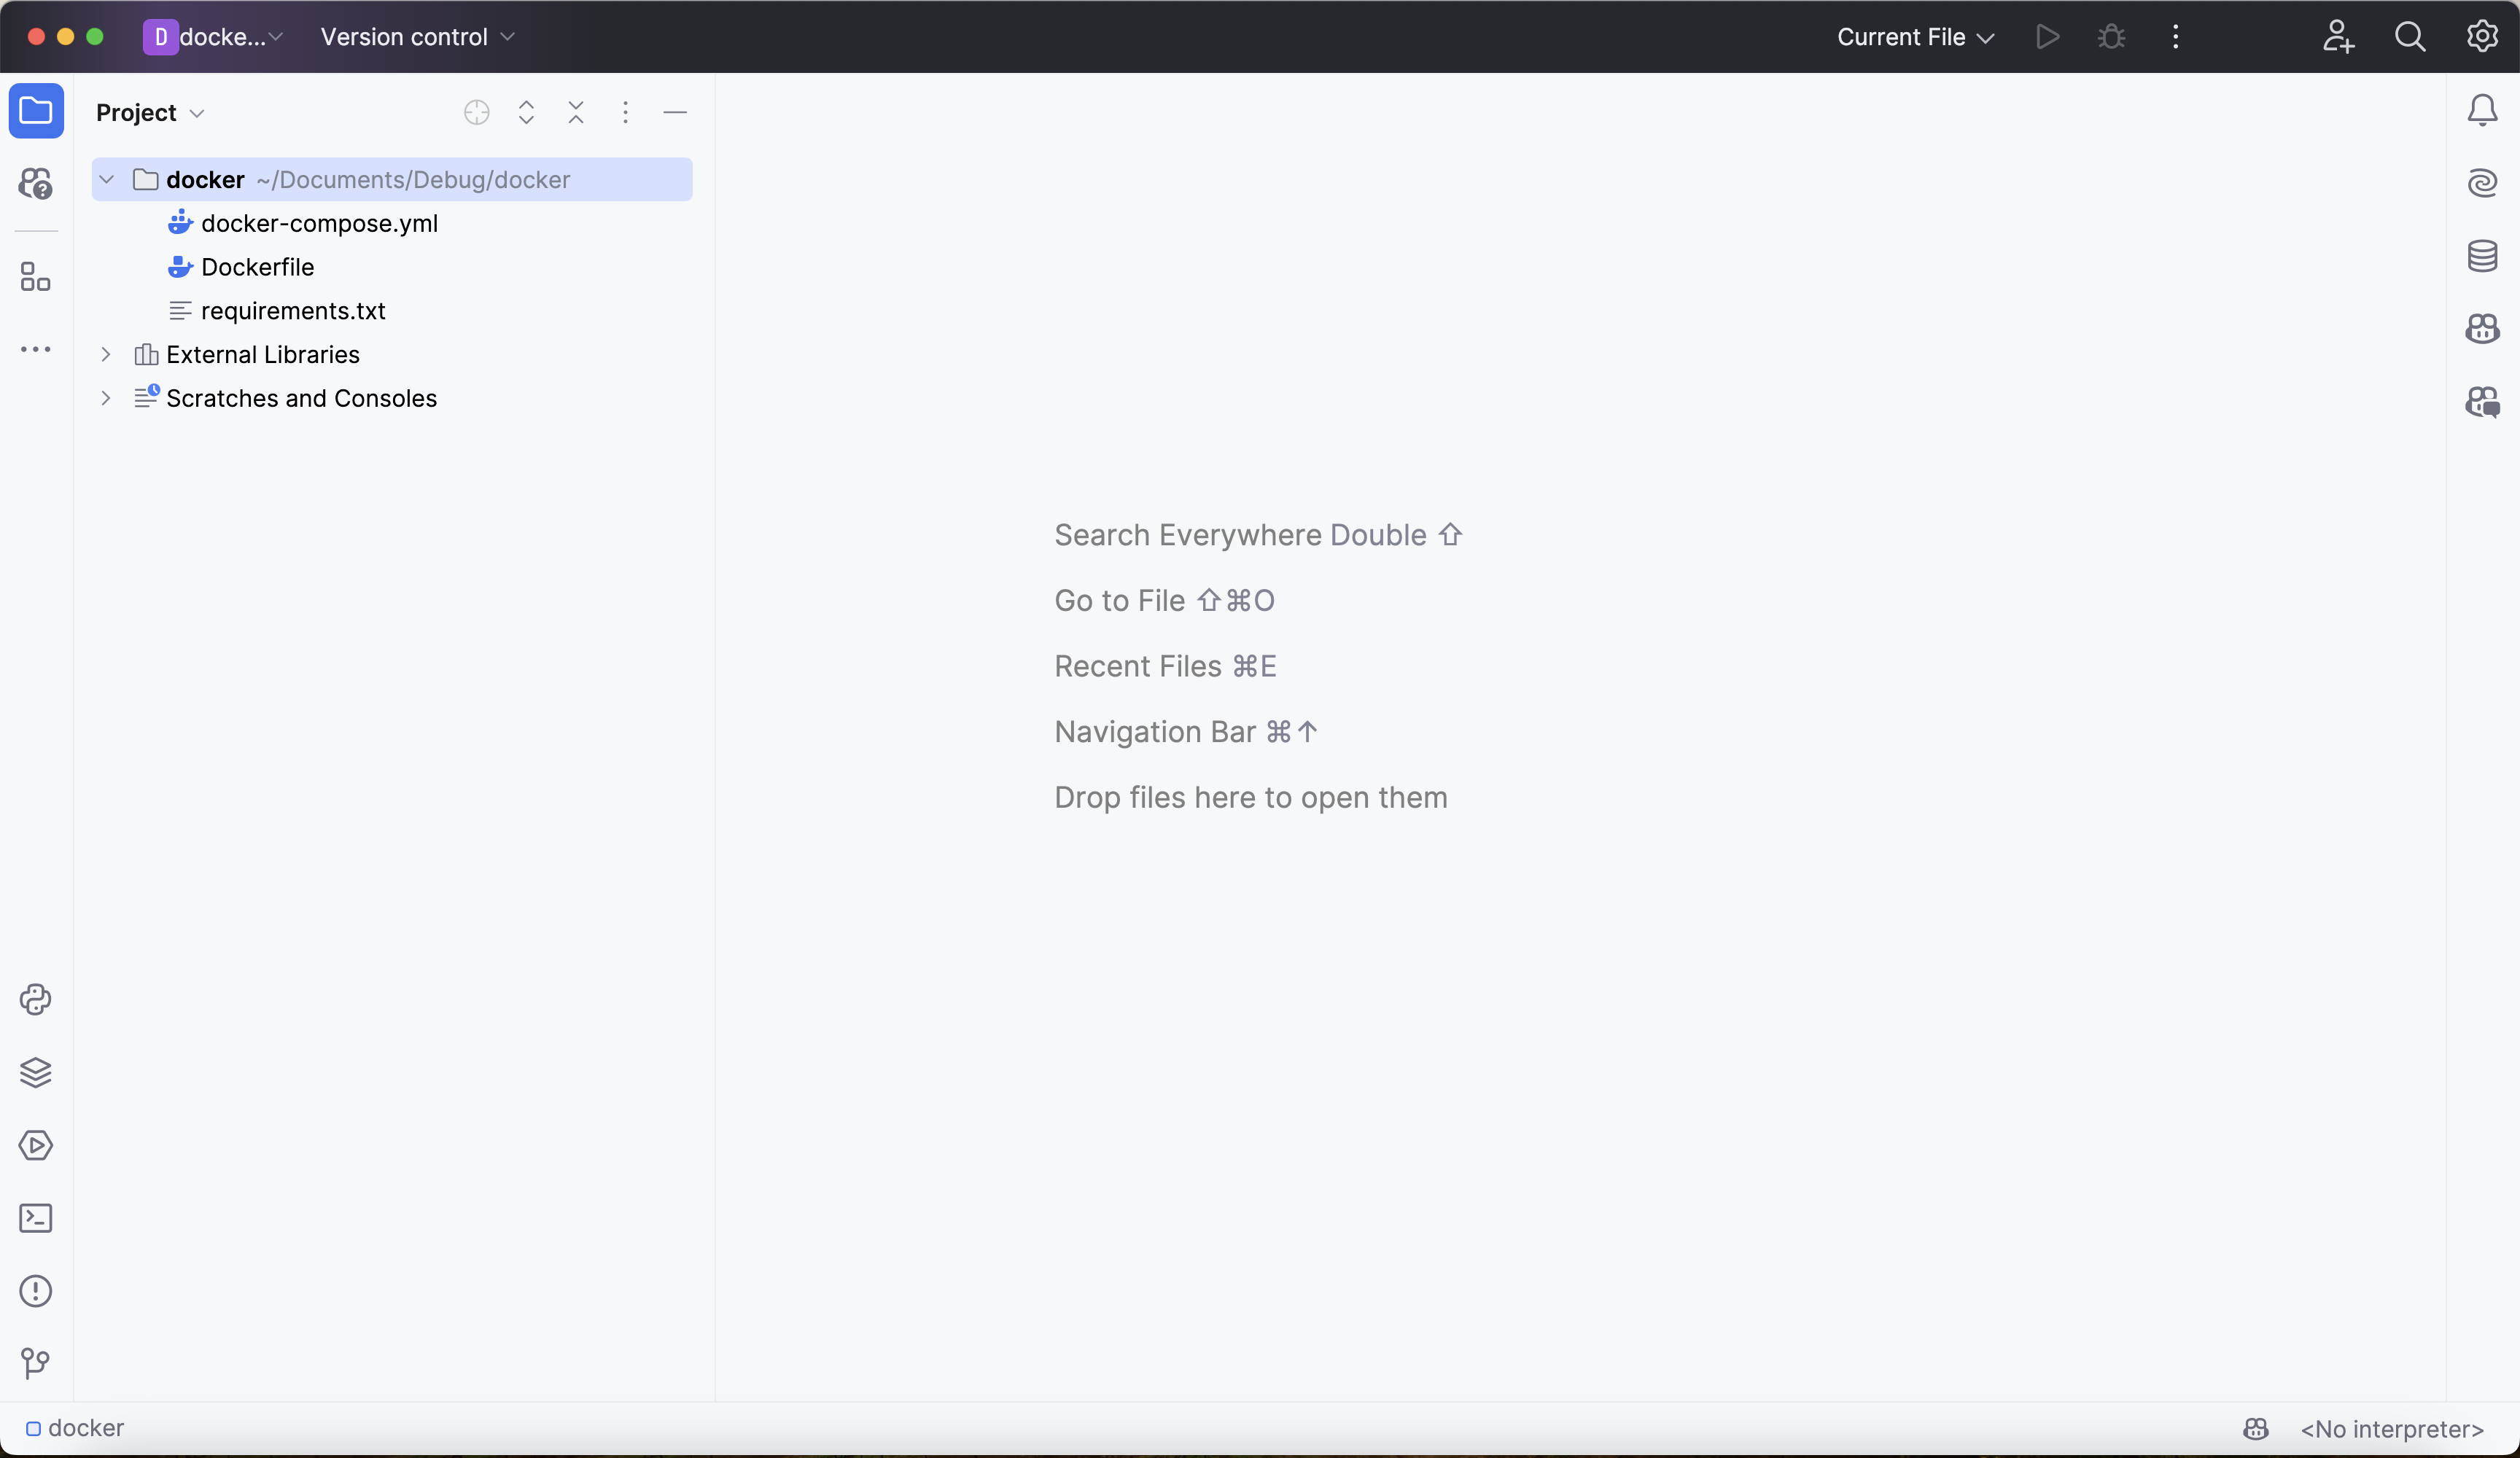
PyCharm's debugger runs only inside a PyCharm project. In PyCharm, select File > Open and open the directory you created in step 1 as a new project. The new project should look like this:
3. Create a Python Debug Server configuration
Next, create a Python Debug Server run configuration. It sets the port that PyCharm's remote debugging server listens on.
Go to Run > Edit Configurations to open the Run/Debug Configurations window. Click + in the top-left corner, then scroll down the list of configuration types and select Python Debug Server:
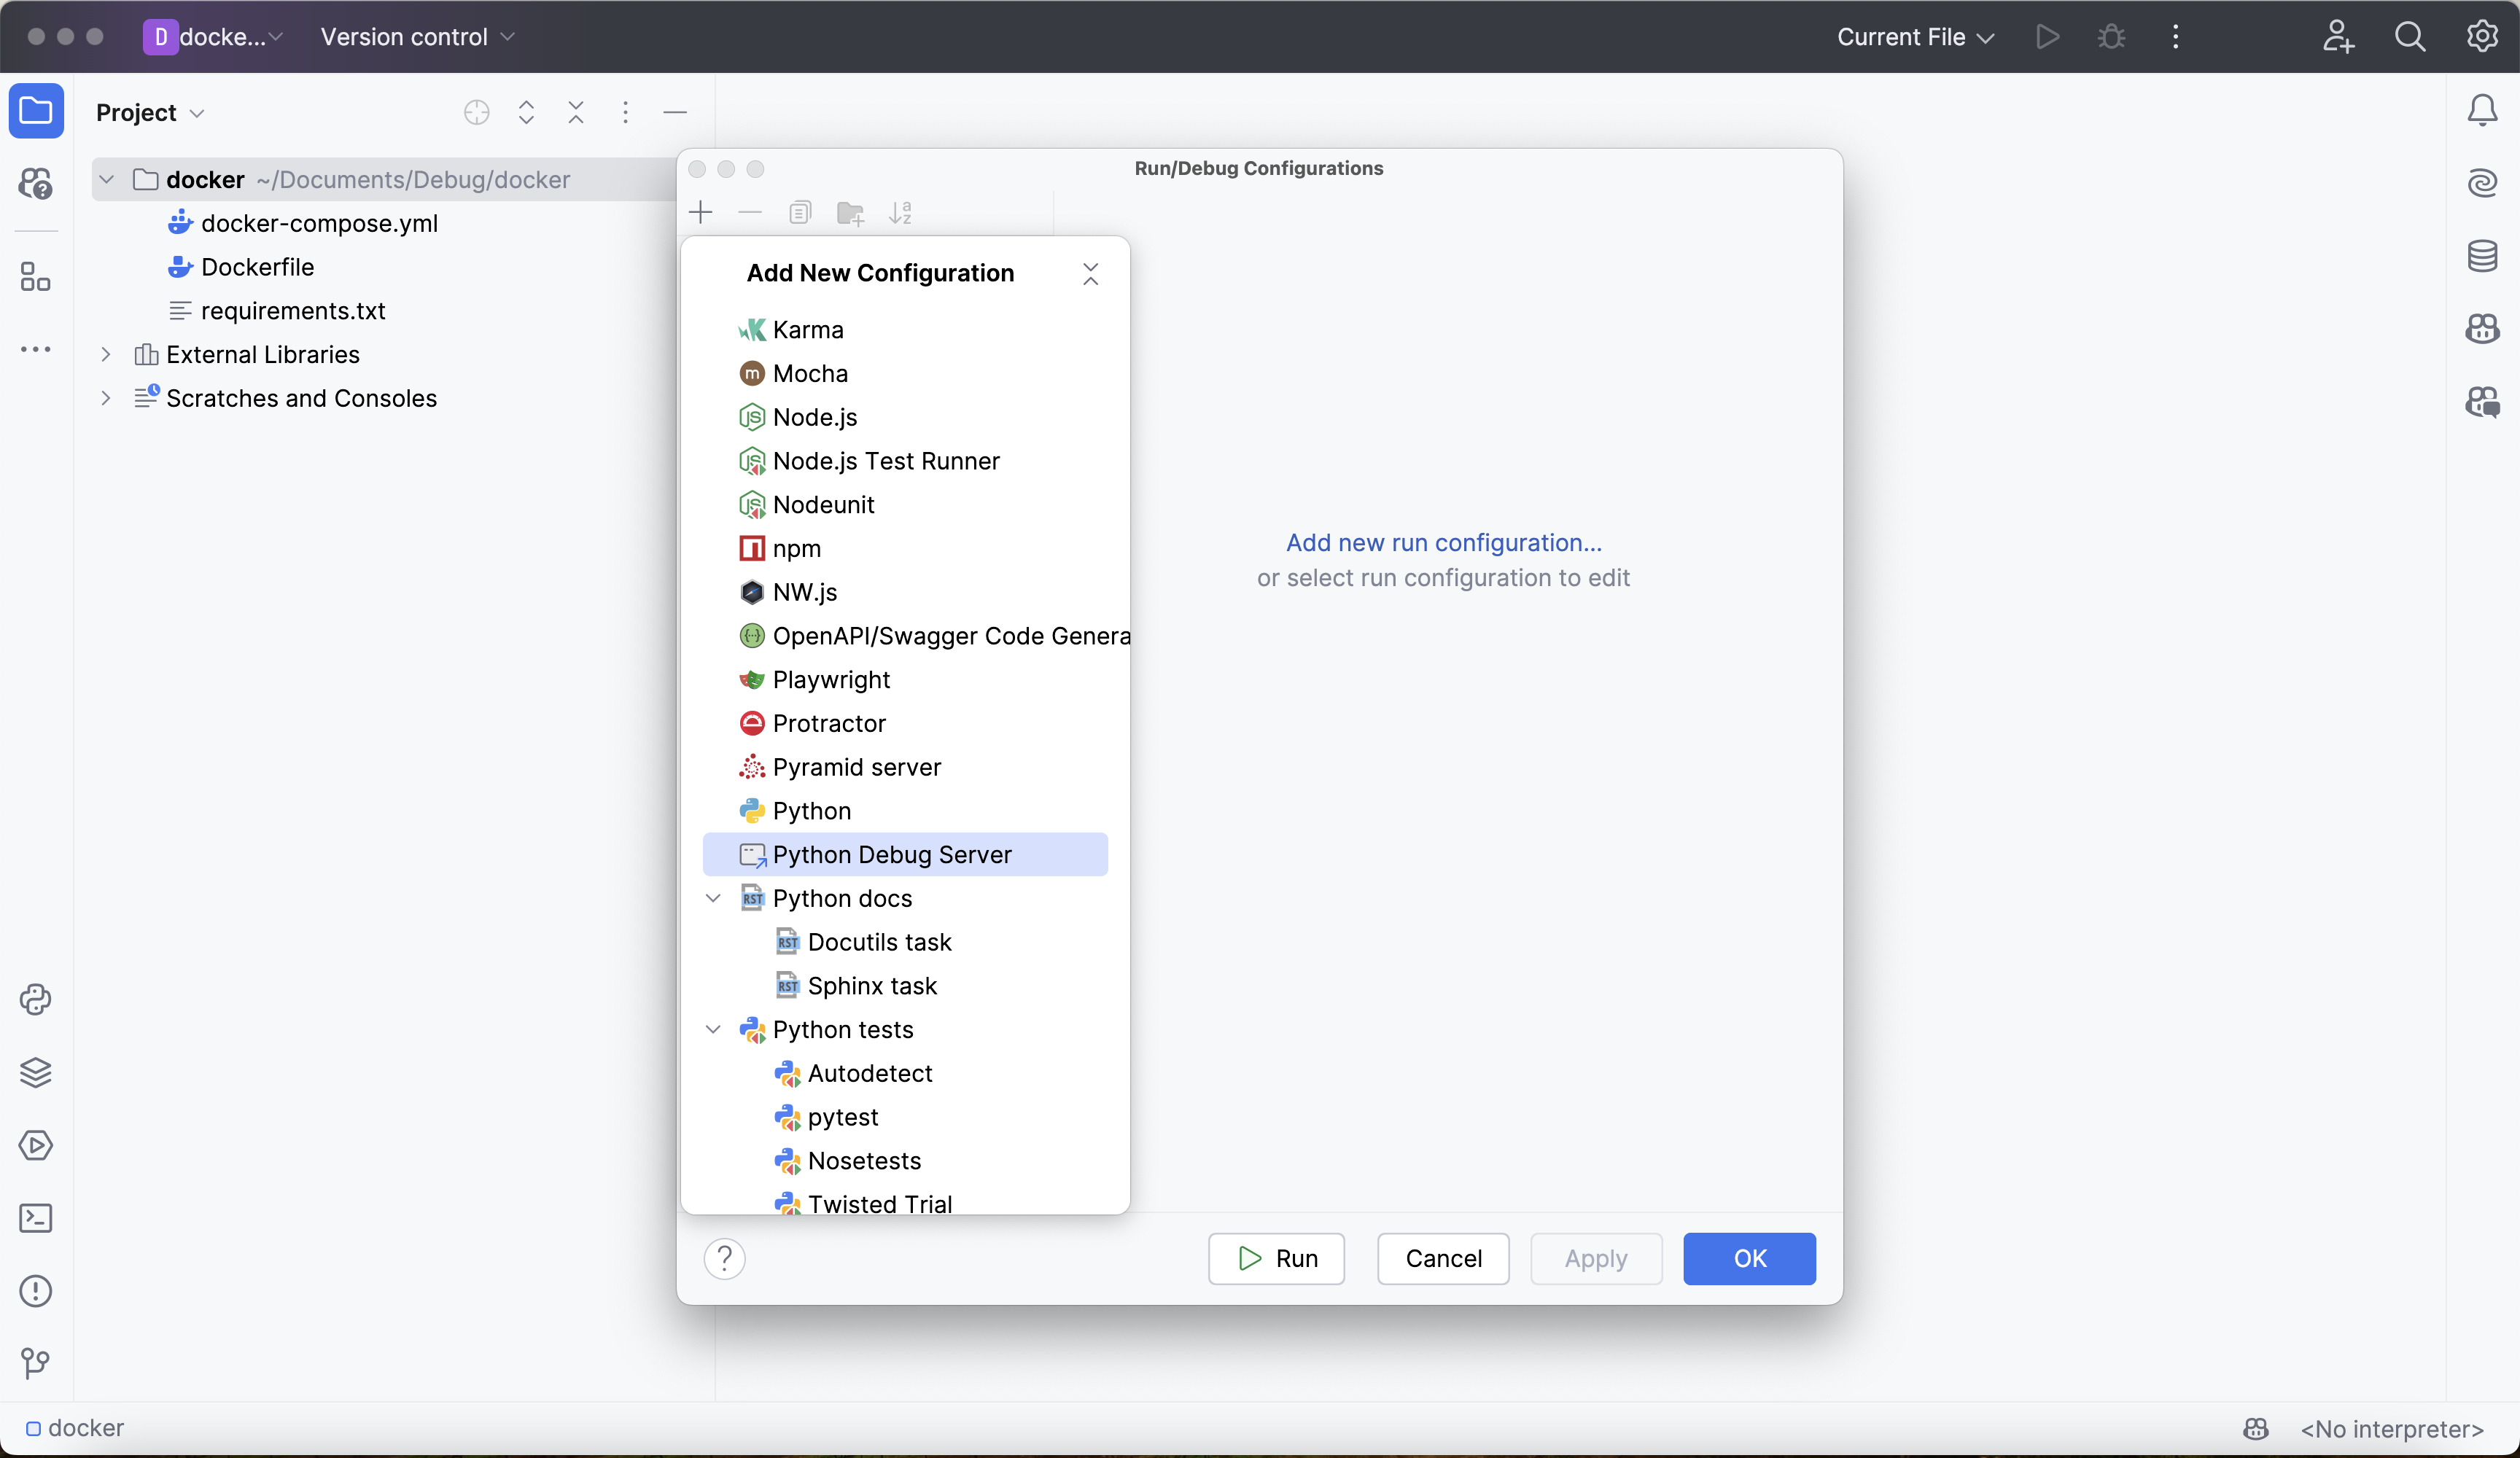
Give the configuration a reasonable, memorable name, like docker-debugging-server.
Set the following fields:
- IDE host name:
localhost - Port:
4444. Any unused port works if it differs from the Deephaven server's port, which is10000by default.
Above these fields, PyCharm shows an install command and a pydevd_pycharm.settrace('localhost', ...) call. Don't copy them. Inside the container, localhost means the container itself, not your machine.
Step 4 connects with pydevd.settrace("host.docker.internal", ...) instead, using the pydevd package the step 1 image installs.
Finally, use the Path mappings field so PyCharm can match Python files on your machine to the same files in the container. The docker-compose.yml file from step 1 mounts the project's data directory into the container at /data, so map those two paths:
- Local path: The absolute path to the
datadirectory in your PyCharm project (for example,/Users/yourname/docker-debug-project/data). - Remote path:
/data.
The mapping matters only when you debug Python files in the mounted data directory. It isn't needed for code you run from the Deephaven console.
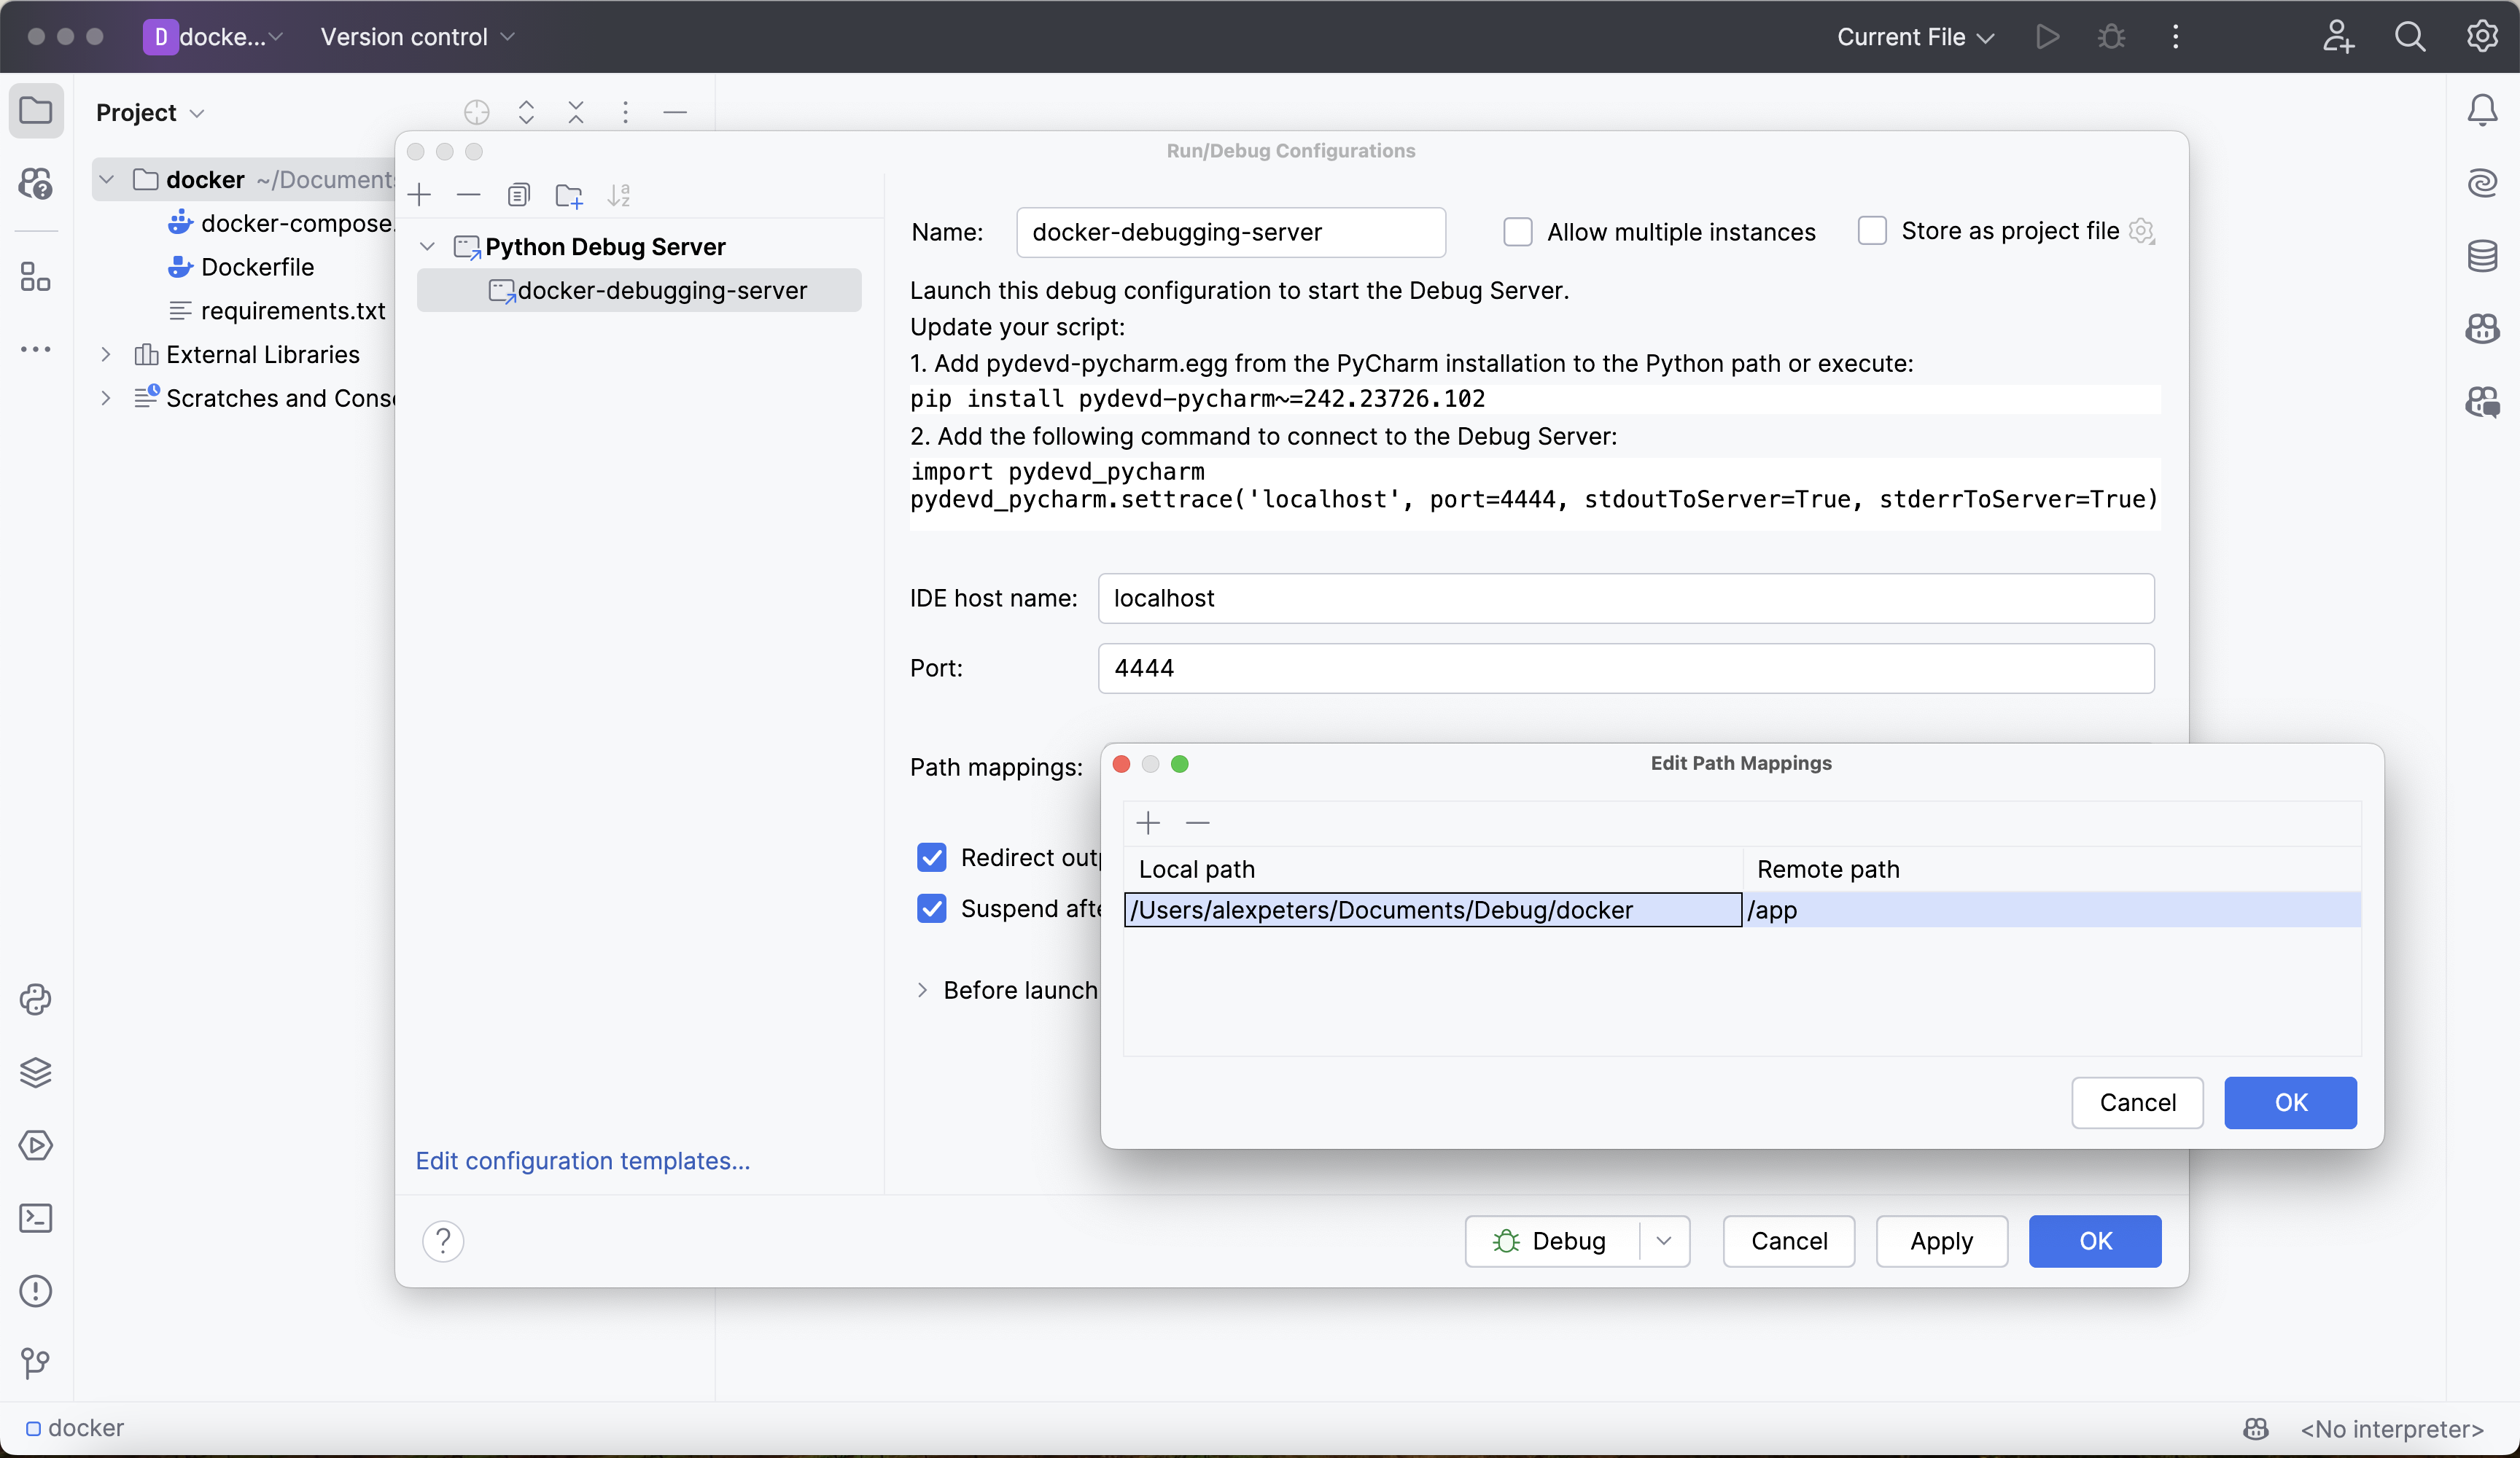
Click Apply and OK to save the configuration. Step 4 starts the debug server and then the Deephaven server.
4. Attach the debugger to Deephaven
Click the small green bug icon in the window's top-right corner to start the debugger. PyCharm opens a debugging console:
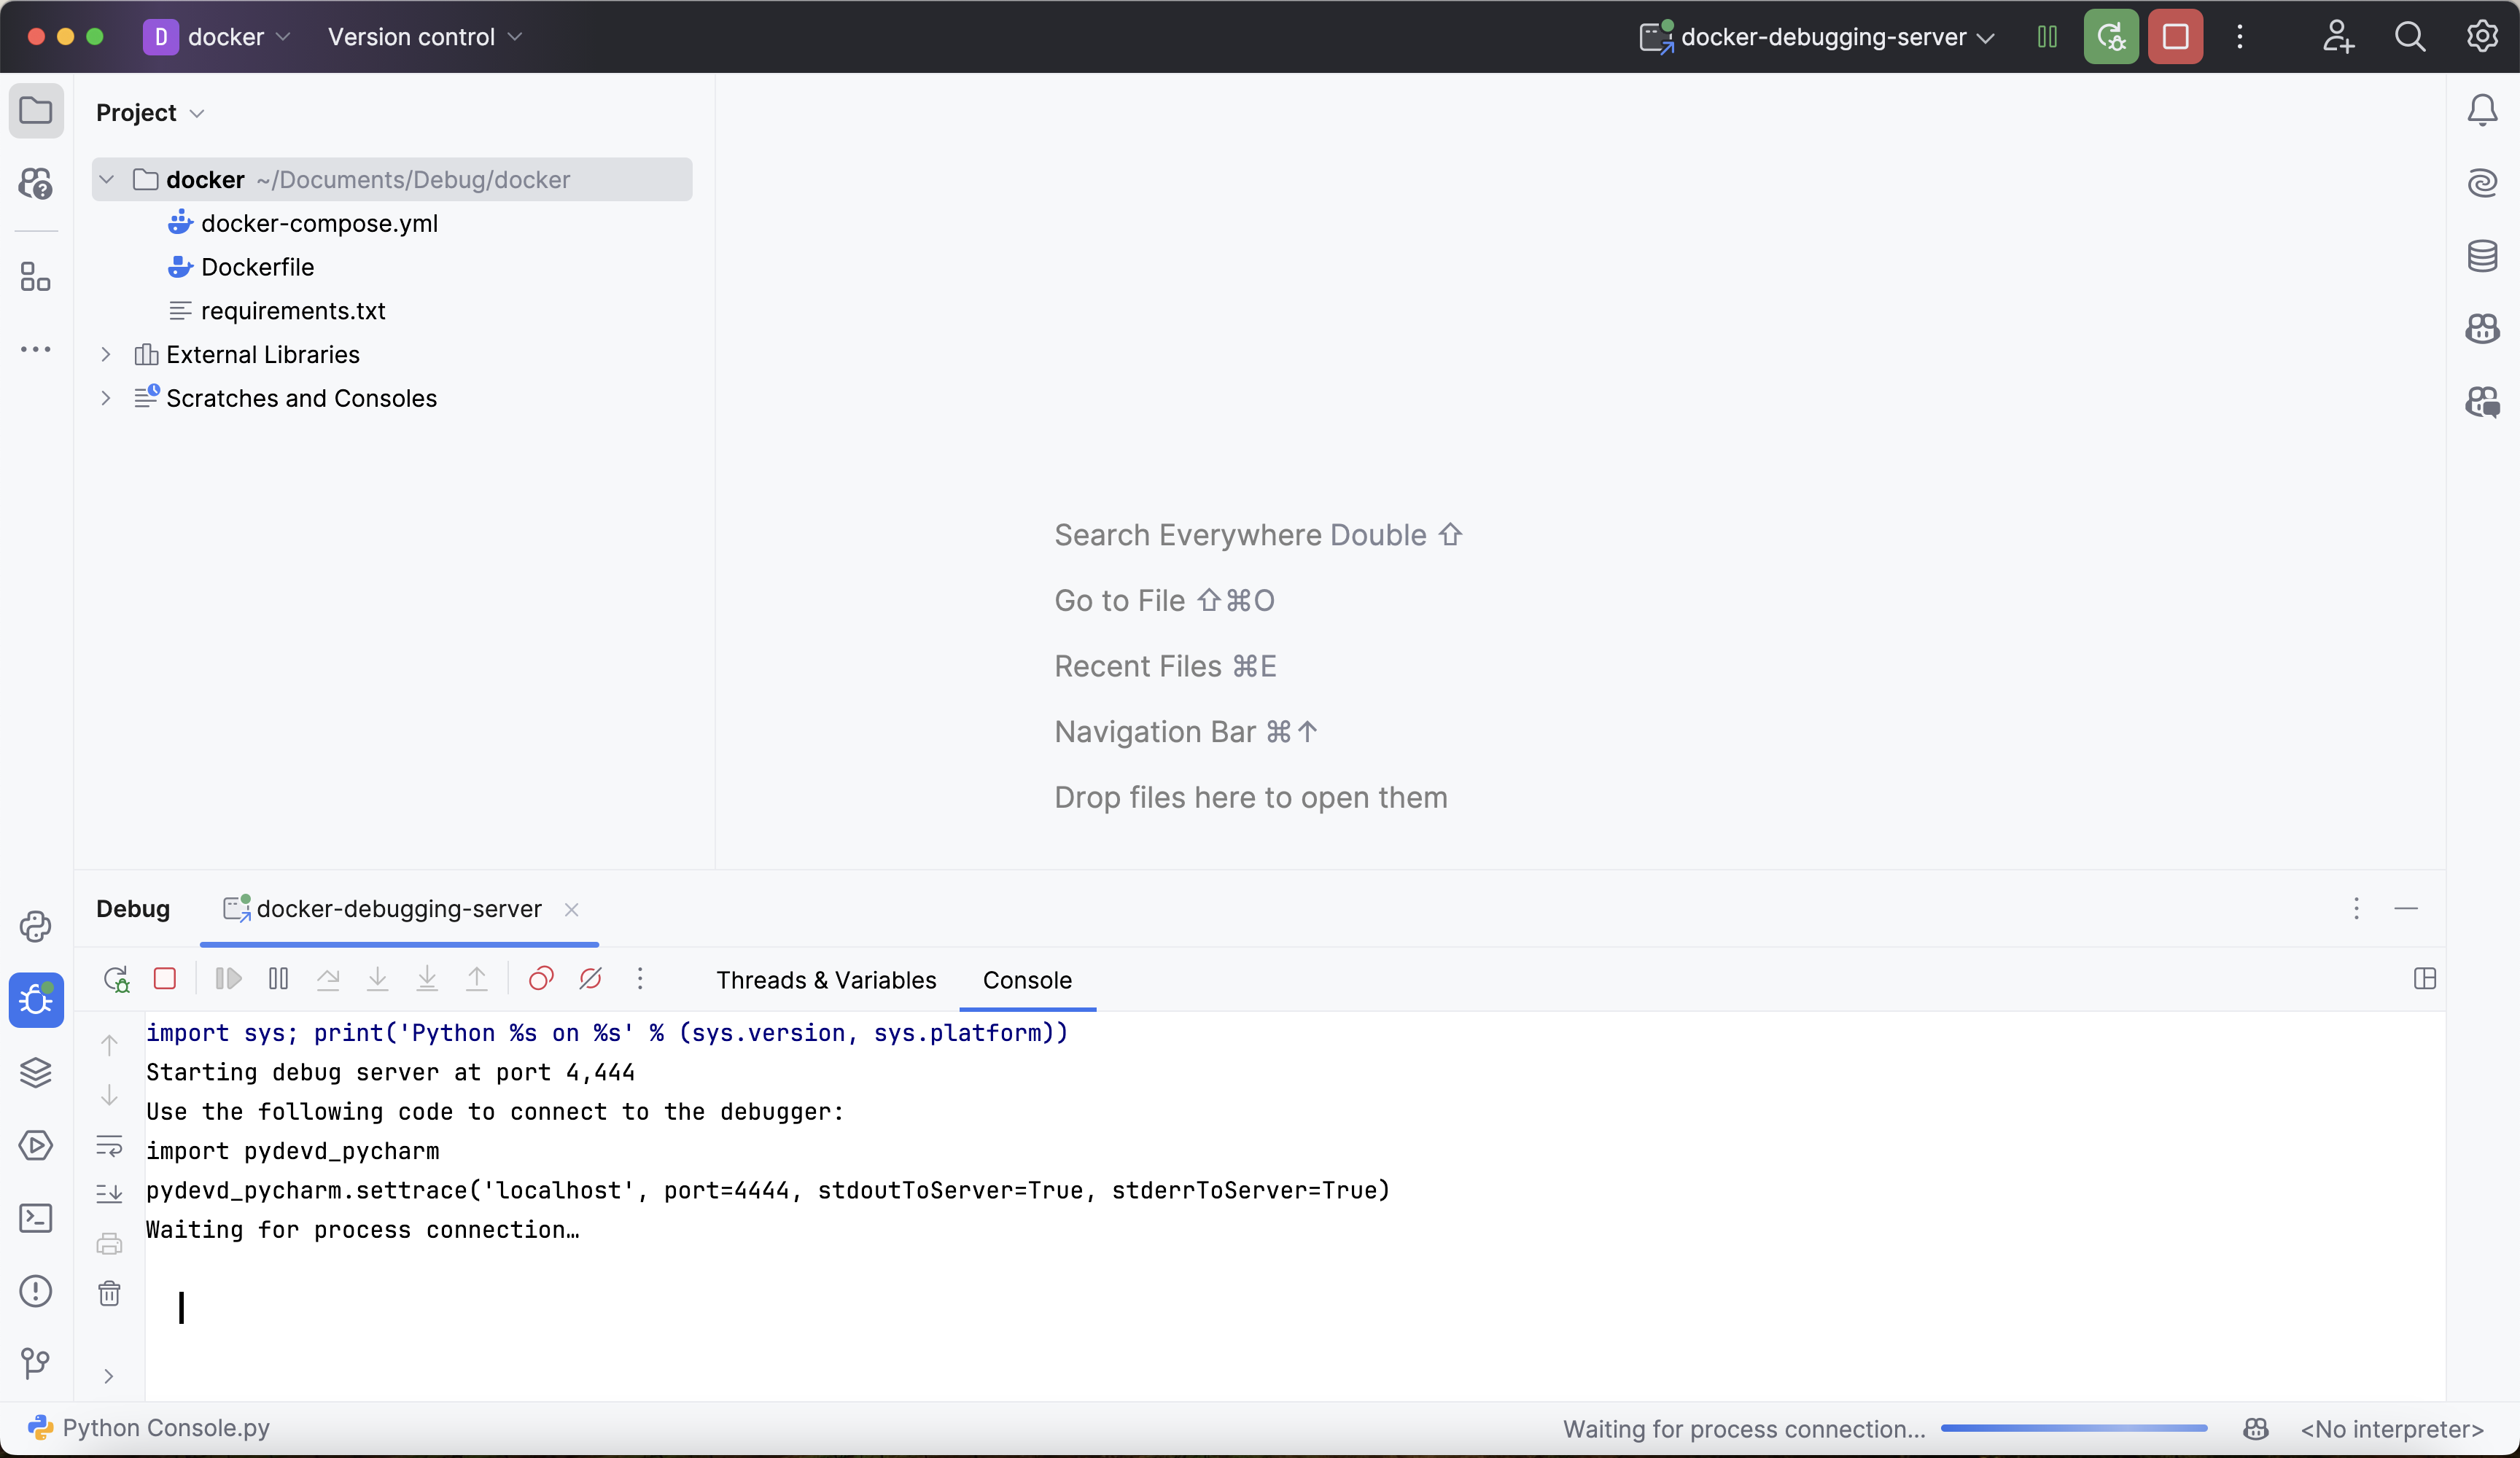
The output above ends with "Waiting for process connection...", so the debugger is not yet attached to the Deephaven process.
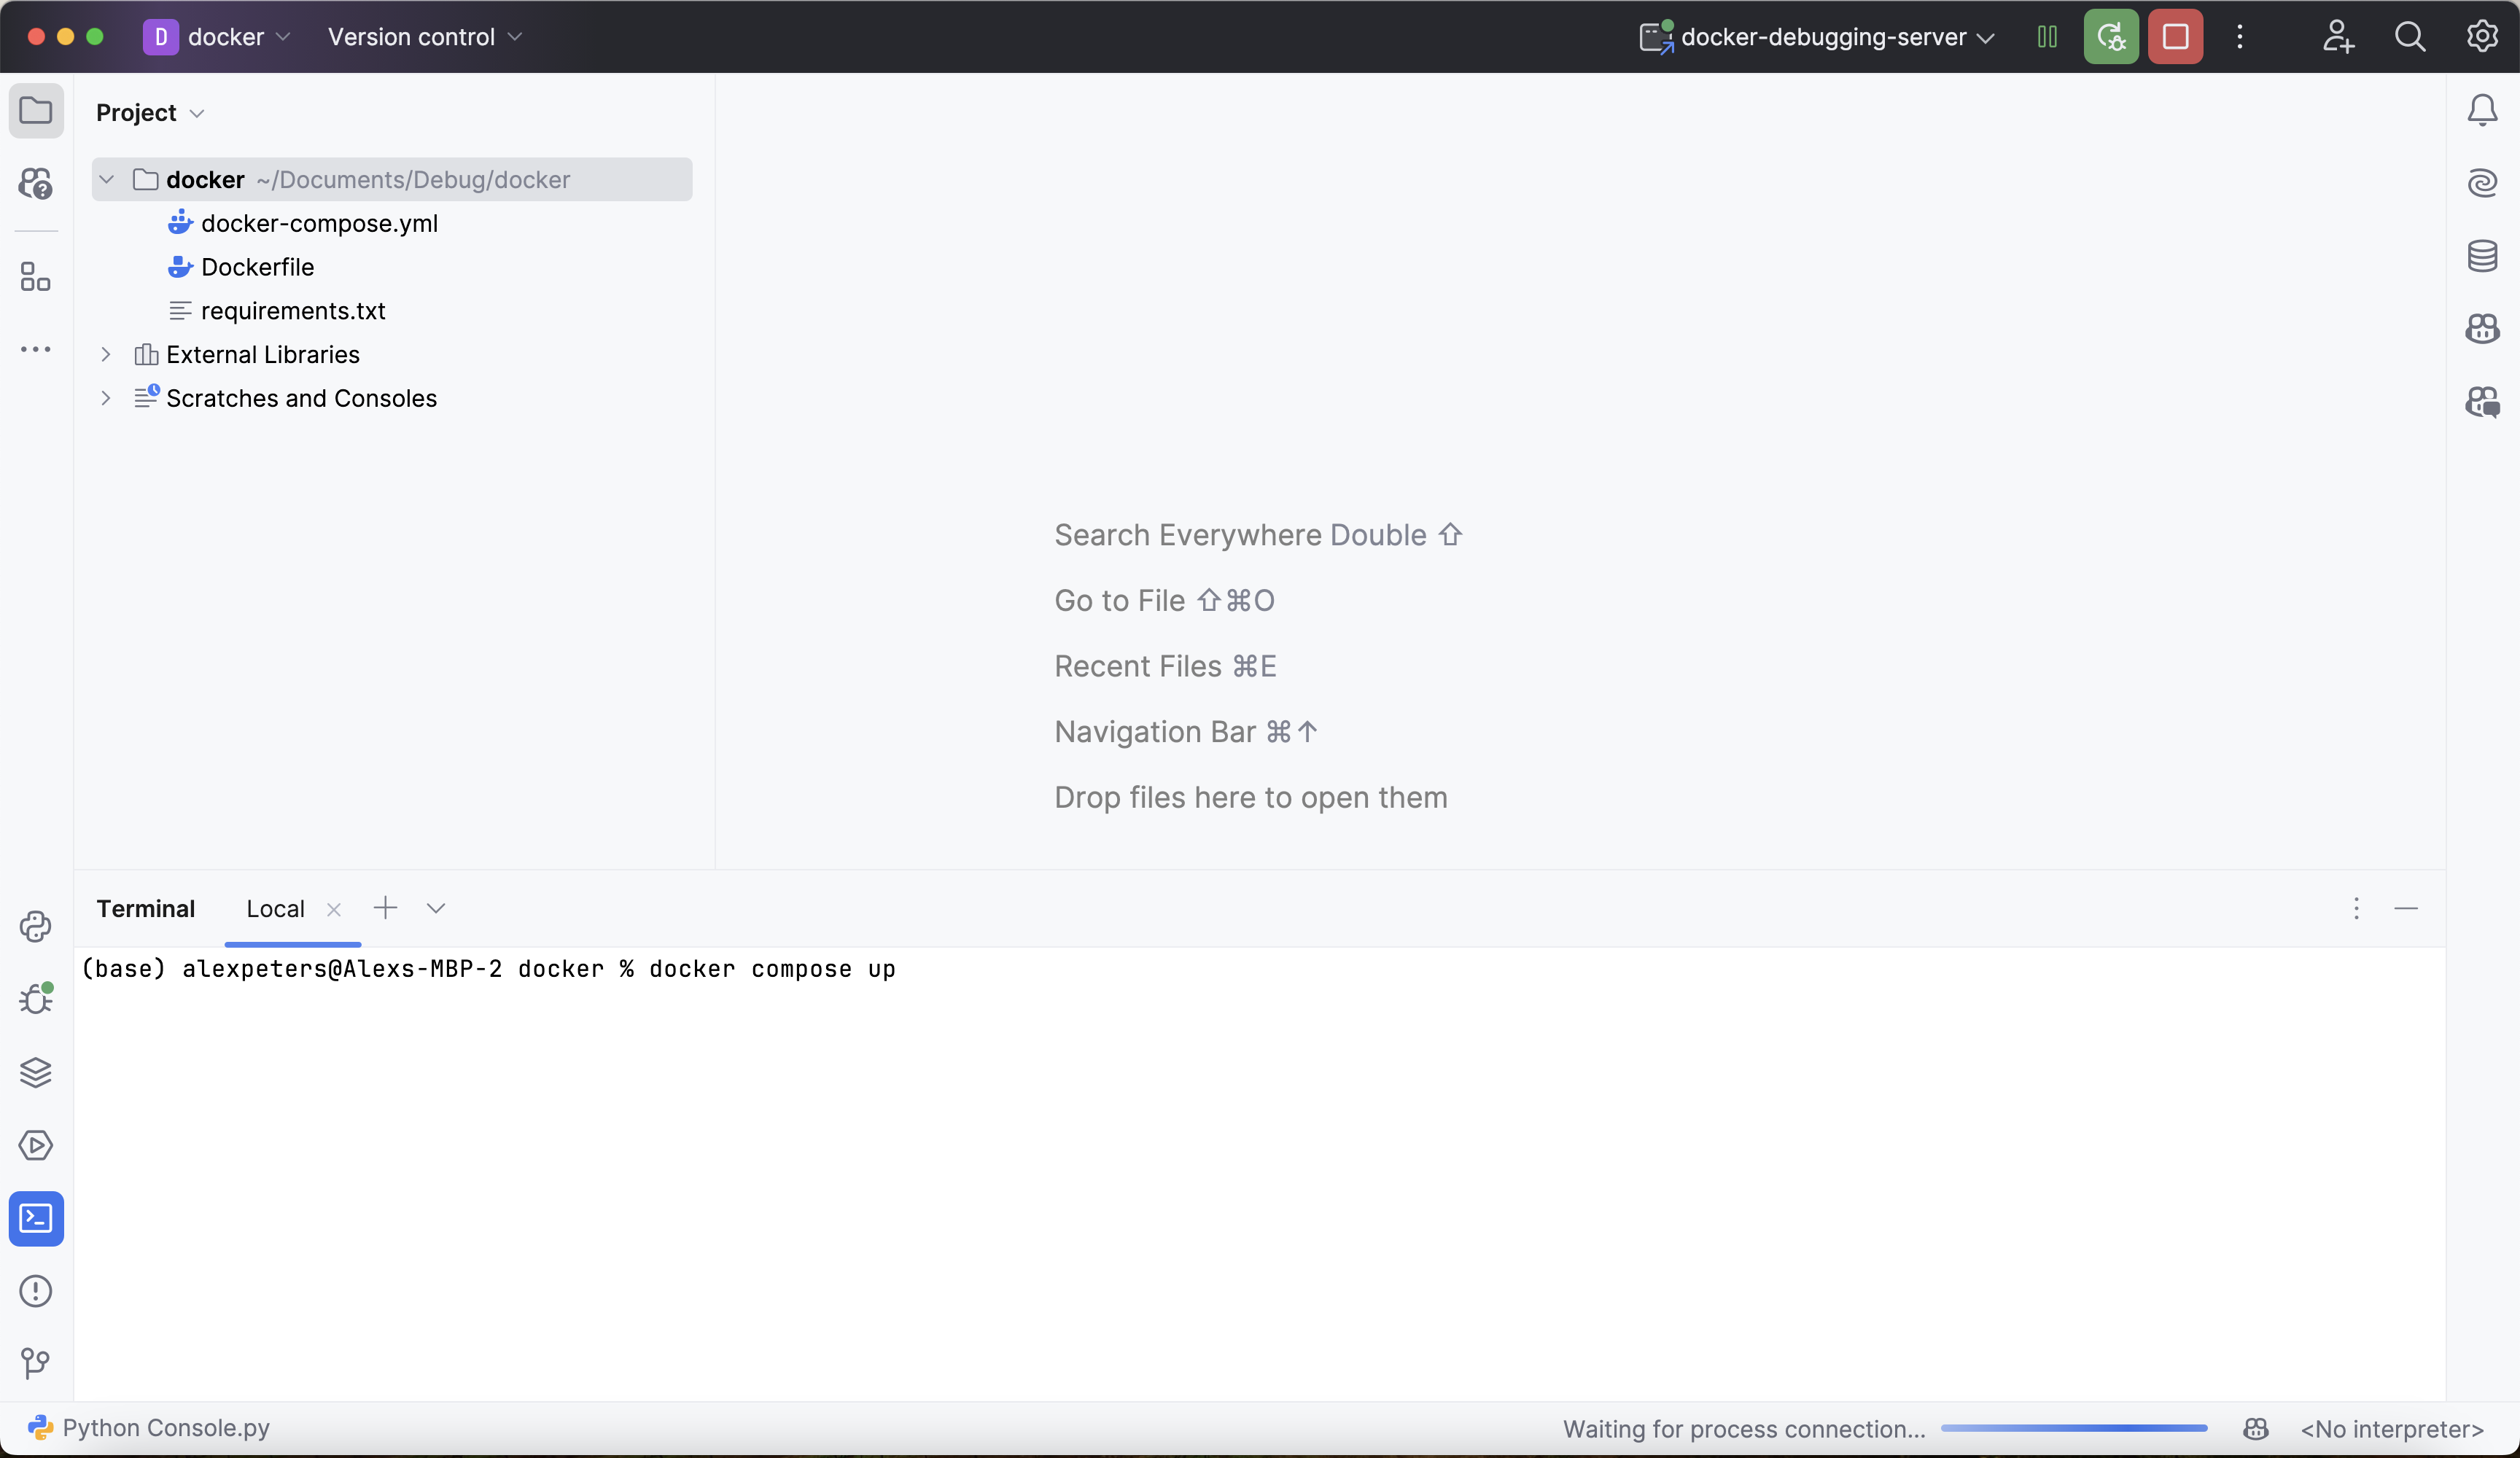
Start the Deephaven server: open a new PyCharm terminal and run docker compose up in the project directory. The first run builds the image from step 1. If the server is already running from an earlier session, skip this.
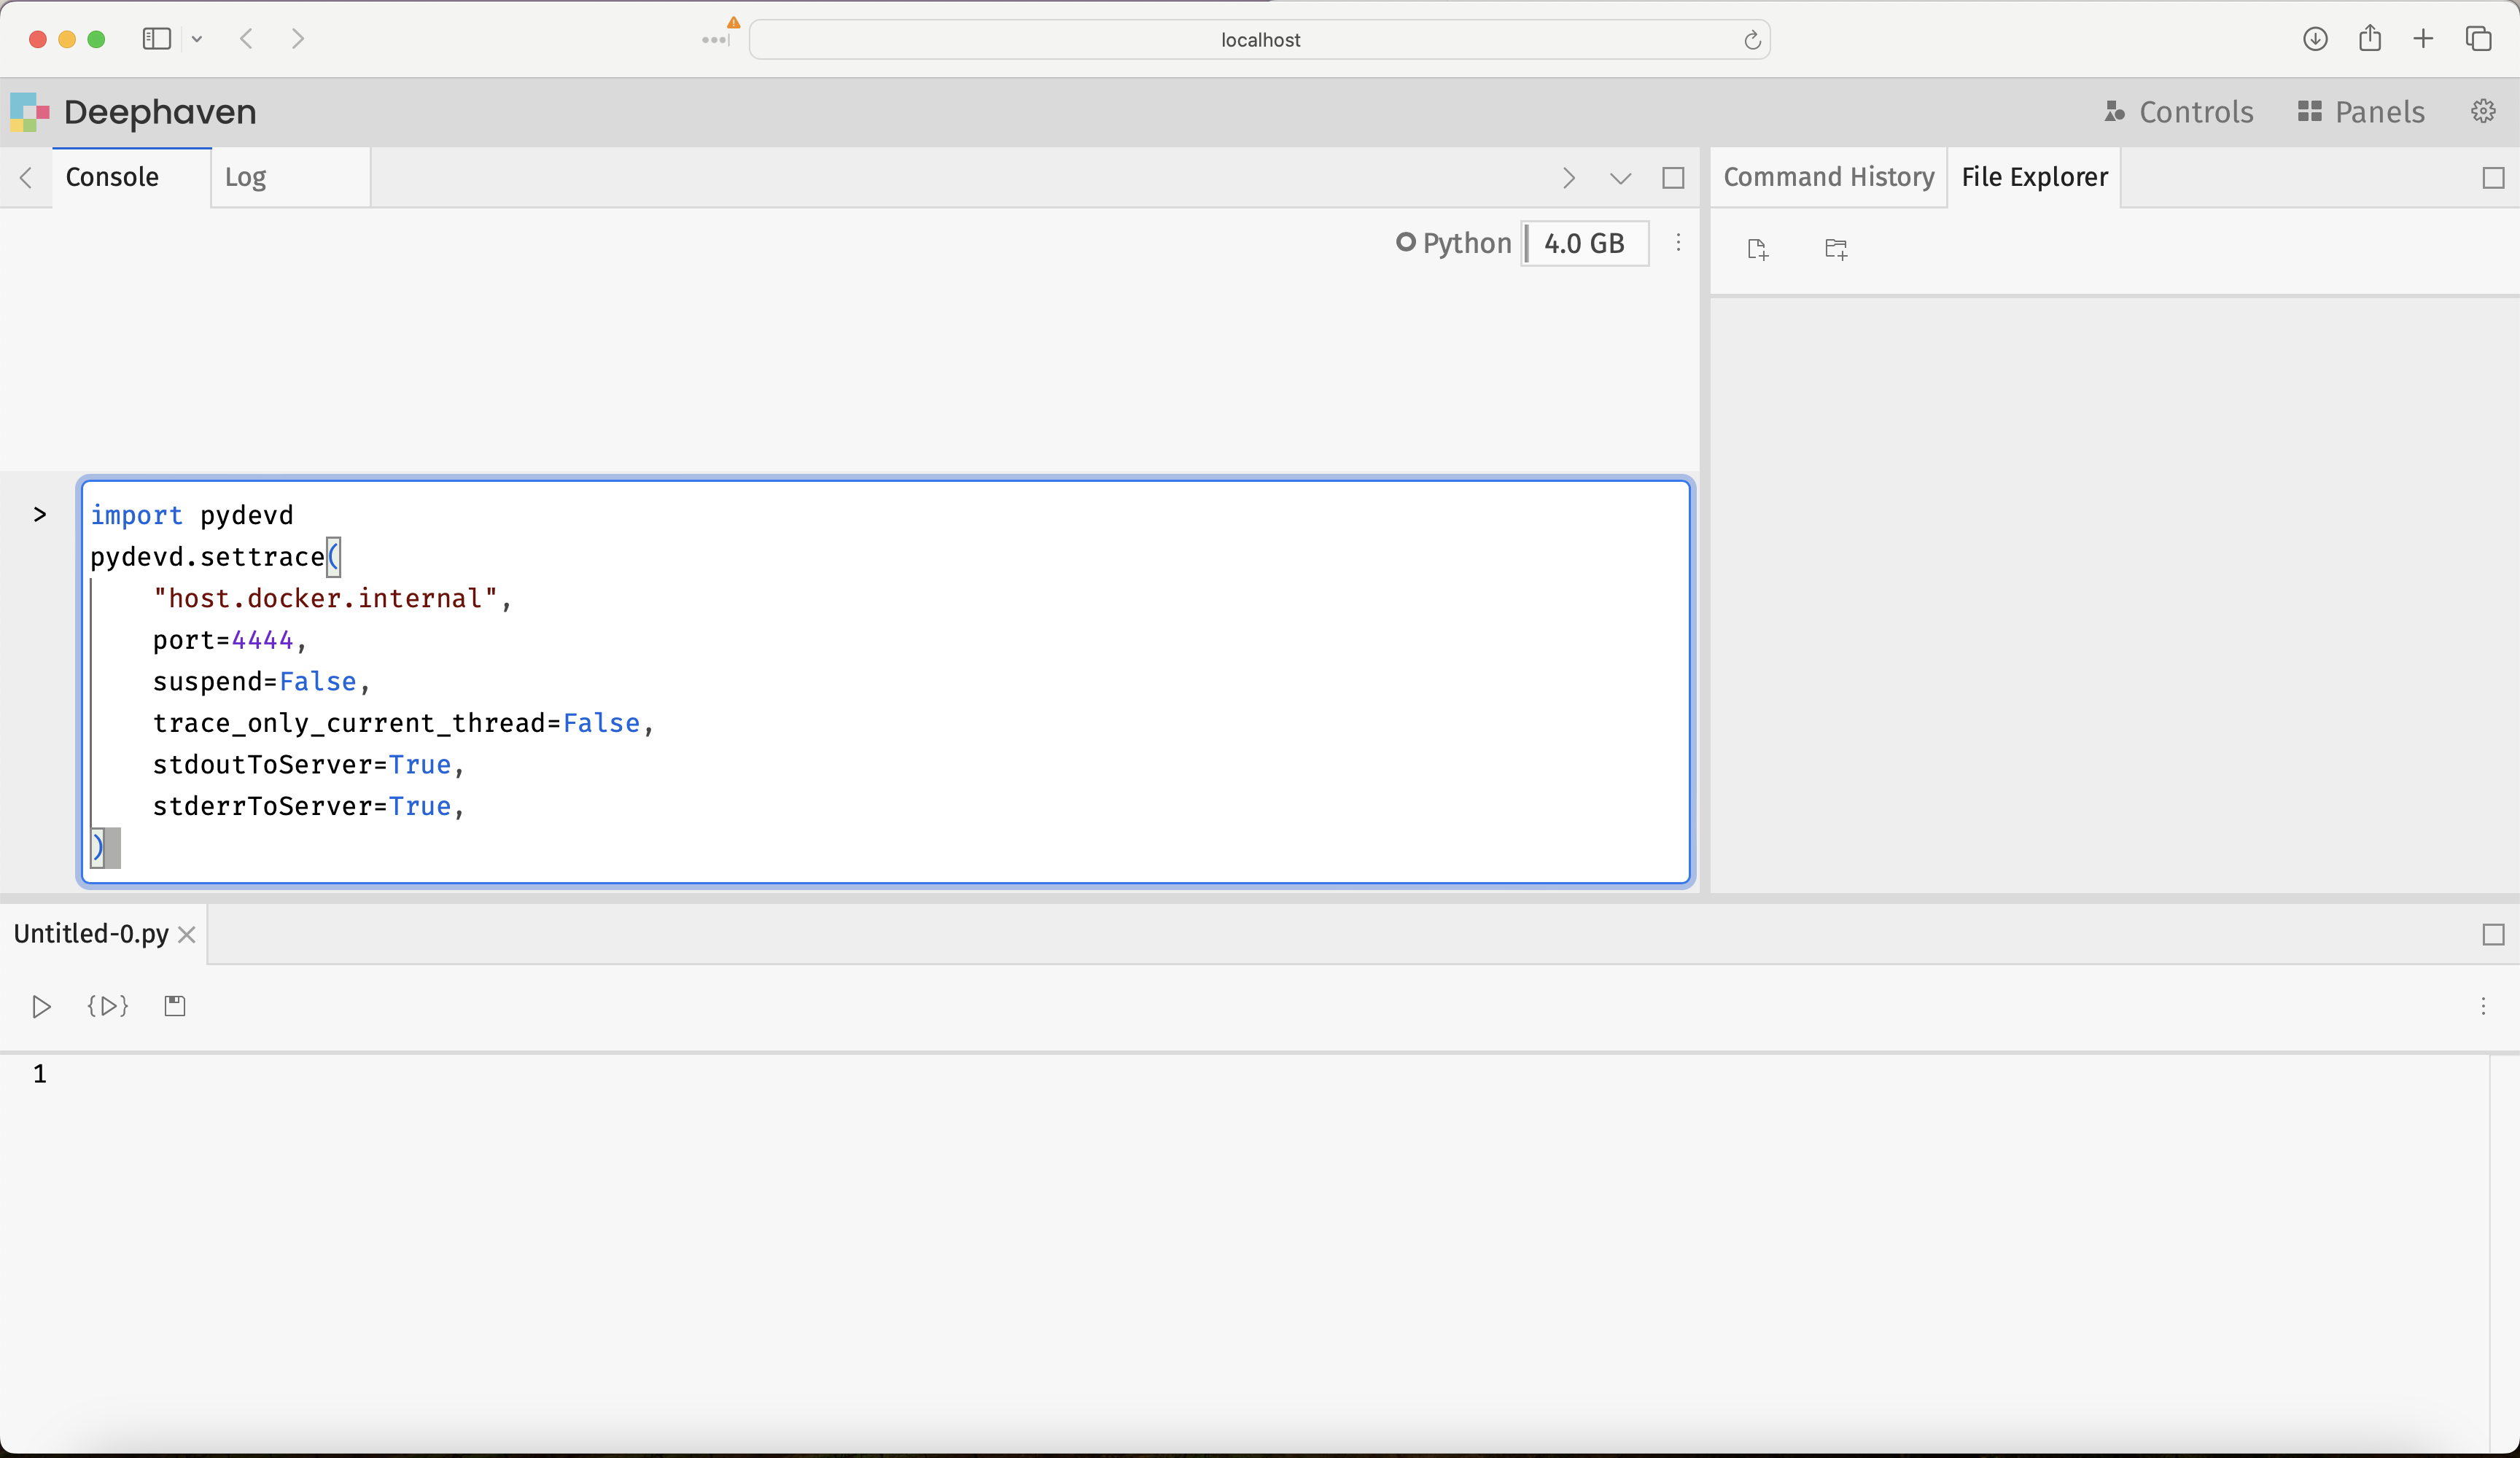
Then open the Deephaven IDE at http://localhost:10000/ide/ (replace 10000 with your DEEPHAVEN_PORT value if you set one) and attach the debugger to Deephaven by running the following code in the console:
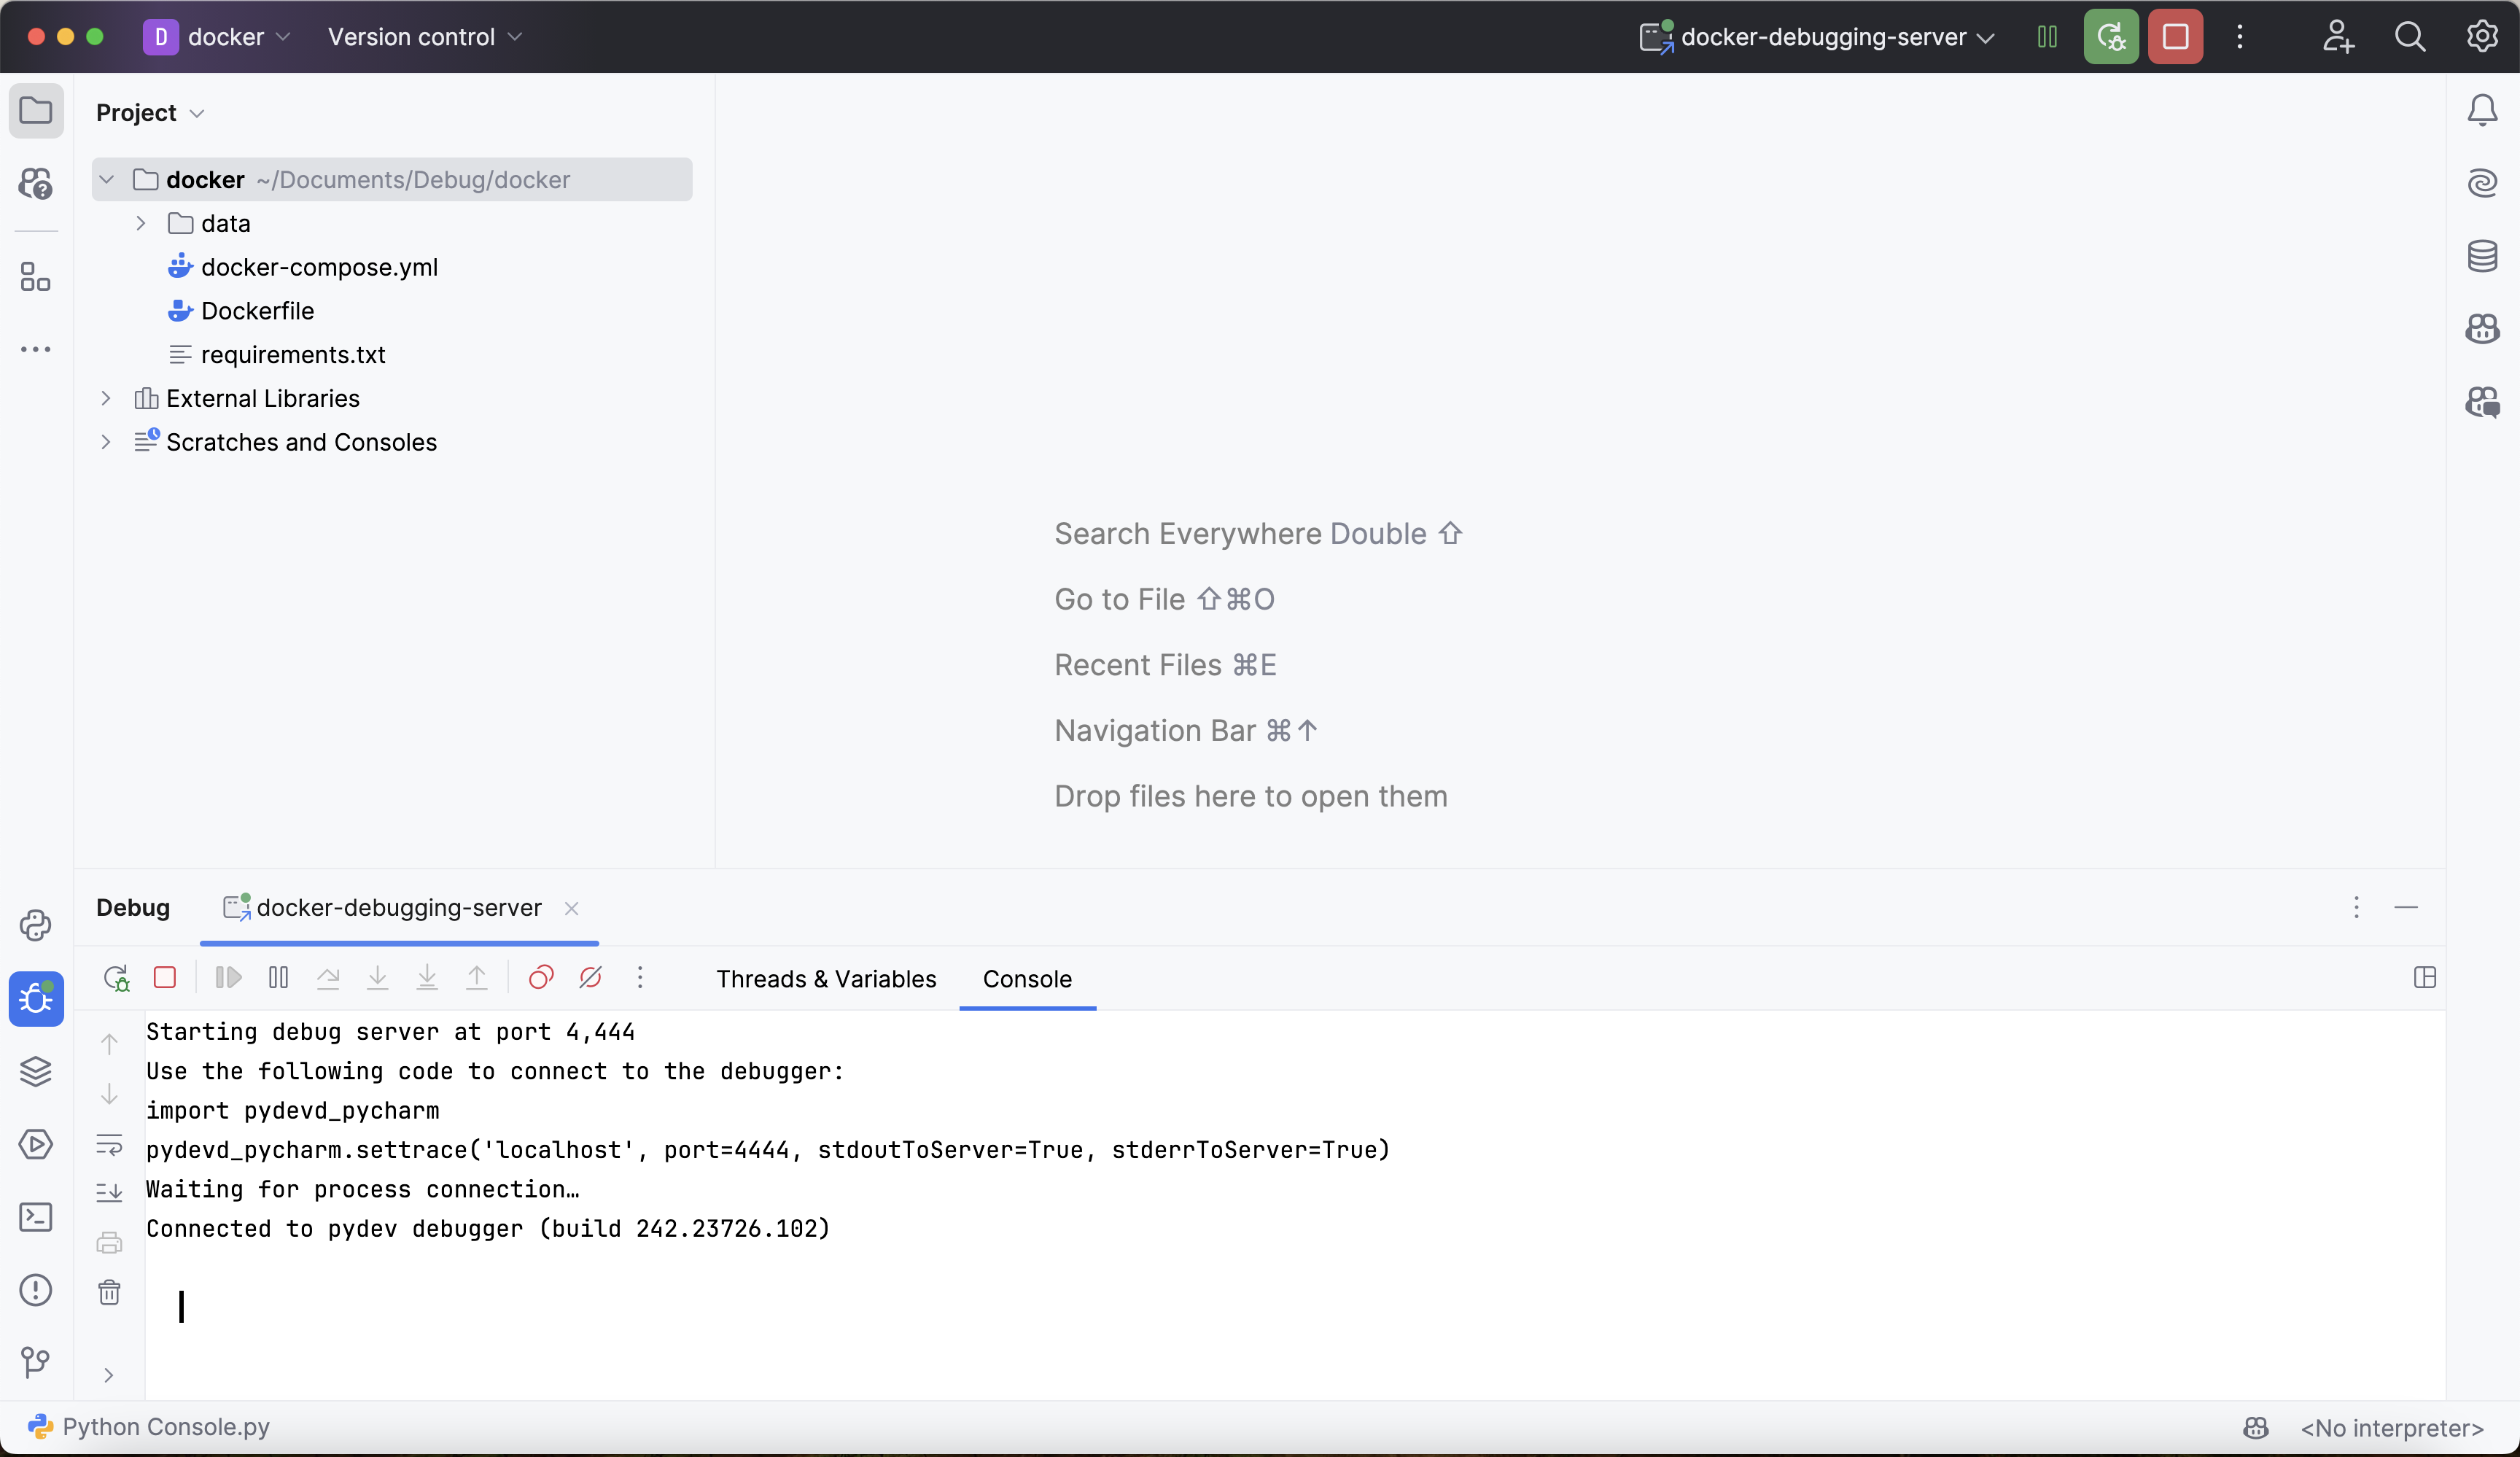
Navigate back to PyCharm and verify that Deephaven is connected by finding a line like this in the debugging console. The build number is your PyCharm build:
The debugger is attached to the Deephaven process and ready to go!
5. Use the PyCharm debugger
Once connected, you can use the PyCharm debugger in two ways:
- Set breakpoints in PyCharm: For Python files in the mounted
datadirectory, click in the left margin of the file in PyCharm's editor to set a breakpoint. This uses the path mapping from step 3. - Call
pydevd.settracein code: For code you run from the Deephaven console, put apydevd.settracecall where you want execution to pause.
For a margin breakpoint to fire, Deephaven must run the file from its /data path. For example, save my_udfs.py in the data directory, import it in the Deephaven console, and then call its functions from your queries:
After the initial connection in step 4, you can call settrace with no arguments. Here's an example using it as a breakpoint:
When the update call runs udf, execution pauses at the pydevd.settrace call and PyCharm shows the paused frame, with x available to inspect. update calls udf once per row, so execution pauses 10 times. Resume in PyCharm each time to let the console command finish.
From there, the debugger's full suite of capabilities is on offer. You can step through your Python code and Deephaven's Python package code, set breakpoints to halt execution, and inspect variables and intermediate values deep inside function calls.
For general help with PyCharm's debugger, start with JetBrains' debug console guide.
There are some Deephaven-specific things to consider when debugging. Table operations and ticking tables raise their own issues. See Common problems when debugging Deephaven.
Troubleshooting
Debugger won't connect
Problem: pydevd.settrace fails with a connection error.
Solutions:
- Verify that the PyCharm debug server is running. Its debug console shows "Waiting for process connection...".
- Check that no firewall blocks port
4444. - Ensure the port in
settracematches the PyCharm configuration. - On Linux with Docker Engine, make sure
docker-compose.ymlmapshost.docker.internalwithextra_hosts. - If the debug server is running and the ports match, your
pydevdpackage may not match your PyCharm build. Switch topydevd-pycharmas described in Version compatibility issues.
Path mapping not working
Problem: When you step through code, PyCharm opens the wrong file, shows the wrong line, or can't find the source file.
Solutions:
- Verify that the local path in the PyCharm configuration is the absolute path to your project's
datadirectory (for example,/Users/yourname/docker-debug-project/data). - Ensure the remote path is
/data, the container path wheredocker-compose.ymlmounts your project'sdatadirectory. - If you changed the
volumesentry indocker-compose.yml, update both paths in the PyCharm configuration to match it.
Debugger disconnects after attaching
Problem: The debugger connects but the connection immediately drops.
Solutions:
- Check the PyCharm debug console for error messages that indicate the cause.
- Try increasing JVM memory if you see out-of-memory errors. The
-Xmx4goption in theSTART_OPTSenvironment variable ofdocker-compose.ymlsets the maximum heap size. See Add more memory.
Version compatibility issues
Problem: The debugger behaves unexpectedly, shows errors, or has features that don't work.
Solutions:
- Use PyCharm 2024 or later. Debugging Deephaven with PyCharm 2023 has known problems.
- Run
docker compose exec deephaven pip show pydevd pydevd-pycharmfrom the project directory to check which debugger package is installed in the container. - If the debugger misbehaves with the generic
pydevdpackage, switch topydevd-pycharm:- In
requirements.txt, replacepydevdwith thepydevd-pycharmversion that matches your PyCharm build, for examplepydevd-pycharm~=242.23726.102. The Python Debug Server configuration window from step 3 shows the install command for your build. - Rebuild and restart the container with
docker compose up --build. - In steps 4 and 5, replace
import pydevdwithimport pydevd_pycharm, and callpydevd_pycharm.settracewith the same arguments. - Check the argument names.
pydevd-pycharmbuilds before 252.23892 accept onlystdoutToServerandstderrToServer. Those builds include all PyCharm 2024.x and 2025.1 builds, early 2025.2 builds, and the 242.23726.102 example above. If your build is one of these, renamestdout_to_serverandstderr_to_serverto those names.
- In
Related documentation
- Table types
- Table operations overview
- Install Deephaven with Docker
- Debug Python code in Deephaven
- Common problems when debugging Deephaven
- Debug pip-installed Deephaven
- Debug built-from-source Deephaven with PyCharm
- Debug an embedded Deephaven server with PyCharm
- Enable anonymous authentication
- Pre-shared key authentication
empty_tableupdate