Debug pip-installed Deephaven
This guide shows you how to set up a debugger for pip-installed Deephaven. There are two main debugging approaches, and which one you use depends on which process starts the Deephaven server:
-
Local debugging (recommended): Your Python script starts the Deephaven server, and you run that script in your IDE's debugger. The debugger attaches to the process your IDE launched, so you don't need a separate debug server. This simpler approach works with VS Code and PyCharm. On macOS and Linux, PyCharm's free tier is enough. On Windows, PyCharm needs a WSL interpreter, which requires PyCharm Pro. See Local debugging with PyCharm or Local debugging with VS Code.
-
Remote debugging (advanced): You start the server with the
deephaven servercommand and run code in the Deephaven web IDE. Your IDE didn't launch that server, so the server connects to a remote debug server in PyCharm Pro, the paid tier of PyCharm. This takes more setup, but it lets you debug code that you type into the Deephaven console. See Remote debugging with PyCharm Pro.
Note
Some problems you may hit while debugging come from how Deephaven evaluates tables, not from your debugger setup. See Common problems when debugging Deephaven.
Setup
Every case covered in this guide assumes that Deephaven is installed in a Python virtual environment, which is the approach that the pip install guide recommends. Deephaven installed with pip also requires Java 17 or later, with JAVA_HOME set to your Java installation. See the prerequisites.
On Windows, pip-installed Deephaven requires WSL 2. Run the following commands in WSL 2, along with every other terminal command in this guide.
Create and activate a virtual environment as follows:
This creates a virtual environment called dh-venv and activates it. The rest of this guide assumes that your virtual environment is called dh-venv.
Then, install Deephaven into this environment using pip:
On Windows, dh-venv lives inside WSL 2, so point your IDE at it through WSL:
- PyCharm: Choose Add New Interpreter > On WSL. WSL interpreters require PyCharm Pro. With PyCharm's free tier on Windows, use VS Code instead.
- VS Code: Install the WSL extension and run WSL: Connect to WSL before you open the project folder.
The Windows notes in each section below cover the remaining differences: the PyCharm terminal, the VS Code WSL window, and the debug server host name.
Local debugging with PyCharm
Warning
Use PyCharm 2024 or later. Debugging Deephaven with PyCharm 2023 has known problems.
After the setup below, PyCharm's built-in debugger works well with Deephaven scripts that you run from PyCharm. On macOS and Linux, these steps work with both the free and Pro tiers of PyCharm. On Windows, this setup uses a WSL interpreter, which requires PyCharm Pro. Debug Python code in Deephaven explains how these tiers map to the older Community and Professional editions.
If you already have a PyCharm project that uses pip-installed Deephaven, skip to step 2.
1. Create and configure a PyCharm project
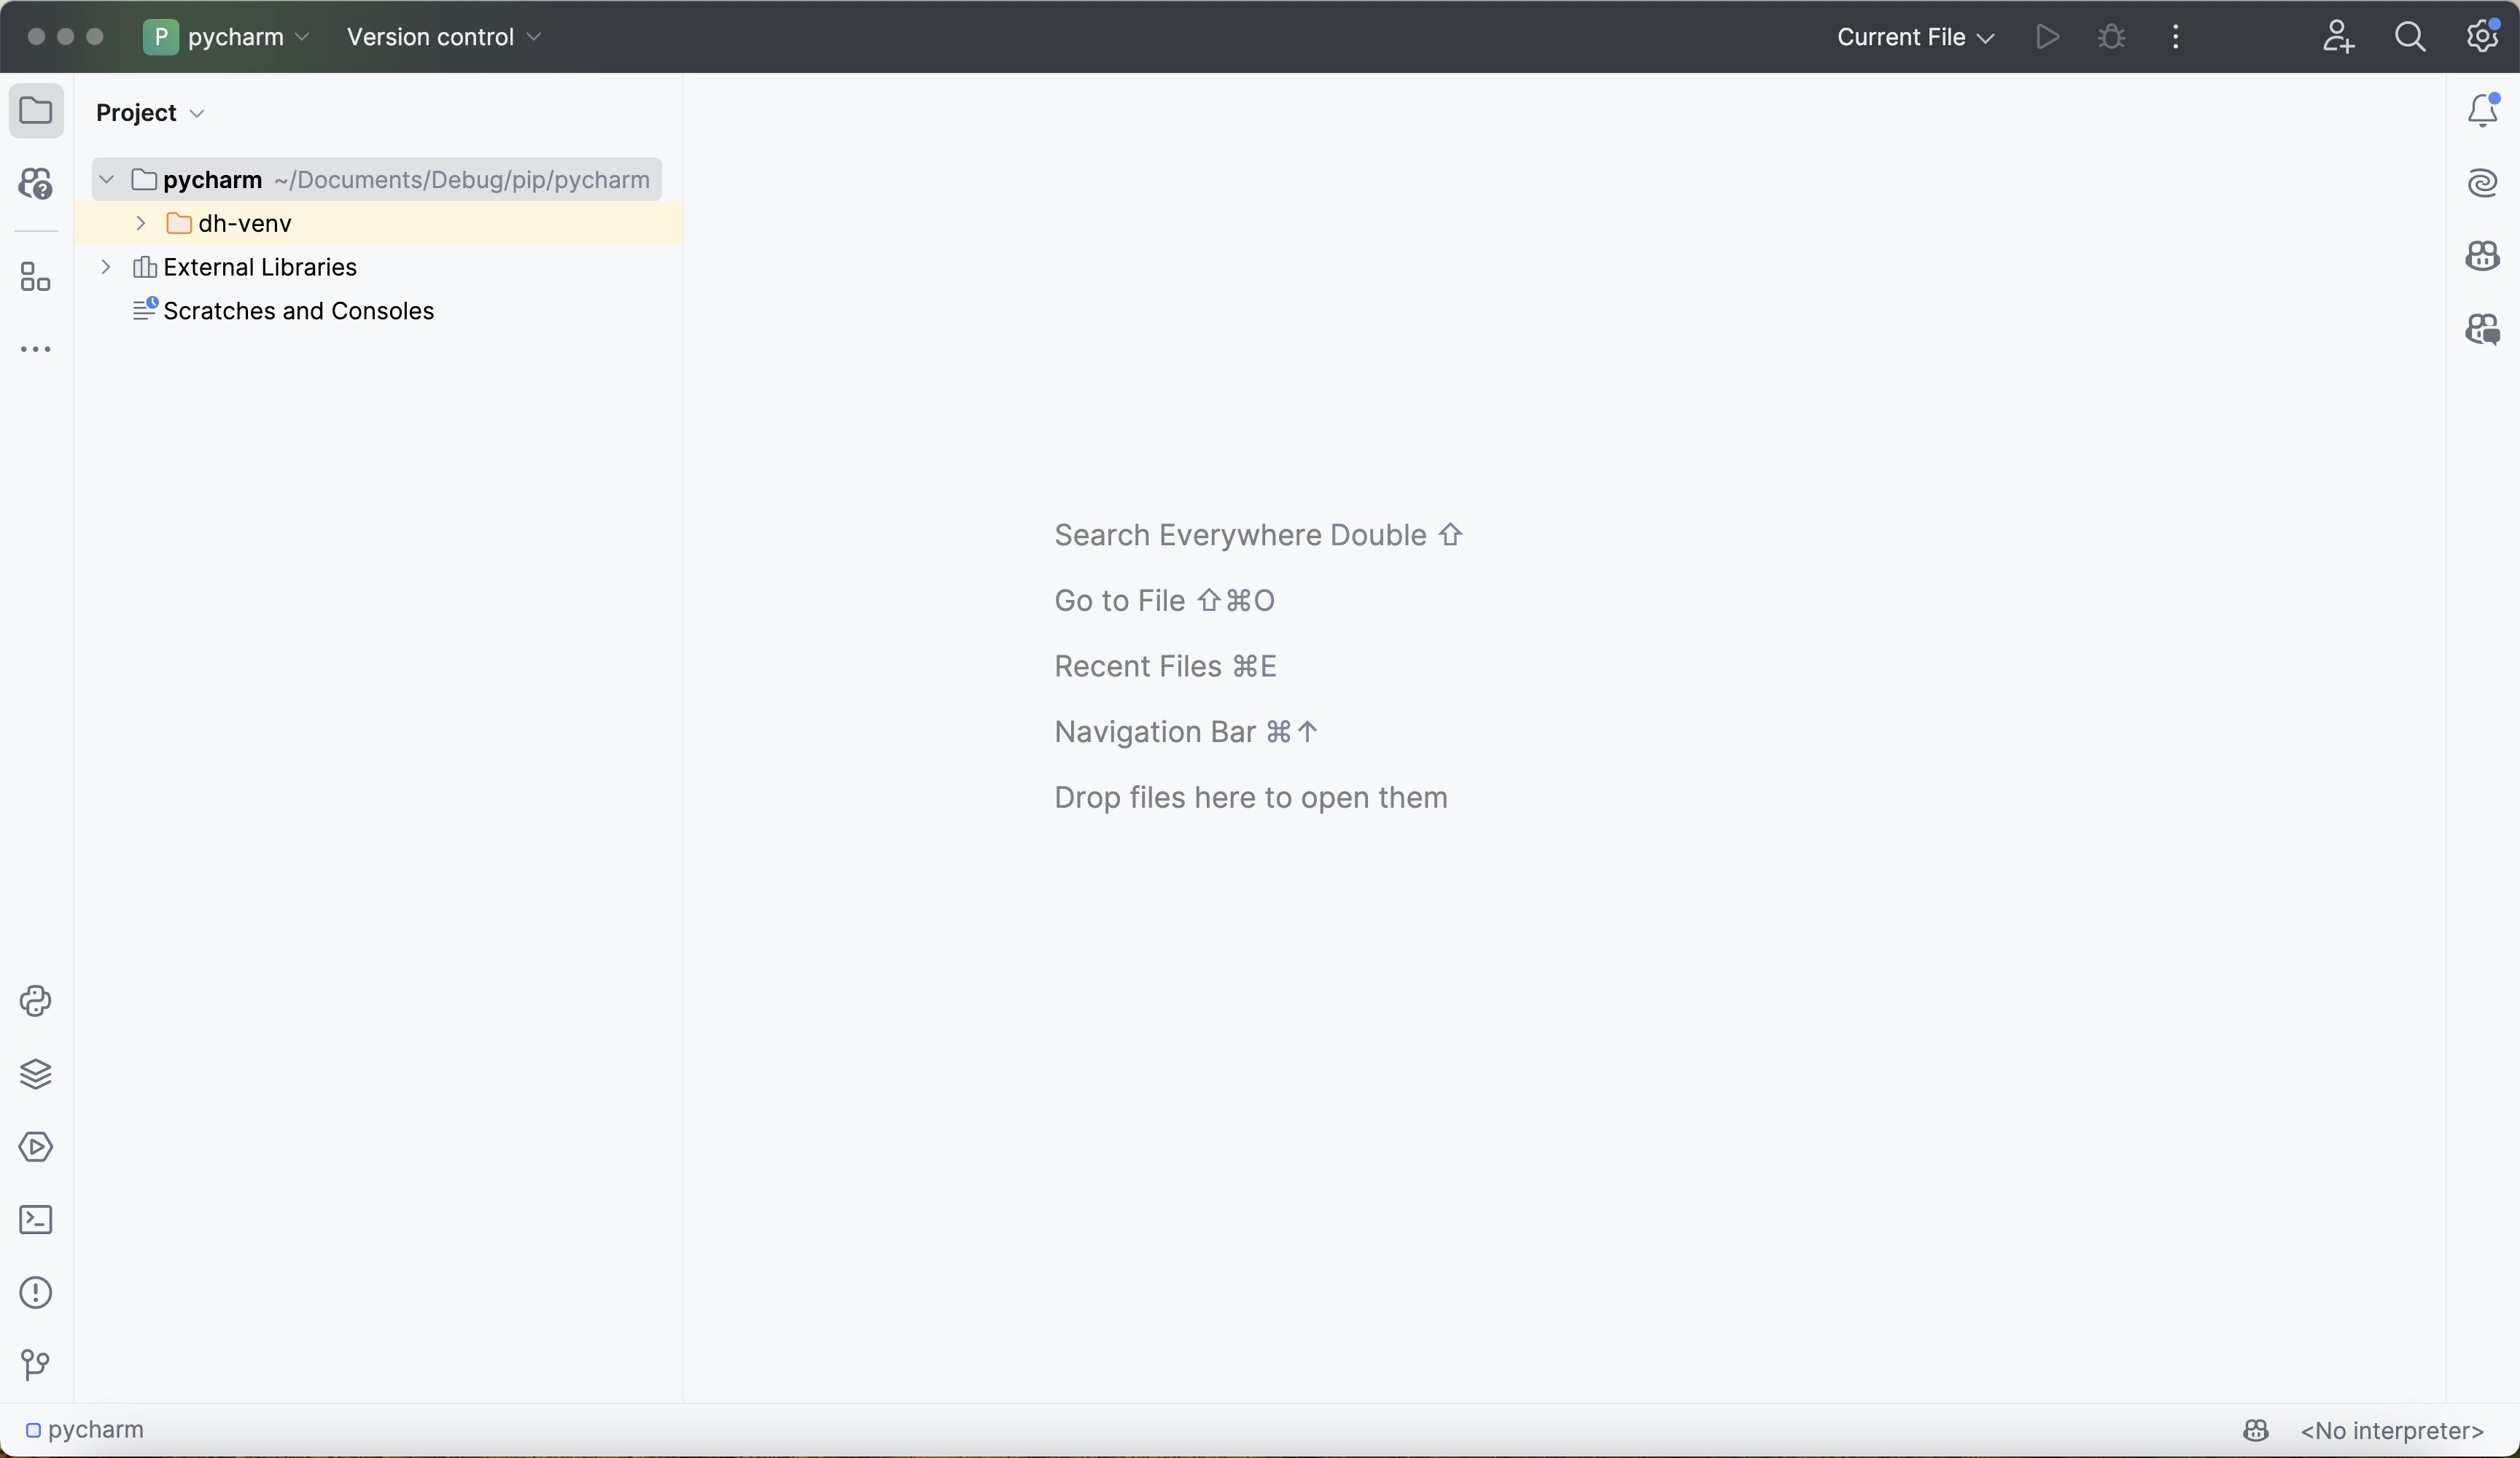
First, create a new PyCharm project from the directory containing the dh-venv virtual environment. The fresh PyCharm project looks like this:
Next, click on No interpreter in the bottom-right corner, click Add New Interpreter > Add Local Interpreter, choose Virtualenv Environment > Existing, and navigate to the python executable in dh-venv:
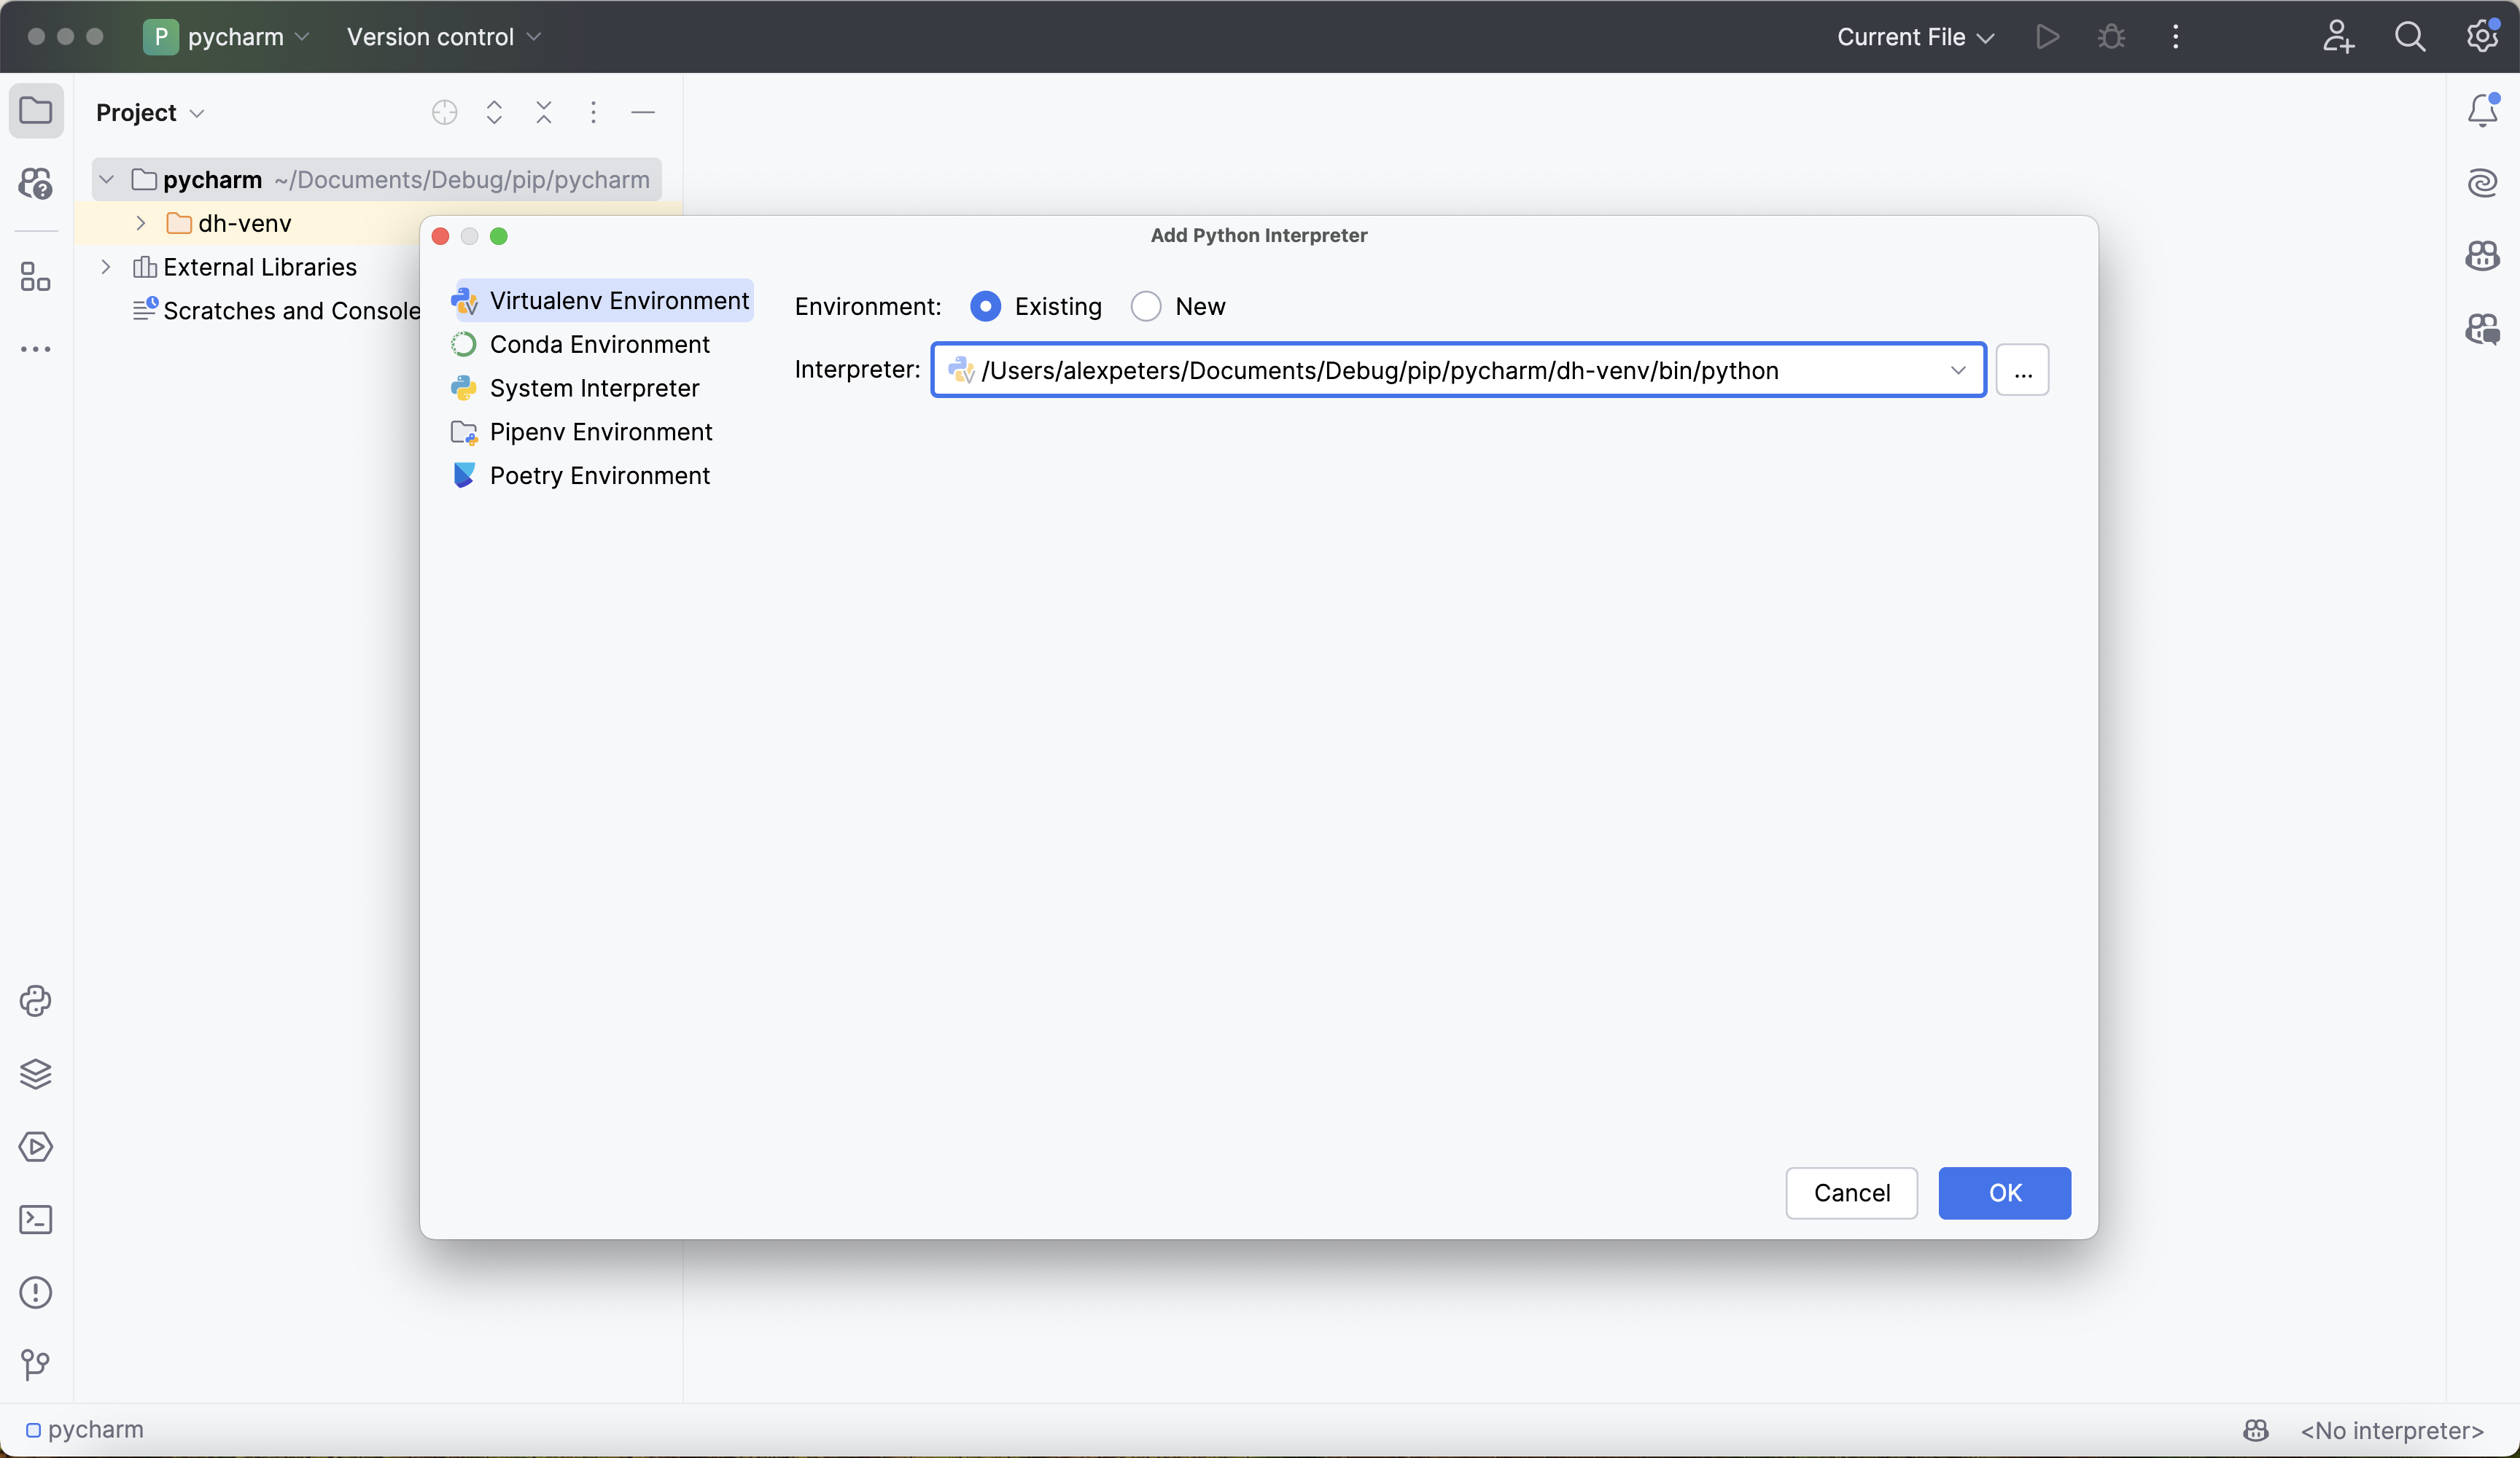
On Windows, choose On WSL instead of Add Local Interpreter, as described in Setup.
Click OK.
On Windows, open a WSL tab in the PyCharm terminal before you run the next command. To make every terminal command in this guide run in WSL, set Settings > Tools > Terminal > Shell path to wsl.exe.
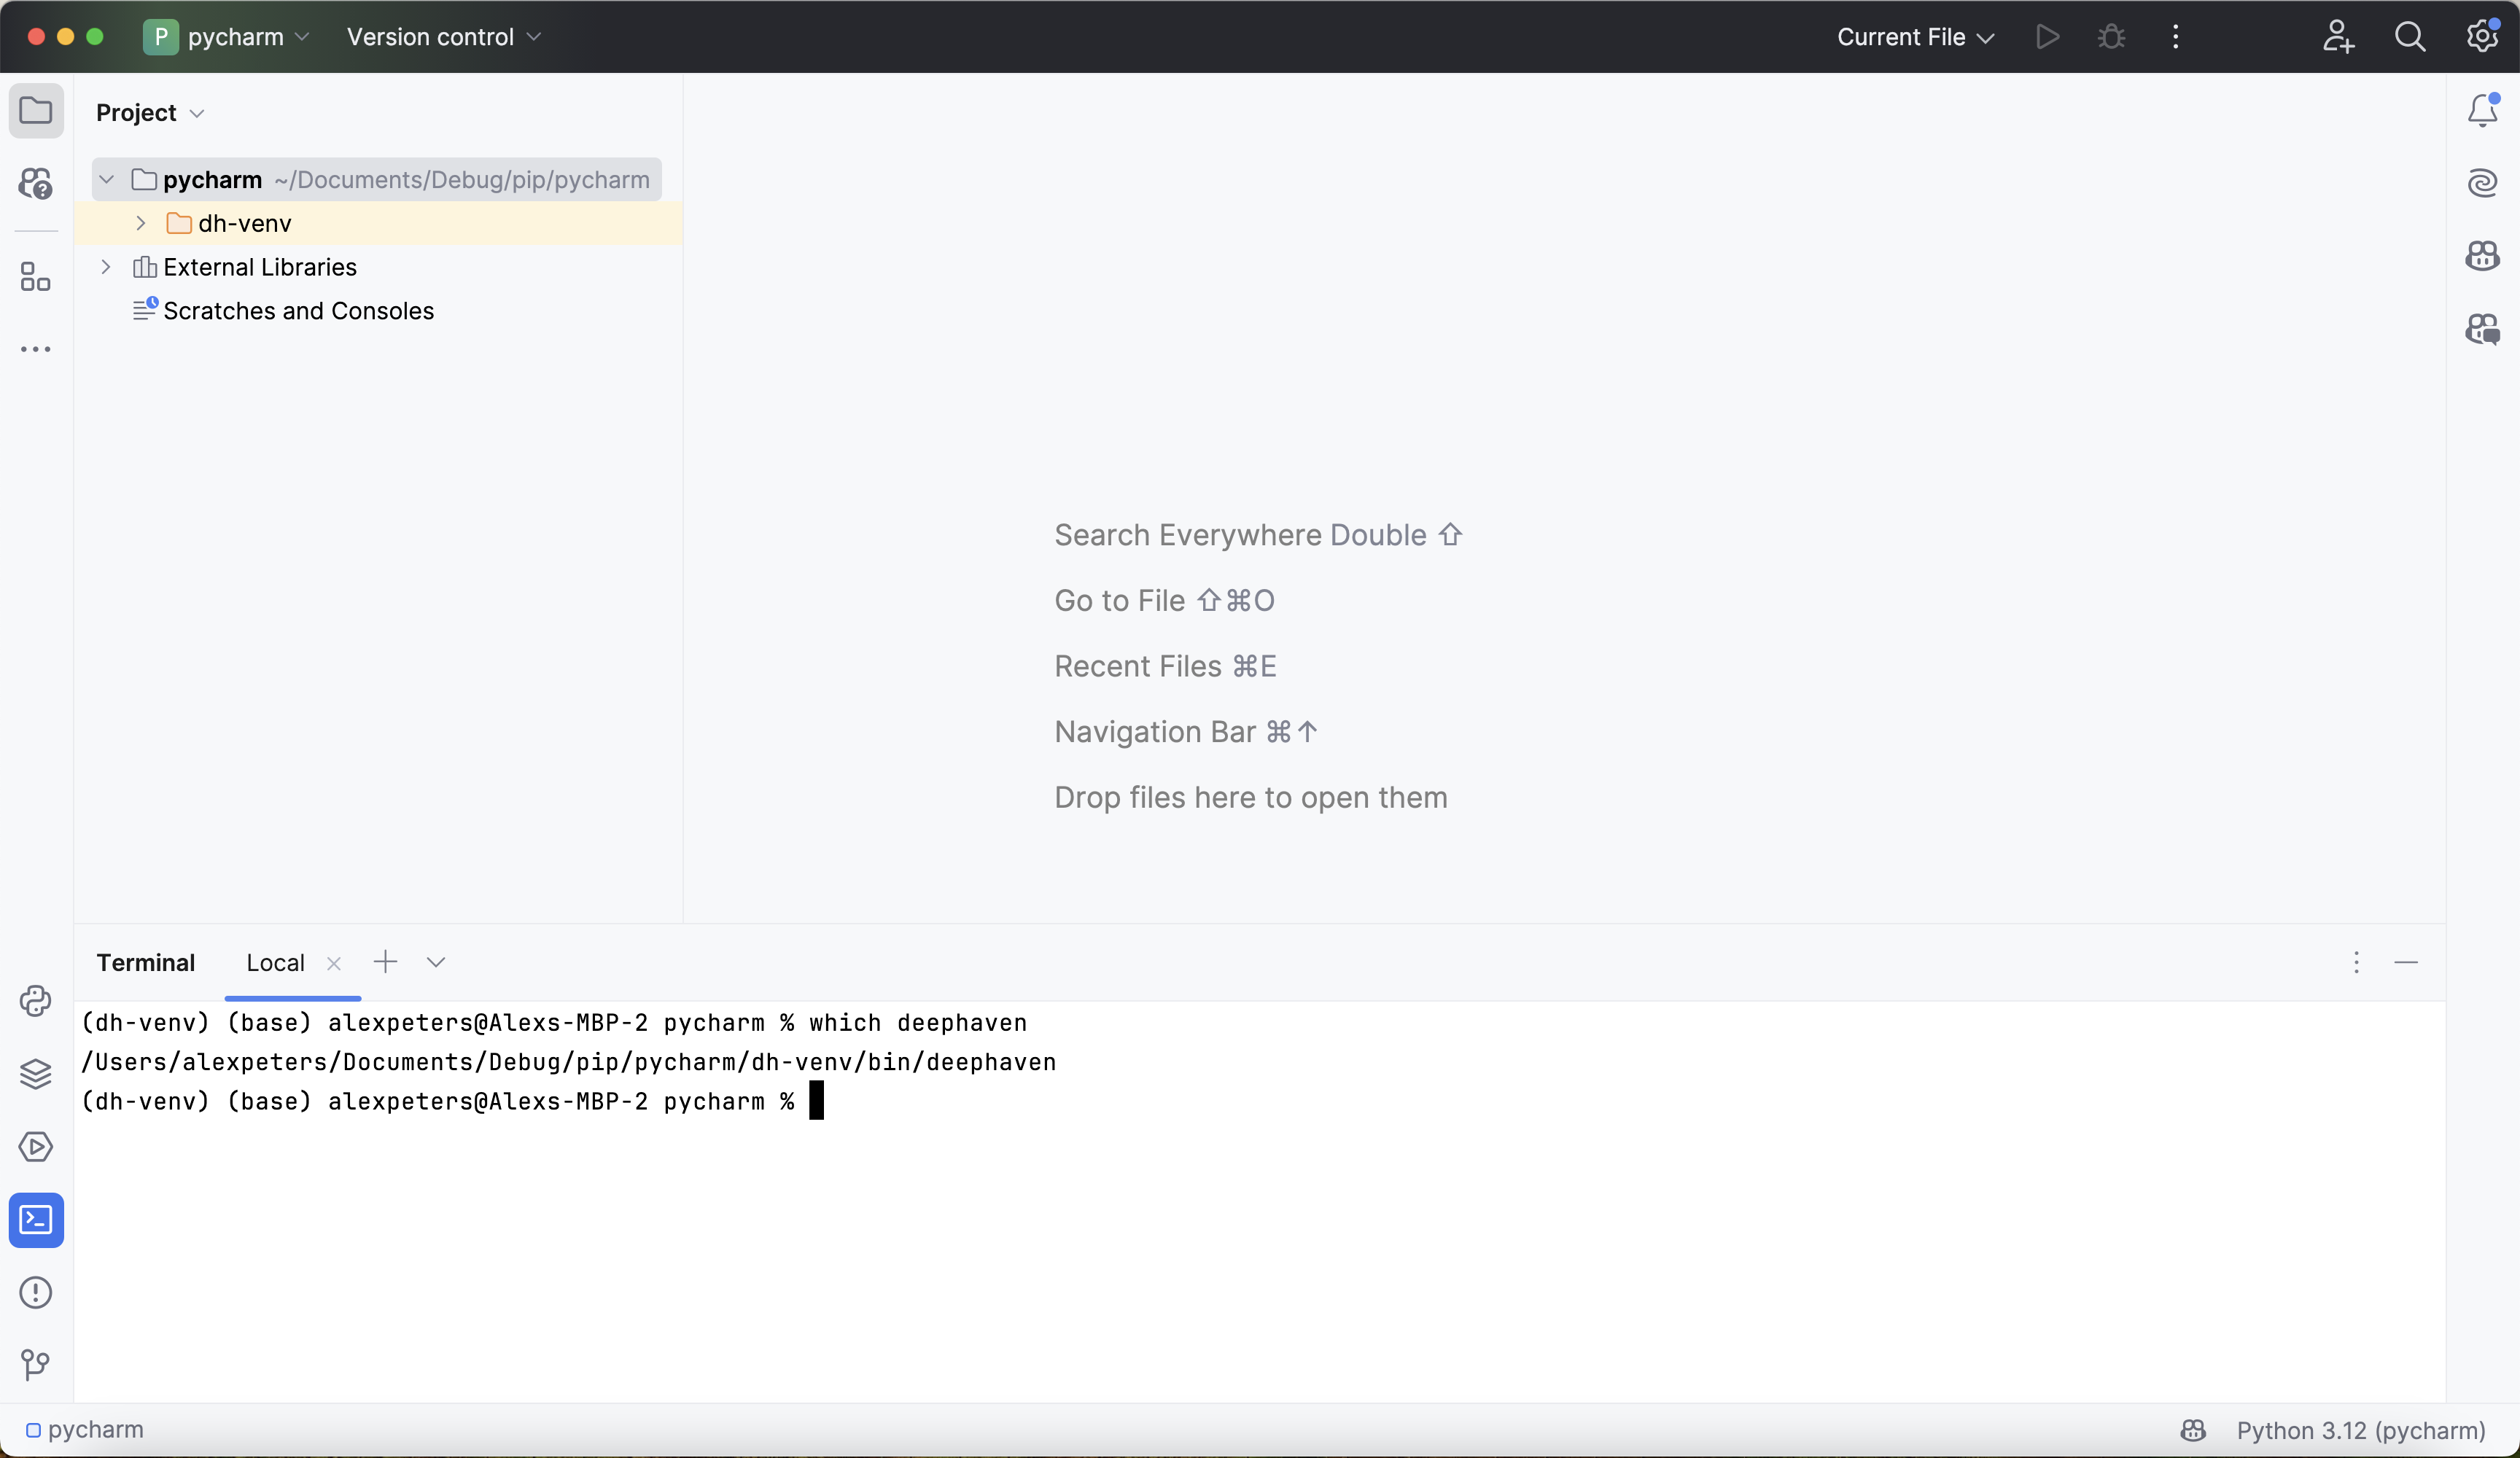
Verify that the interpreter is configured correctly by opening the terminal and running which deephaven. The command should return the path of the deephaven command inside dh-venv (for example, .../dh-venv/bin/deephaven):
2. Test the debugger
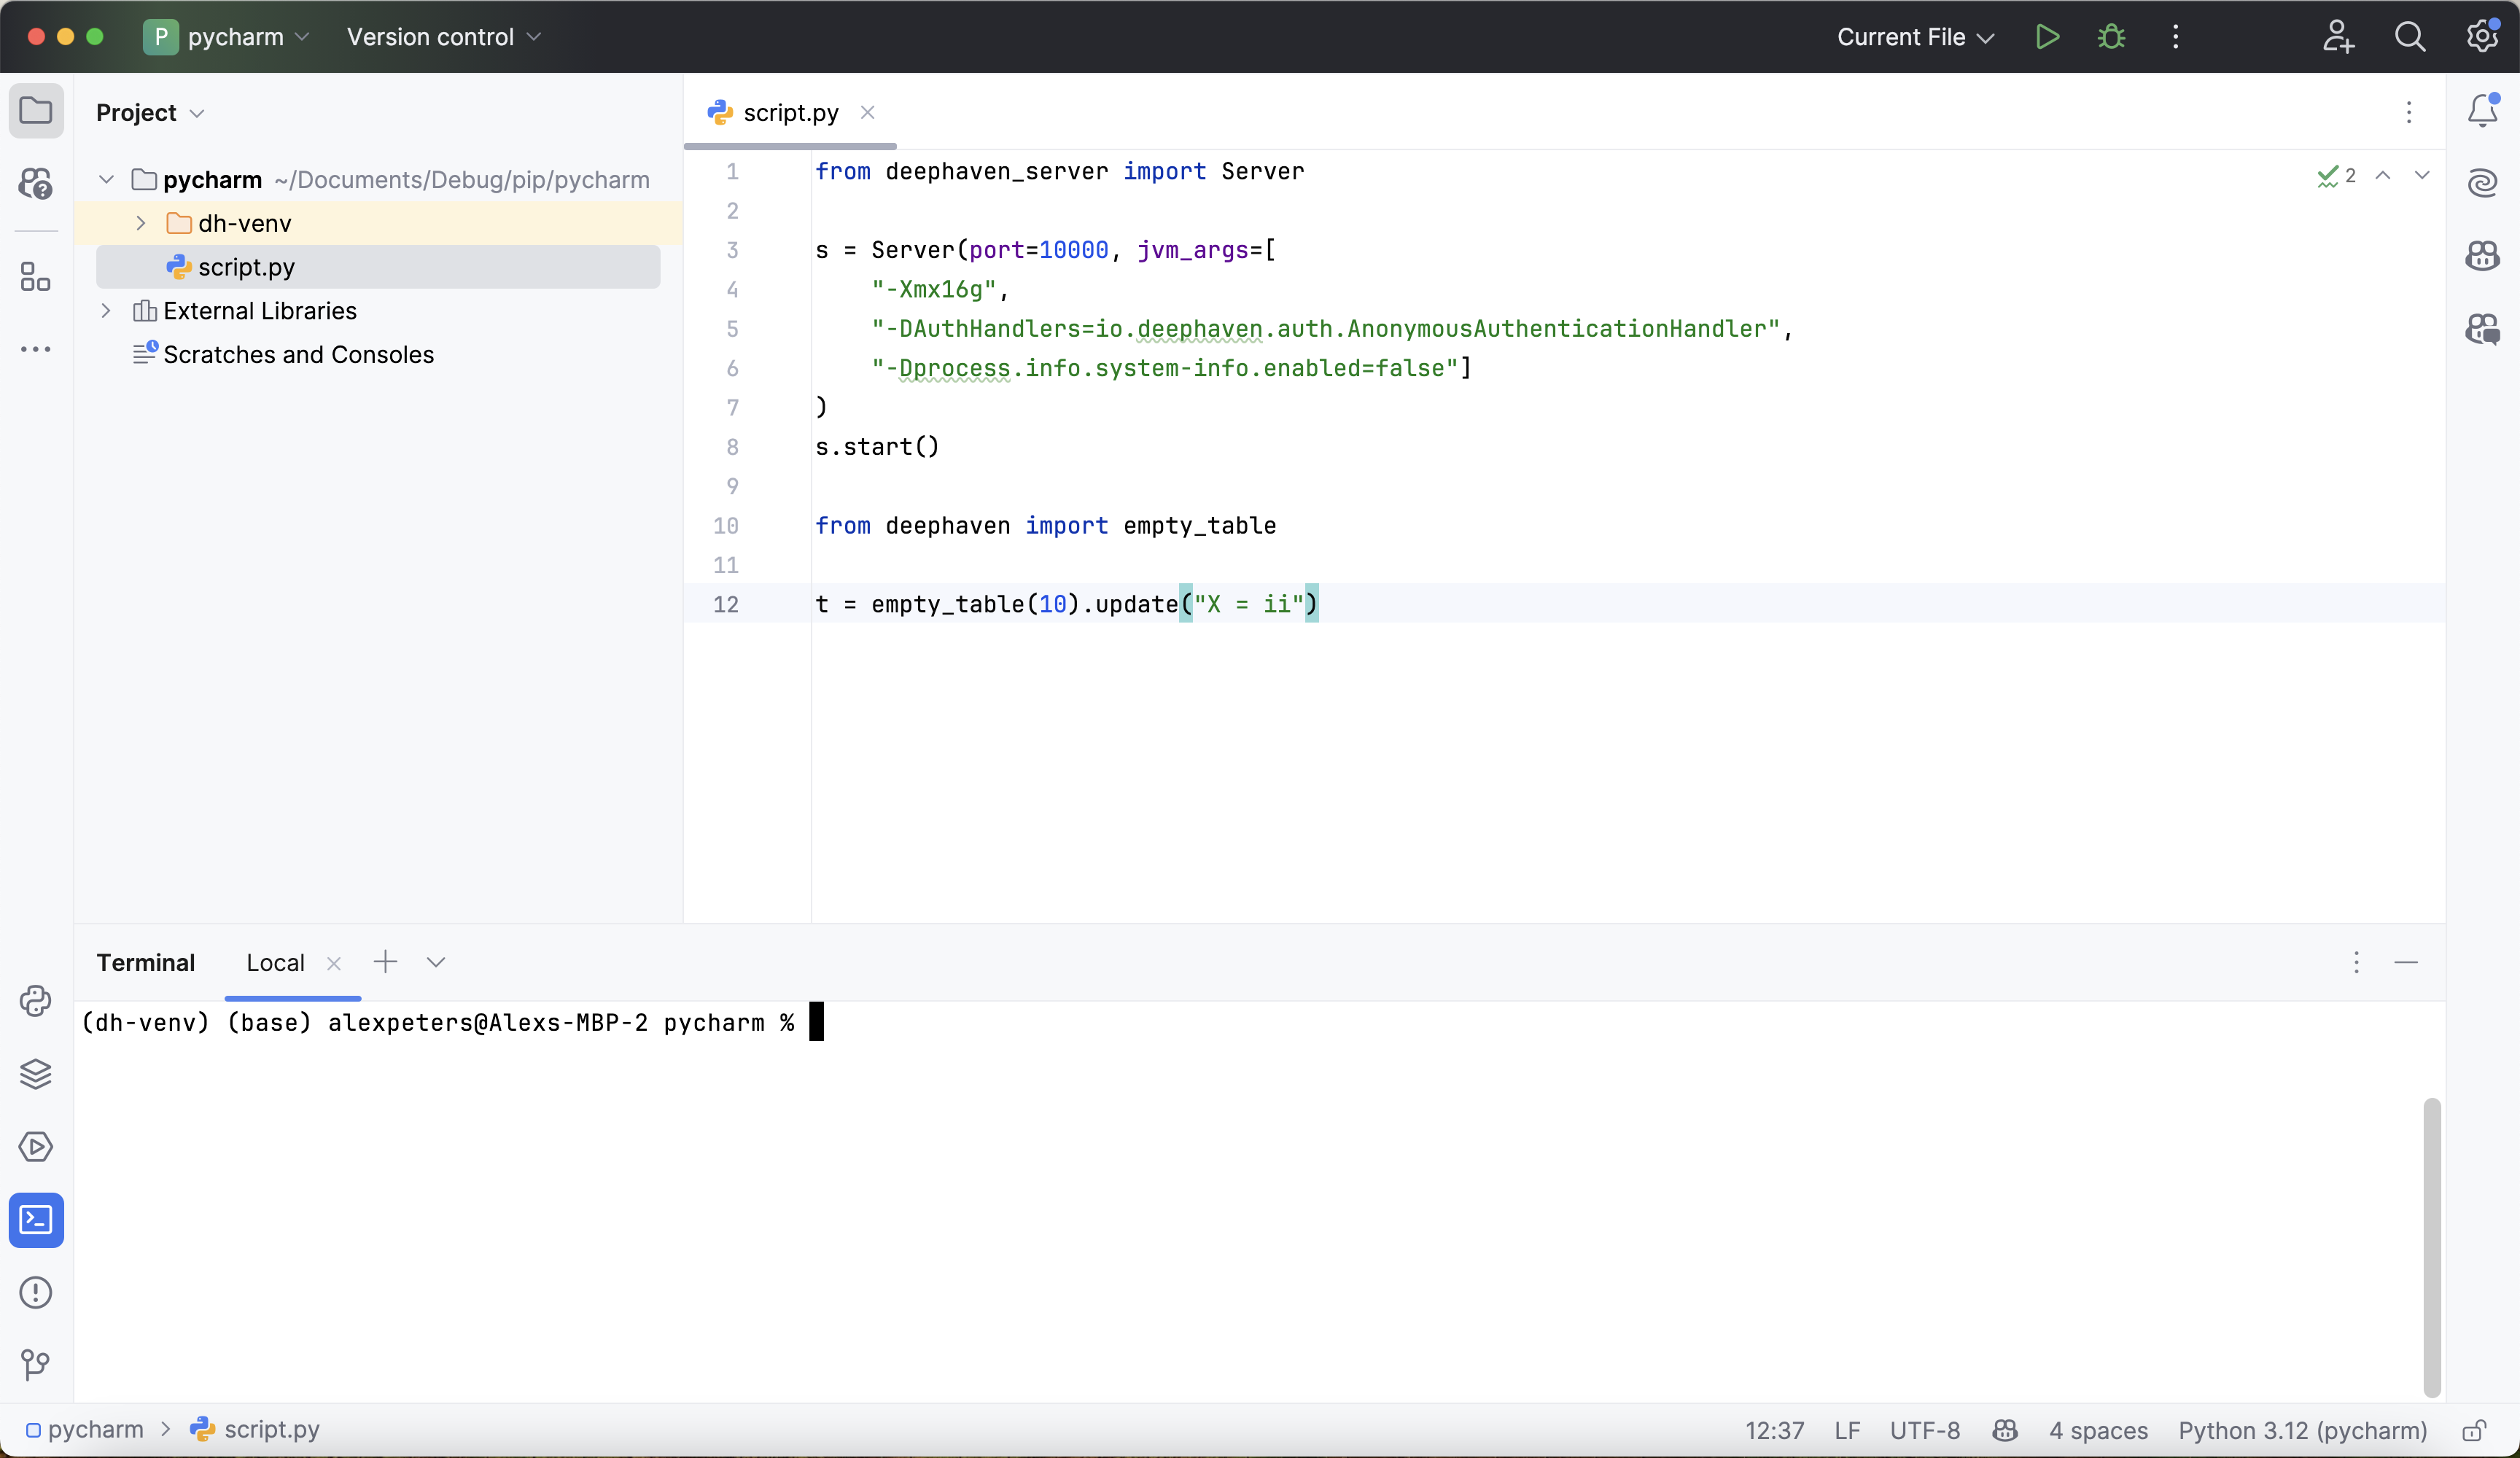
To ensure that PyCharm's debugger runs correctly with Deephaven, create a test script called script.py that starts and uses the Deephaven server. The script passes two JVM arguments, and debugging needs neither of them:
-Xmx4gsets a 4 GB maximum heap. Adjust or remove it to suit your machine.-Dprocess.info.system-info.enabled=falseturns off the collection of system information when the server starts. You can remove it, except on M2 Macs, where the pip install guide recommends keeping it.
The screenshot shows an earlier version of the script, with -Xmx16g and an -DAuthHandlers=io.deephaven.auth.AnonymousAuthenticationHandler argument. That argument replaces the default pre-shared key login with anonymous authentication, which lets anyone who can reach the server connect. Leave it out of your script.
Expand for test script
Then, right-click anywhere in the editor window and select Debug 'script':
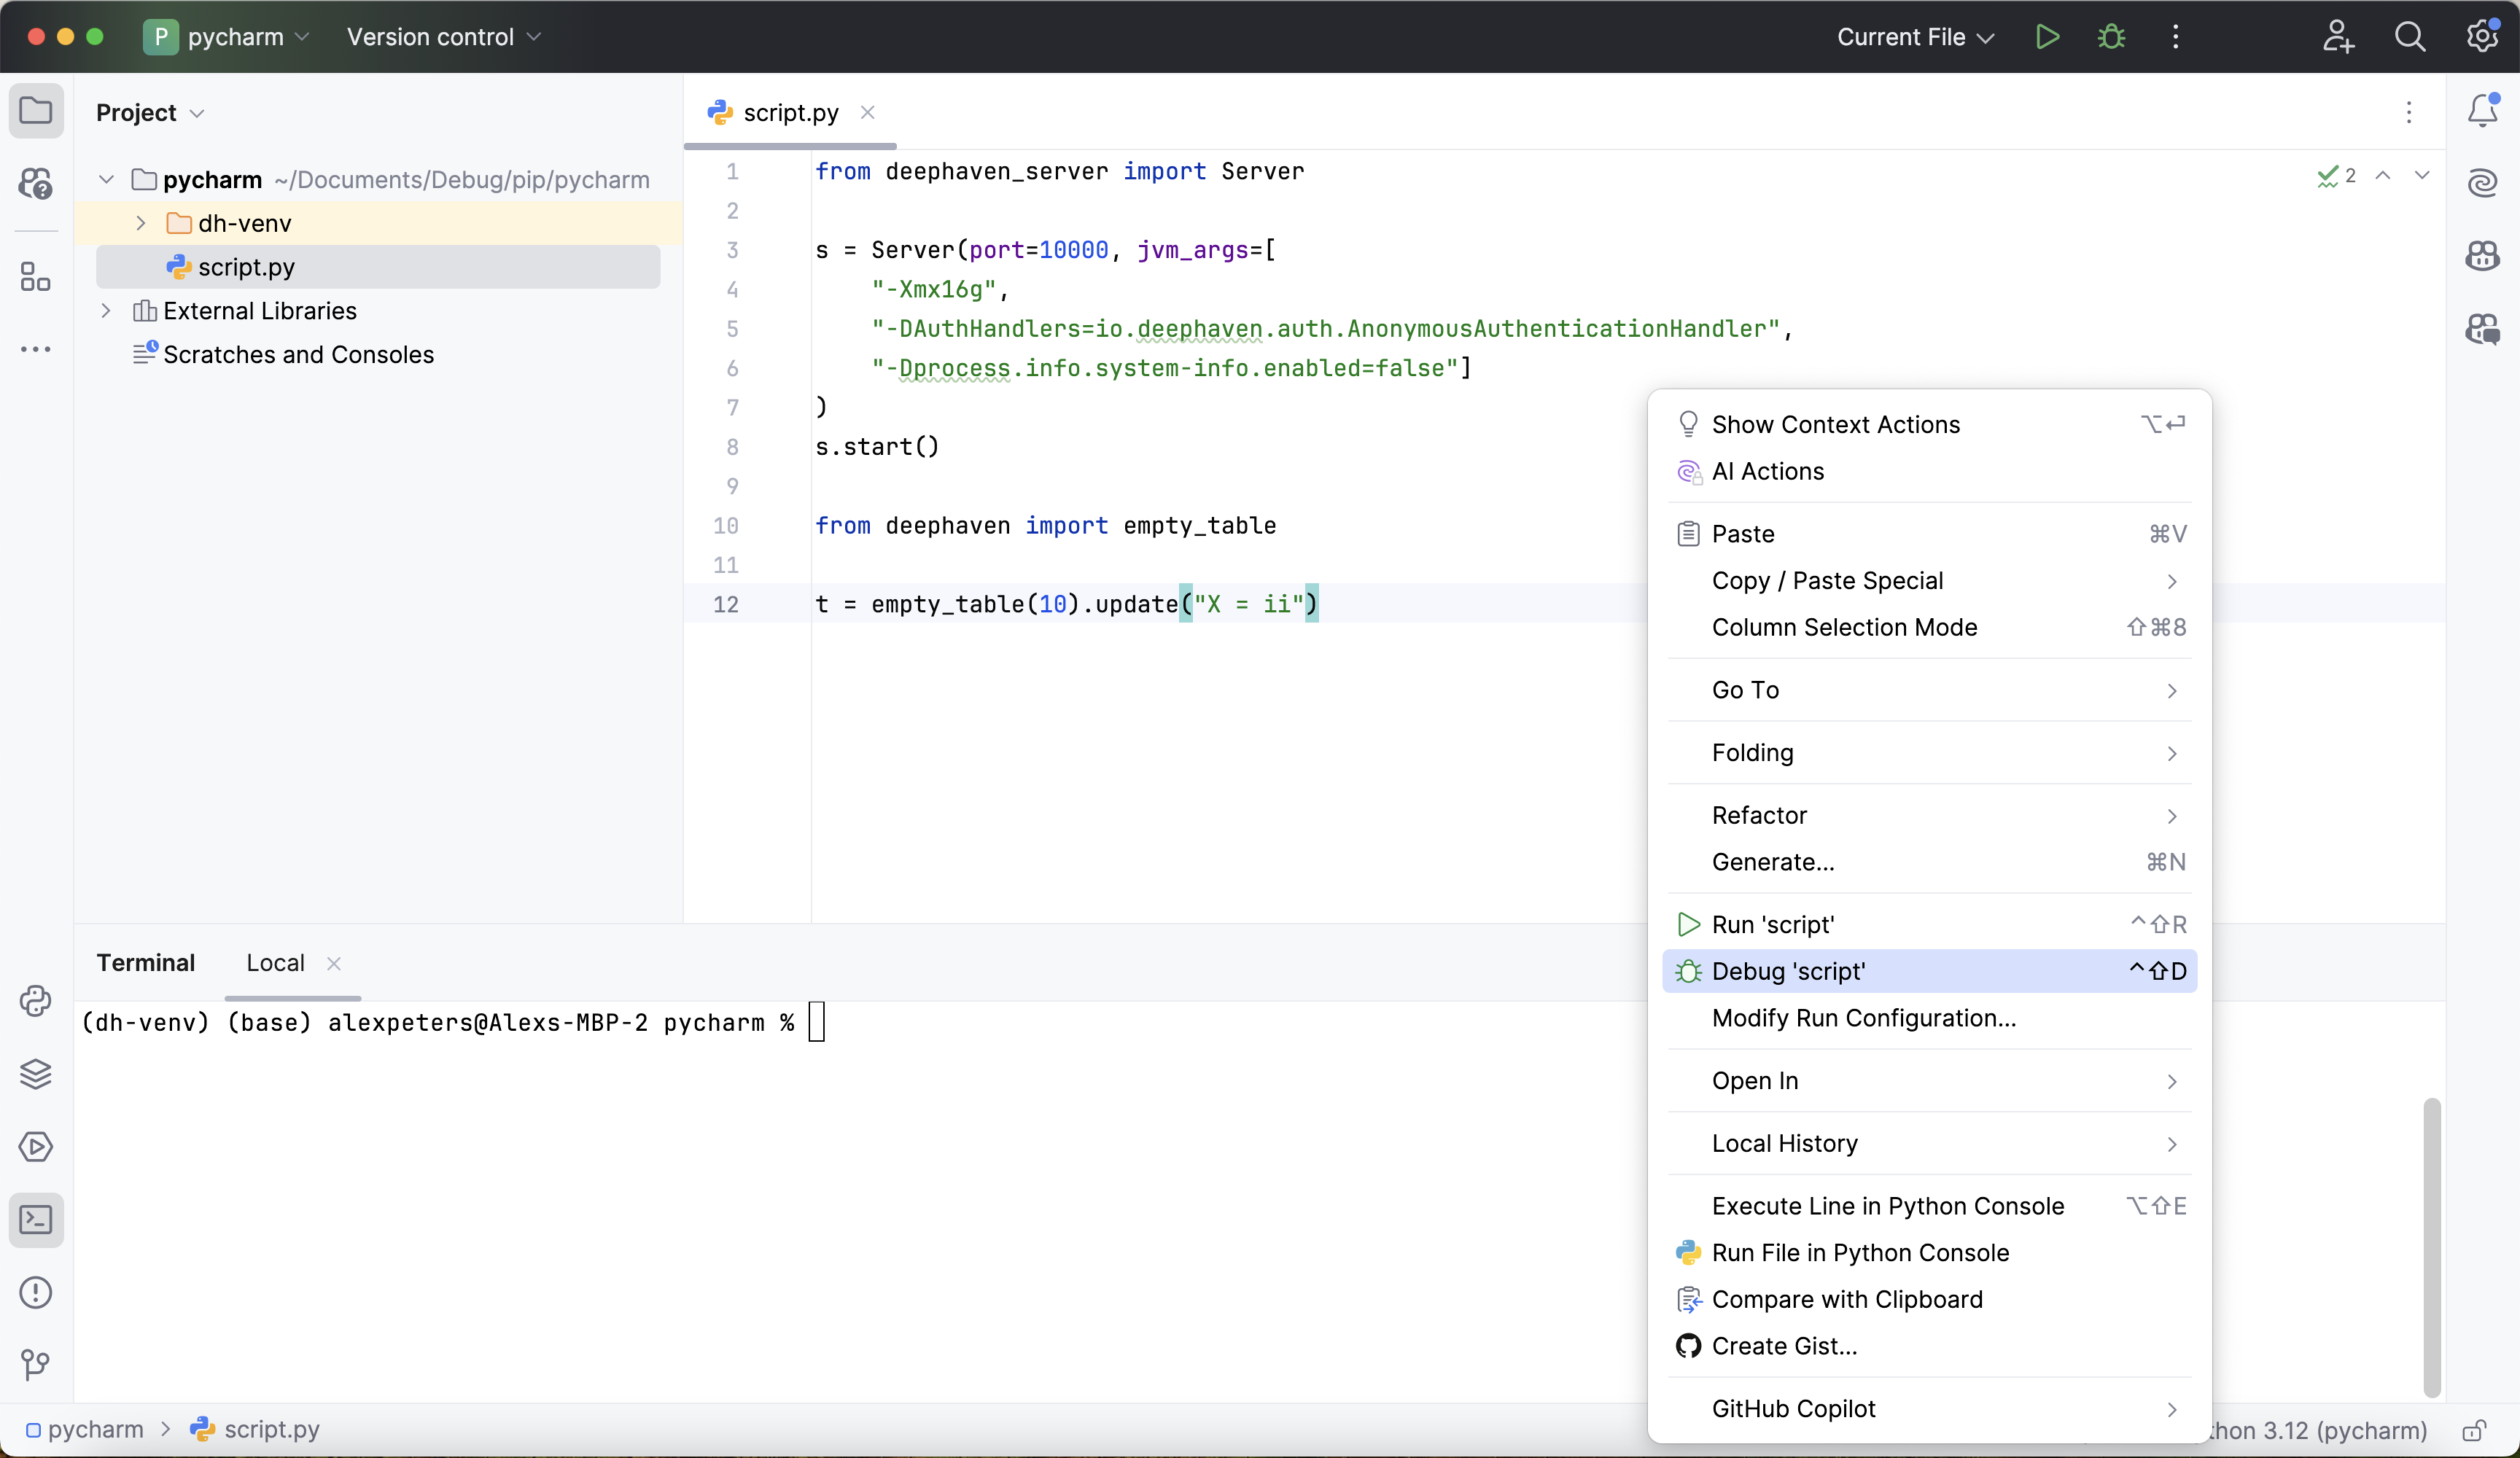
This starts the debugger and runs the test script in debug mode. If the test is successful, the debug console contains output like this:
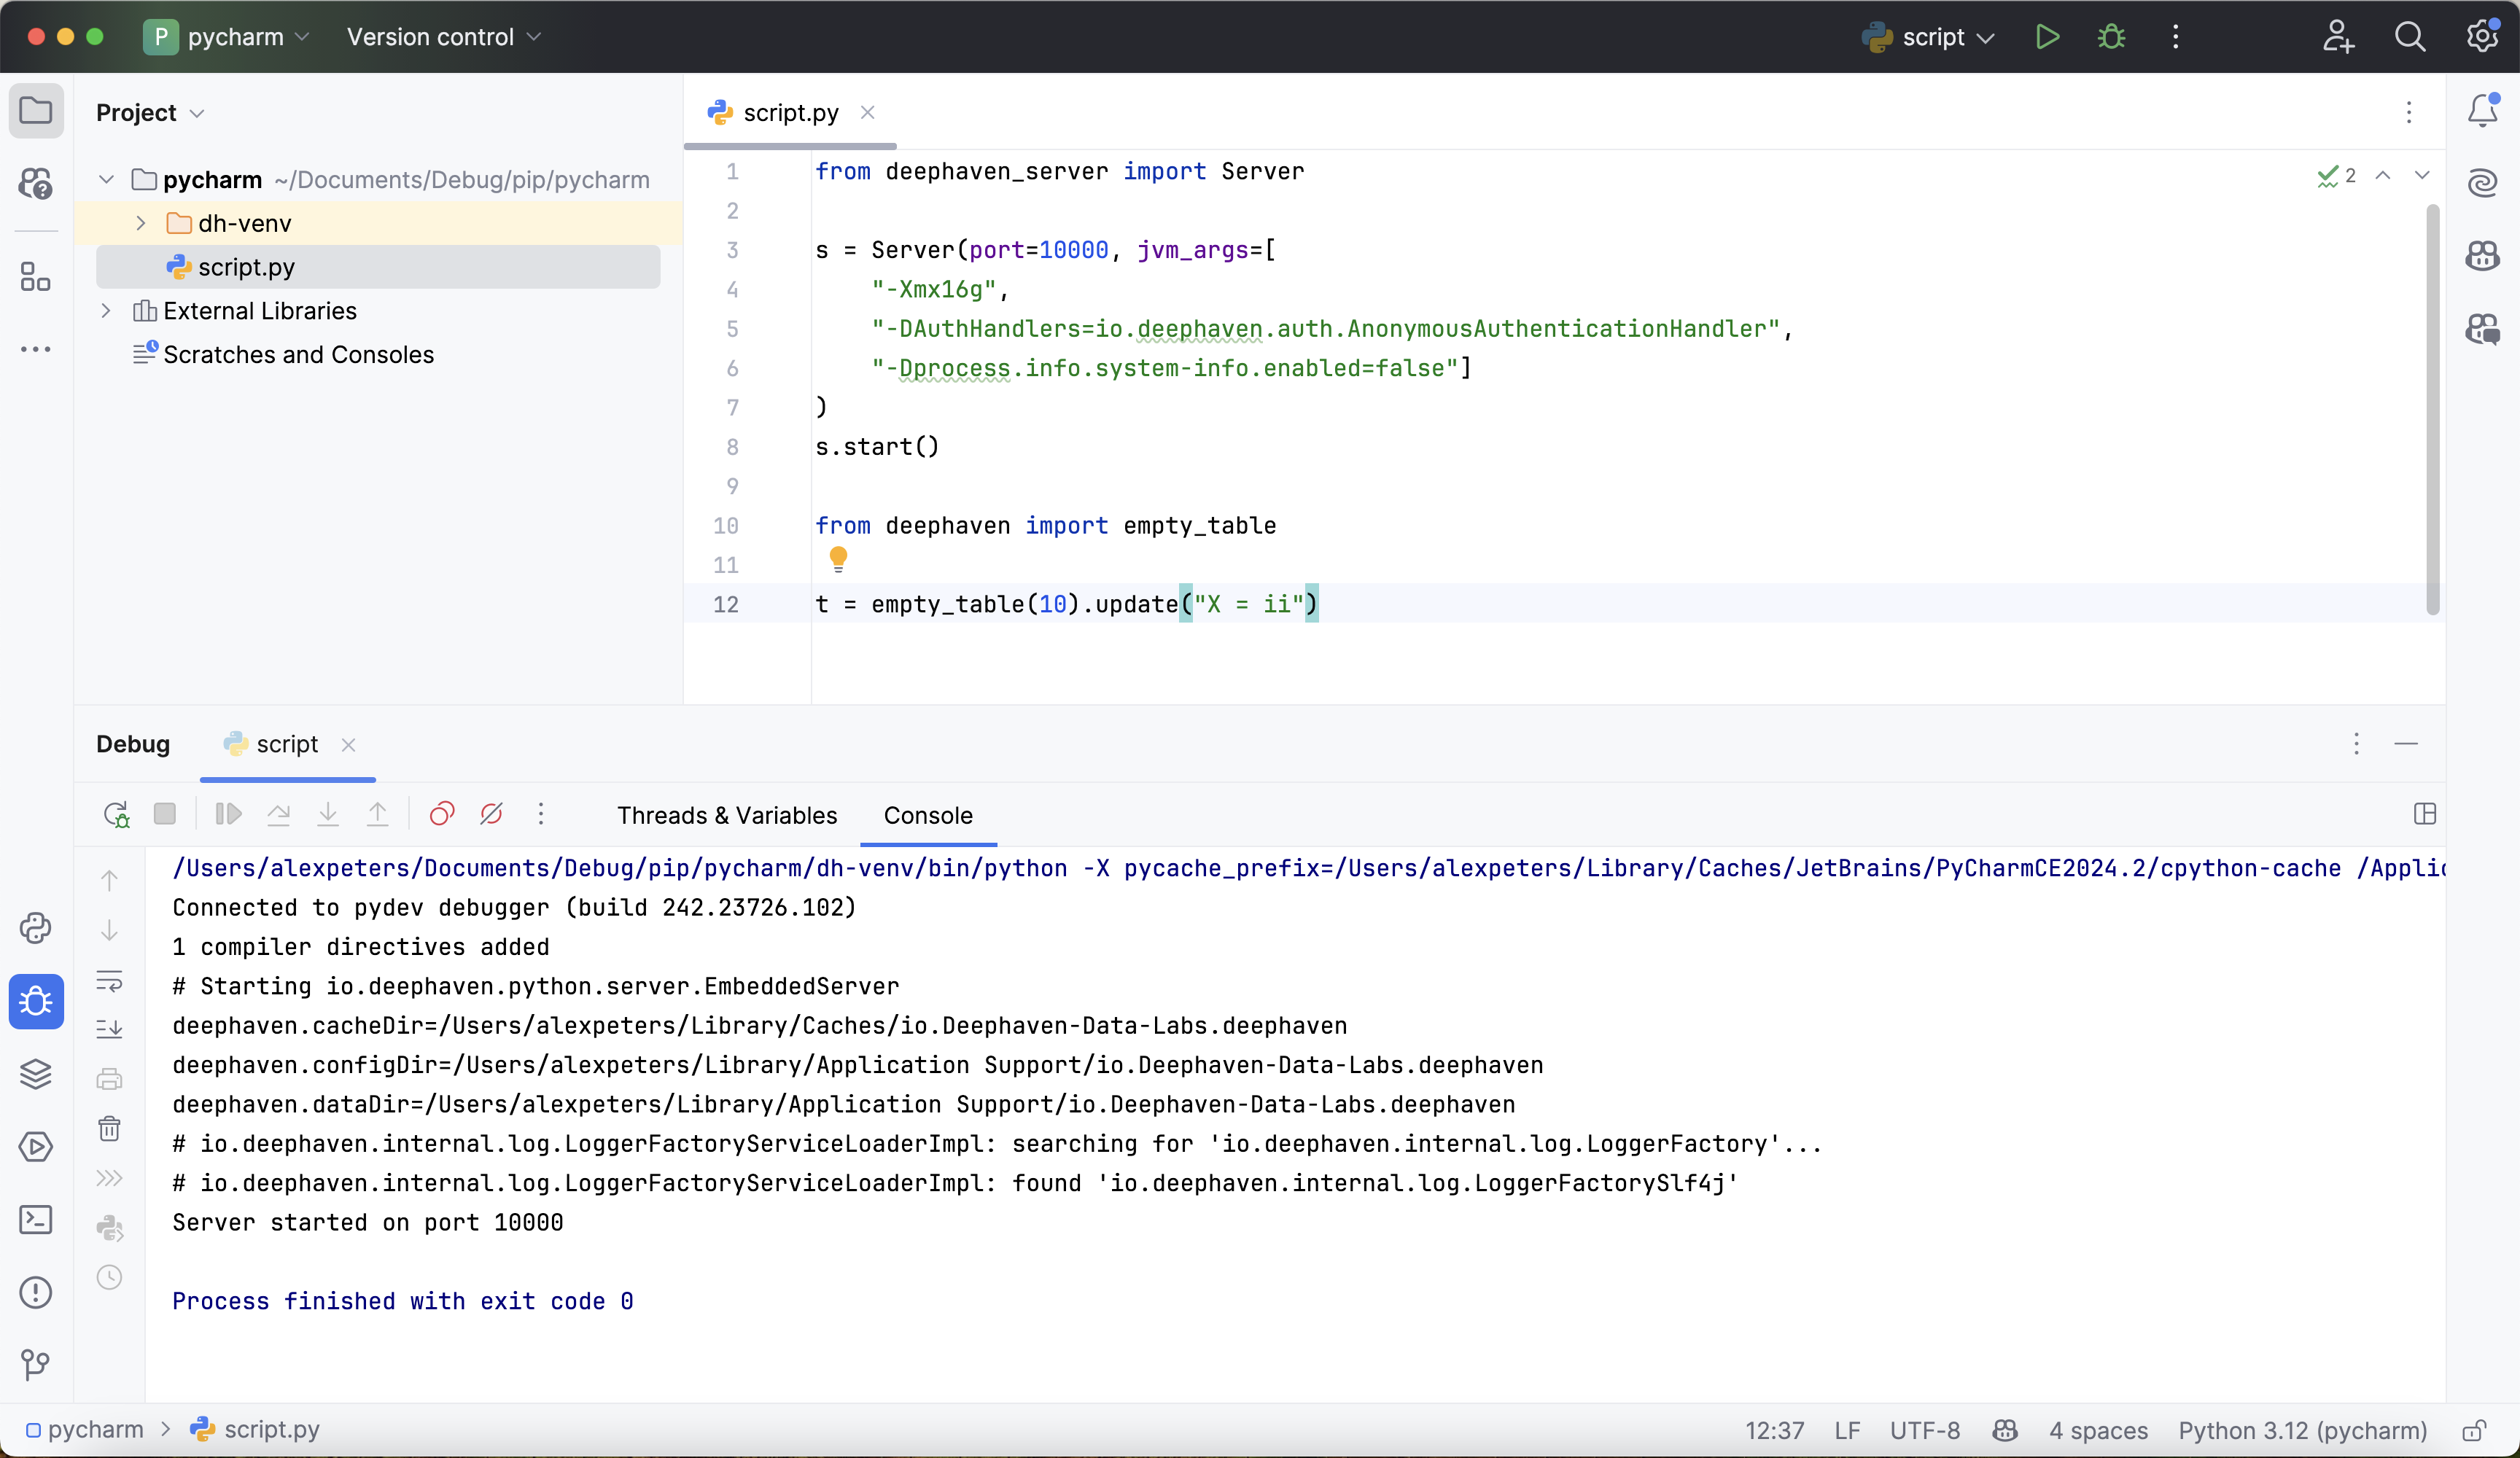
If the test fails, check for these causes:
- The Python interpreter isn't set to
dh-venv. Repeat step 1. - The Deephaven Python package isn't installed in
dh-venv. Runpip install deephaven-server. - Java 17 or later isn't installed, or
JAVA_HOMEisn't set. See the prerequisites.
3. Use the debugger with Deephaven
Once the debugger is set up and working, all of the features in PyCharm's debugger are available. Set breakpoints, step through functions, and inspect source code:
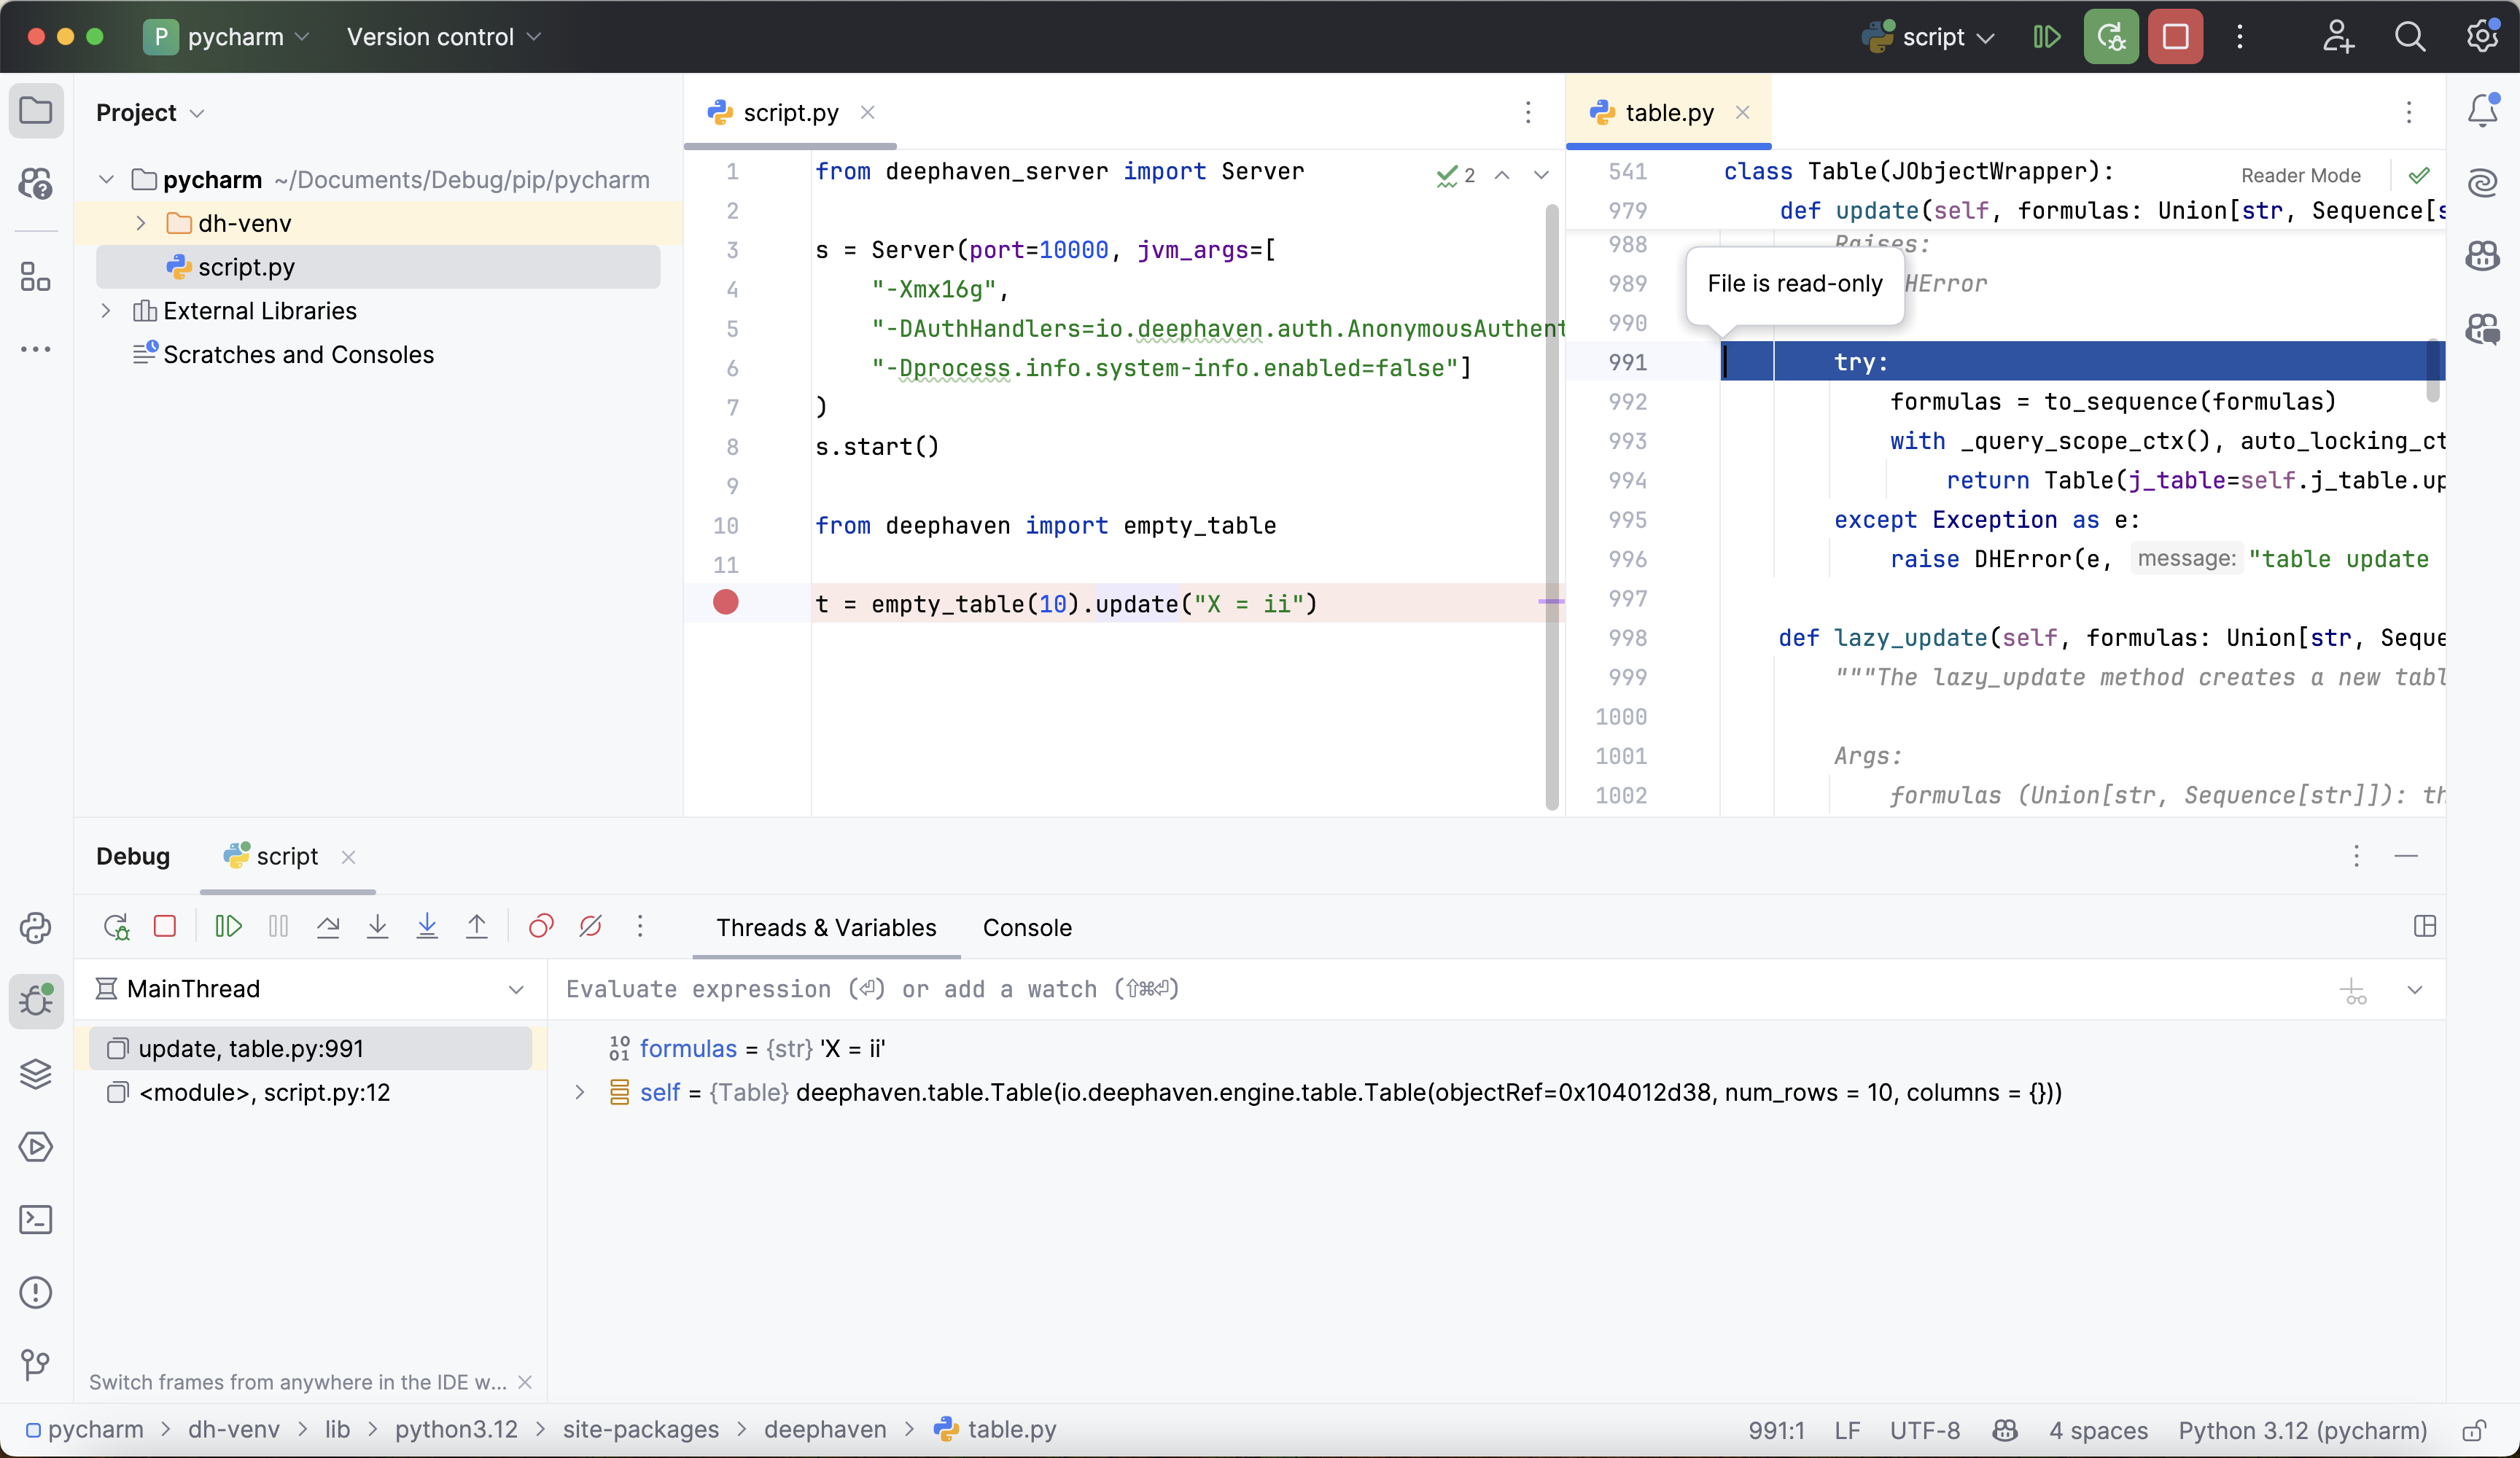
Deephaven has some debugging pitfalls of its own, such as lazy evaluation and ticking tables when your script starts the server. See Common problems when debugging Deephaven.
Local debugging with VS Code
Warning
Debugging Deephaven works with VS Code 1.94 and later. Deephaven hasn't tested earlier versions.
VS Code's built-in debugger is a good fit for Deephaven scripts that you run in VS Code. VS Code debugs Python with Microsoft's Python extension, which also installs the Python Debugger extension. Install the Python extension from the Extensions view before you continue.
If you already have the parent directory of dh-venv open in VS Code with dh-venv as its interpreter, skip to step 2.
1. Open the folder and select the interpreter
First, open the parent directory of dh-venv in VS Code with File > Open Folder. On Windows, run WSL: Connect to WSL before this step and open the folder from the WSL window, as described in Setup. After you open the folder, the Explorer shows dh-venv:
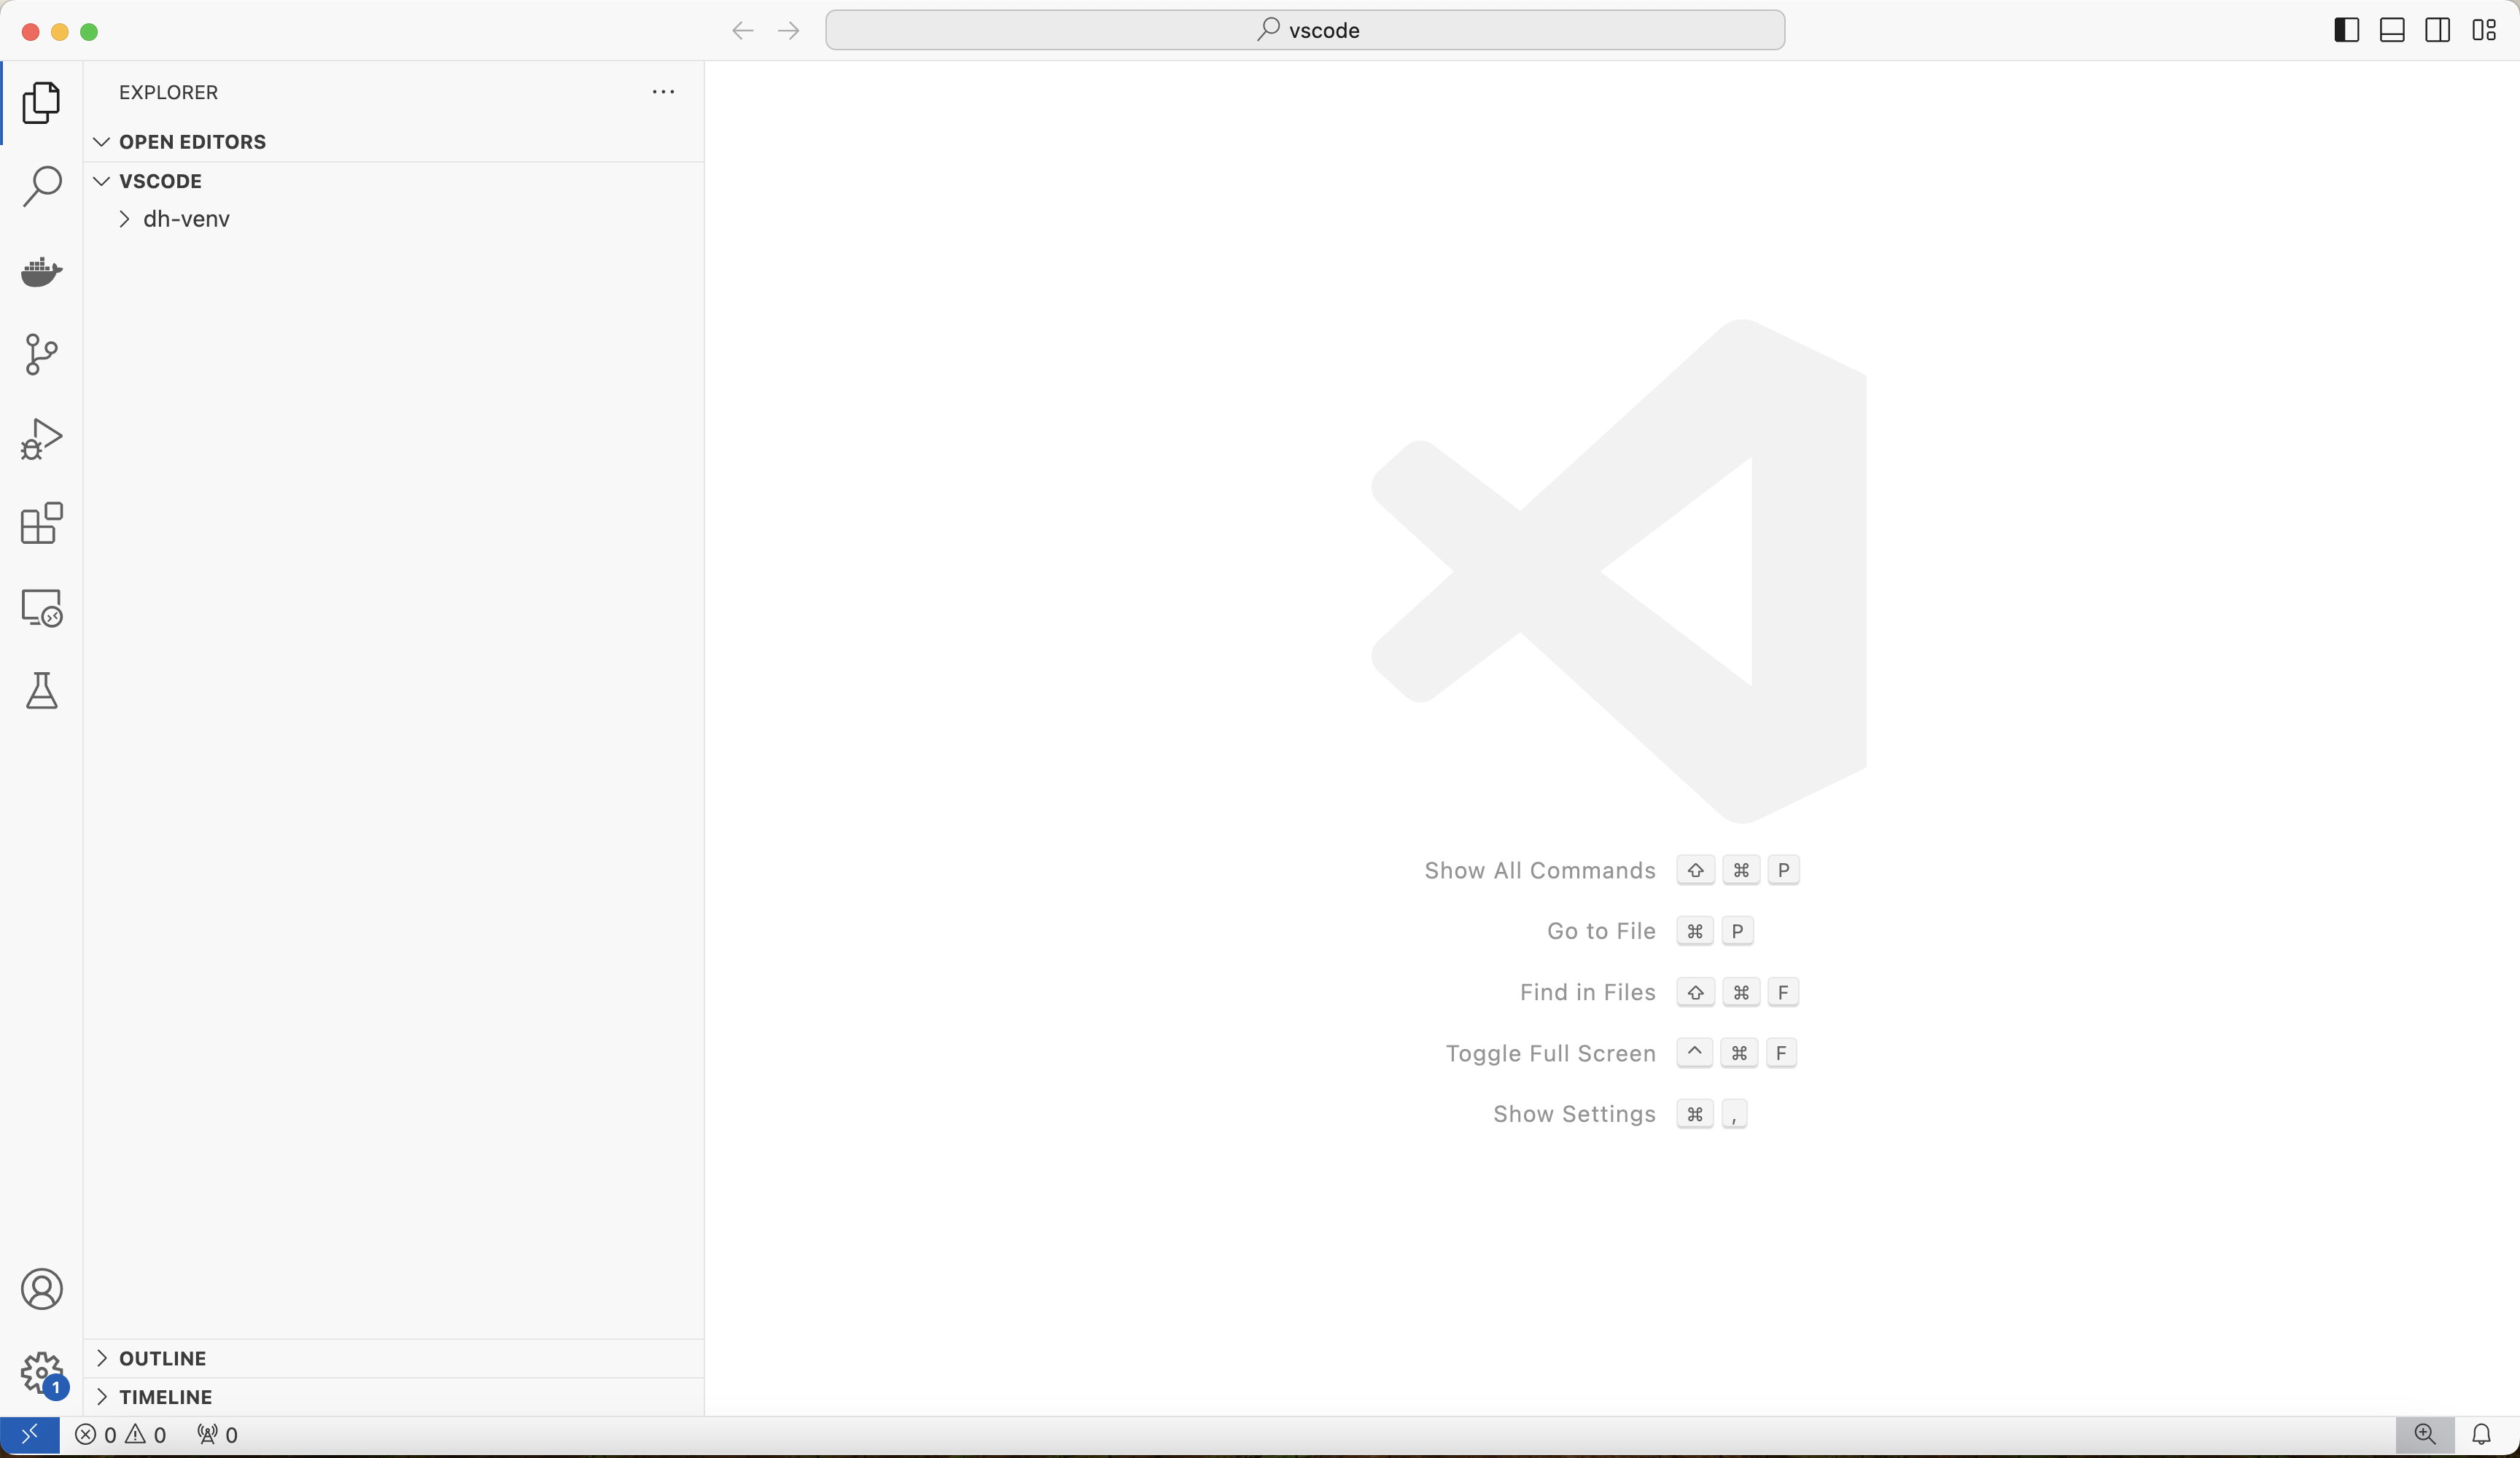
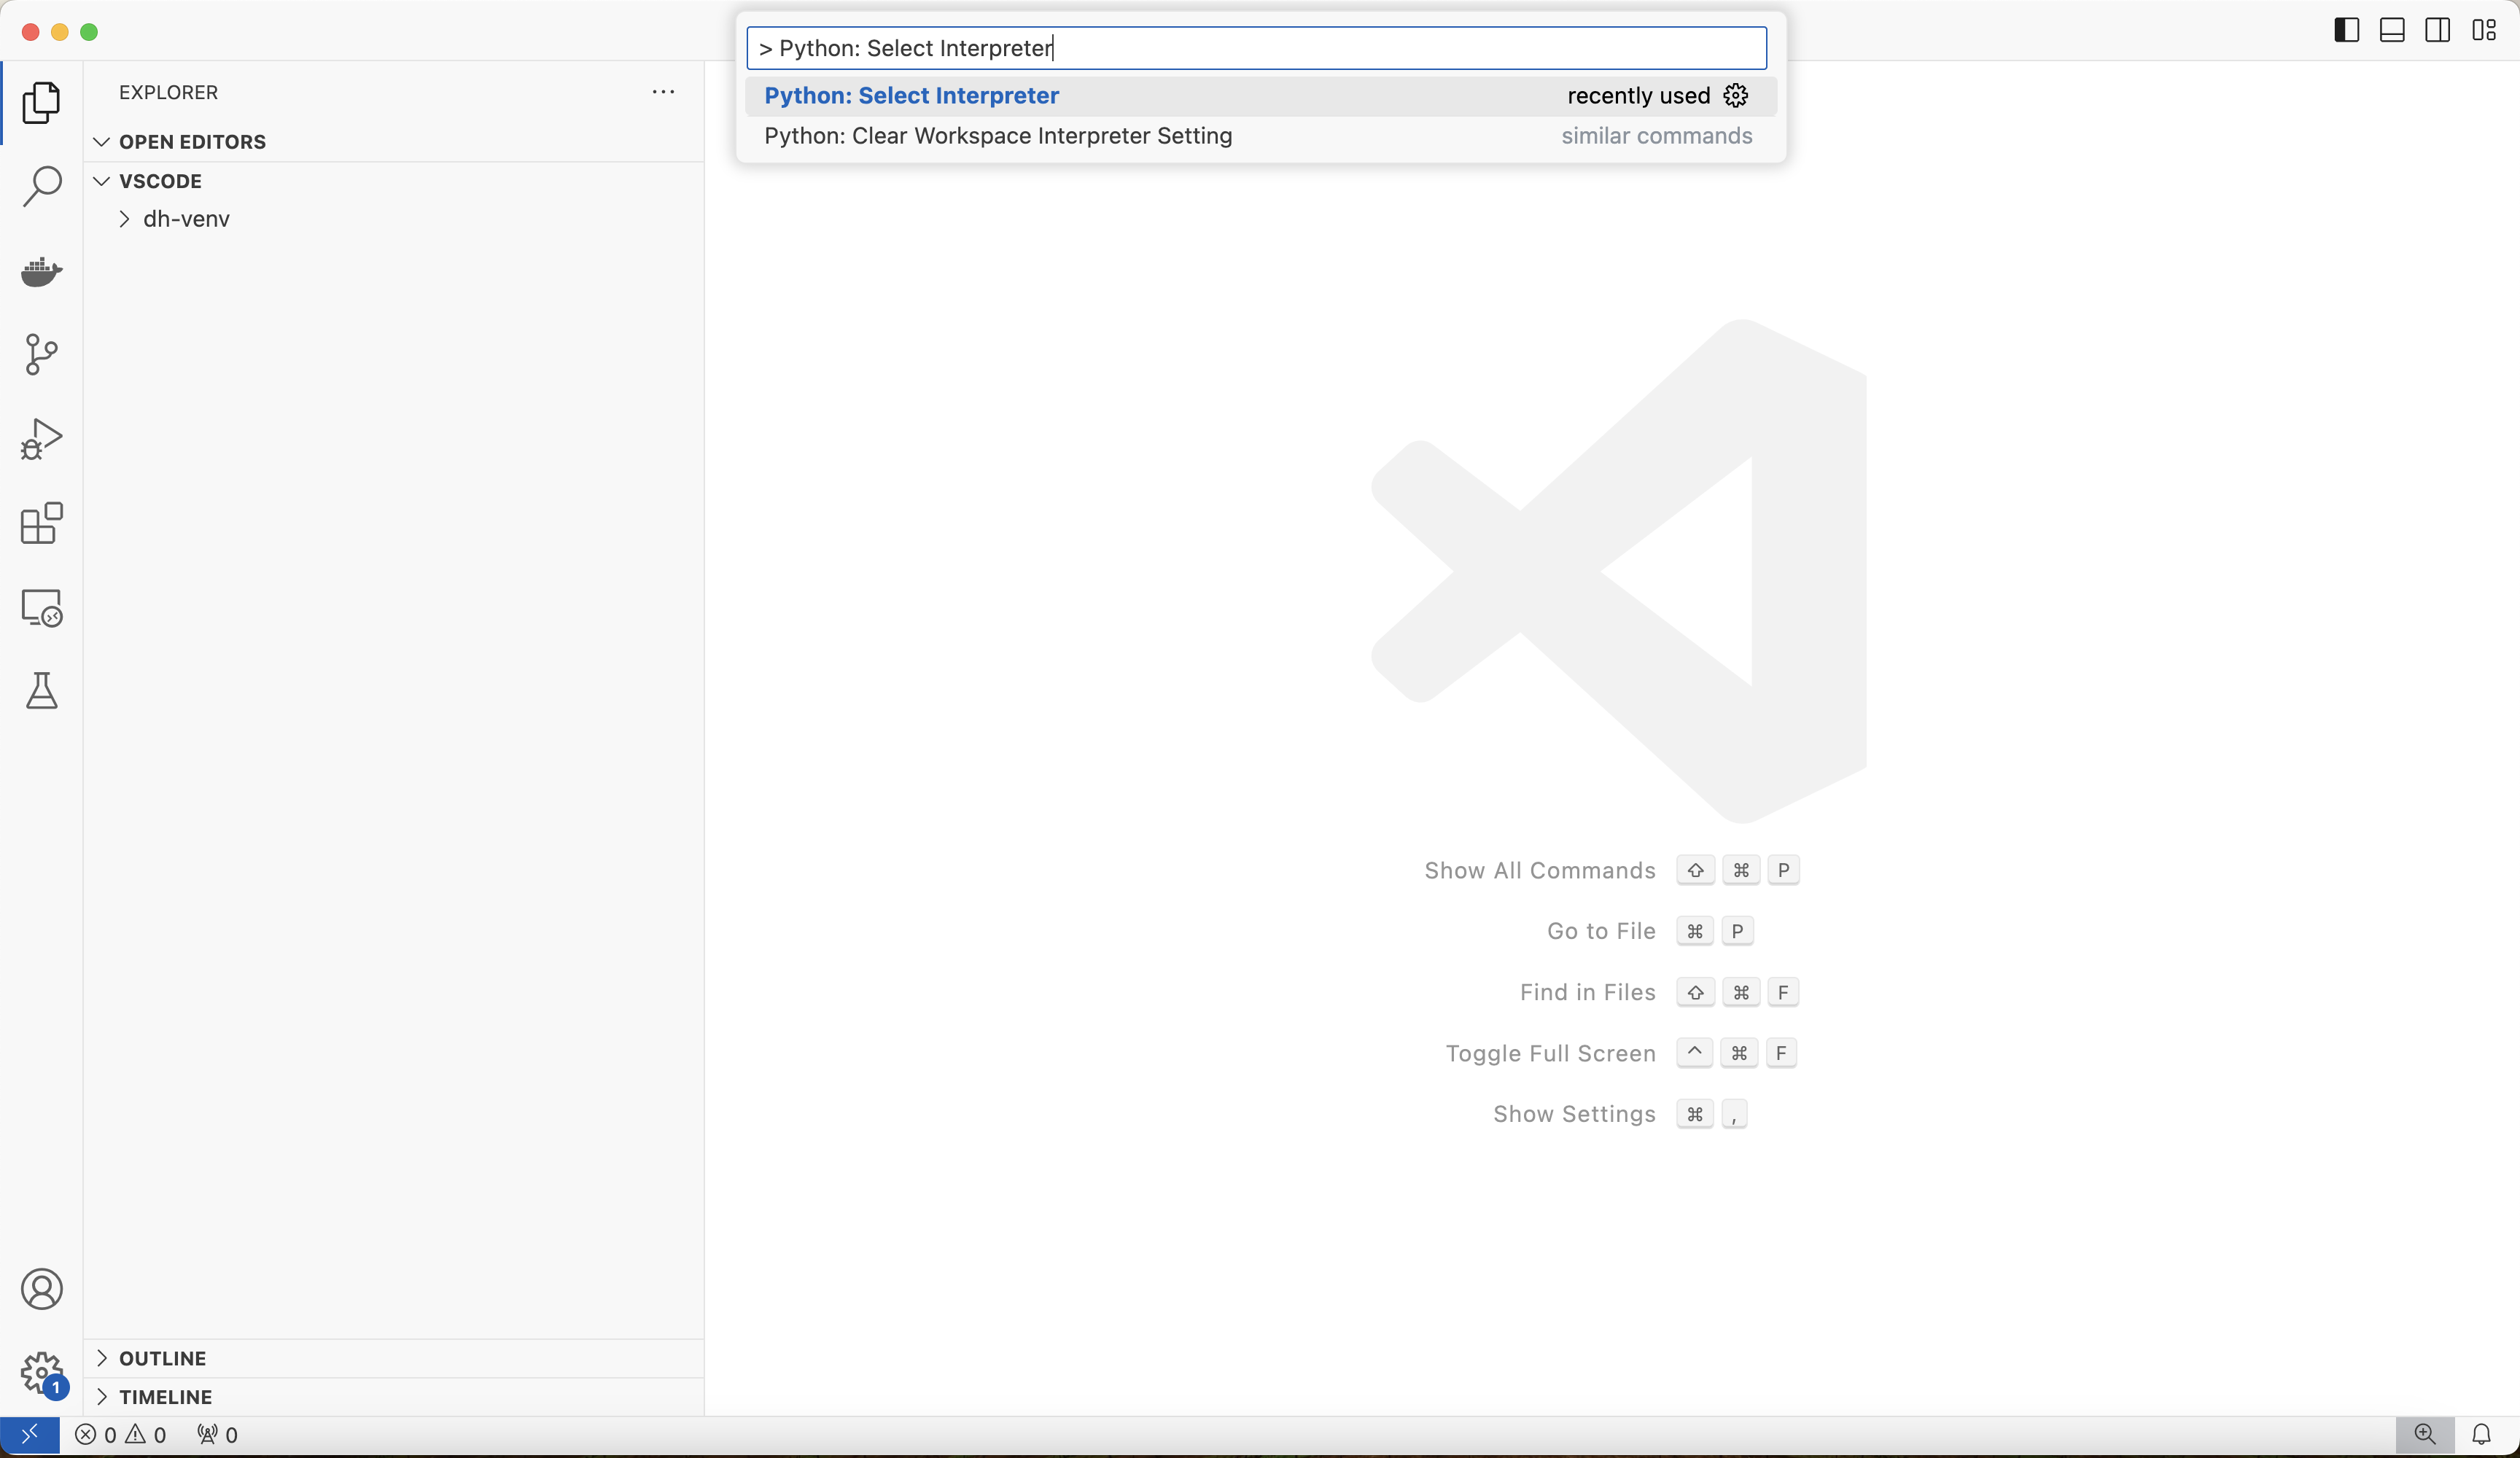
Then, configure the interpreter by typing > Python: Select Interpreter into the command palette at the top:
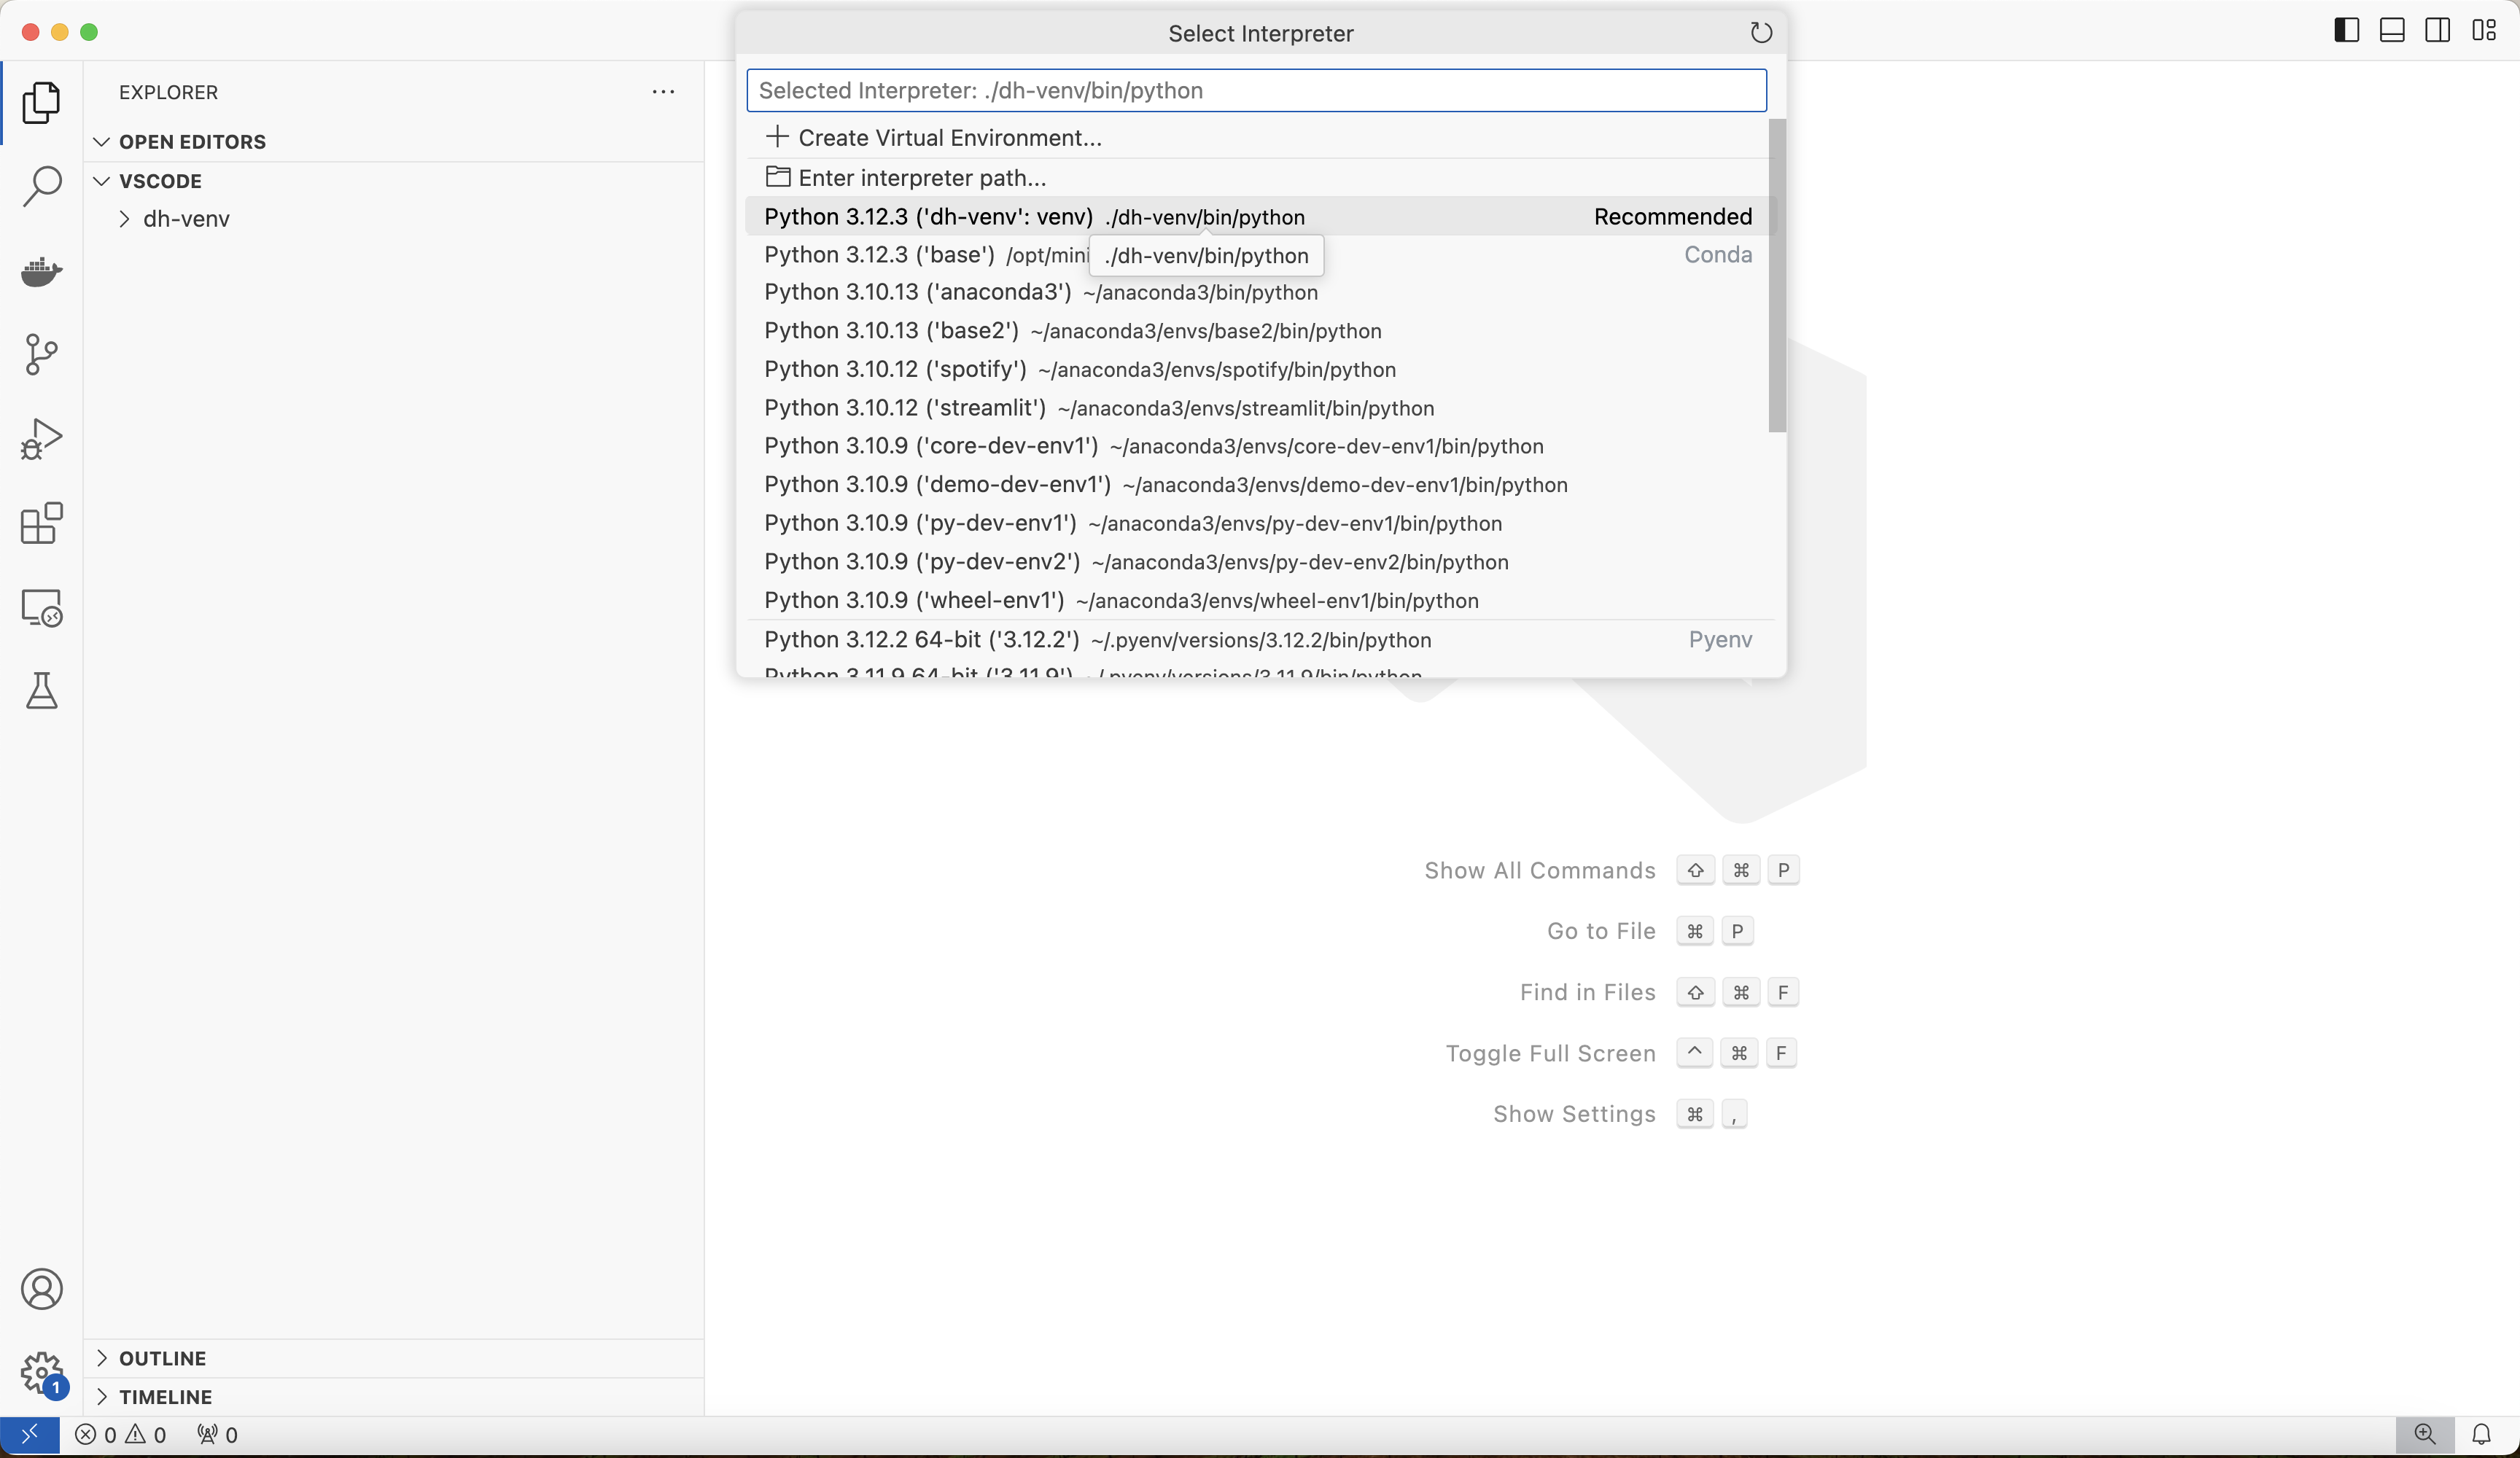
Select the dh-venv environment that you created in Setup. VS Code may recommend that environment by default since it's present in the project directory:
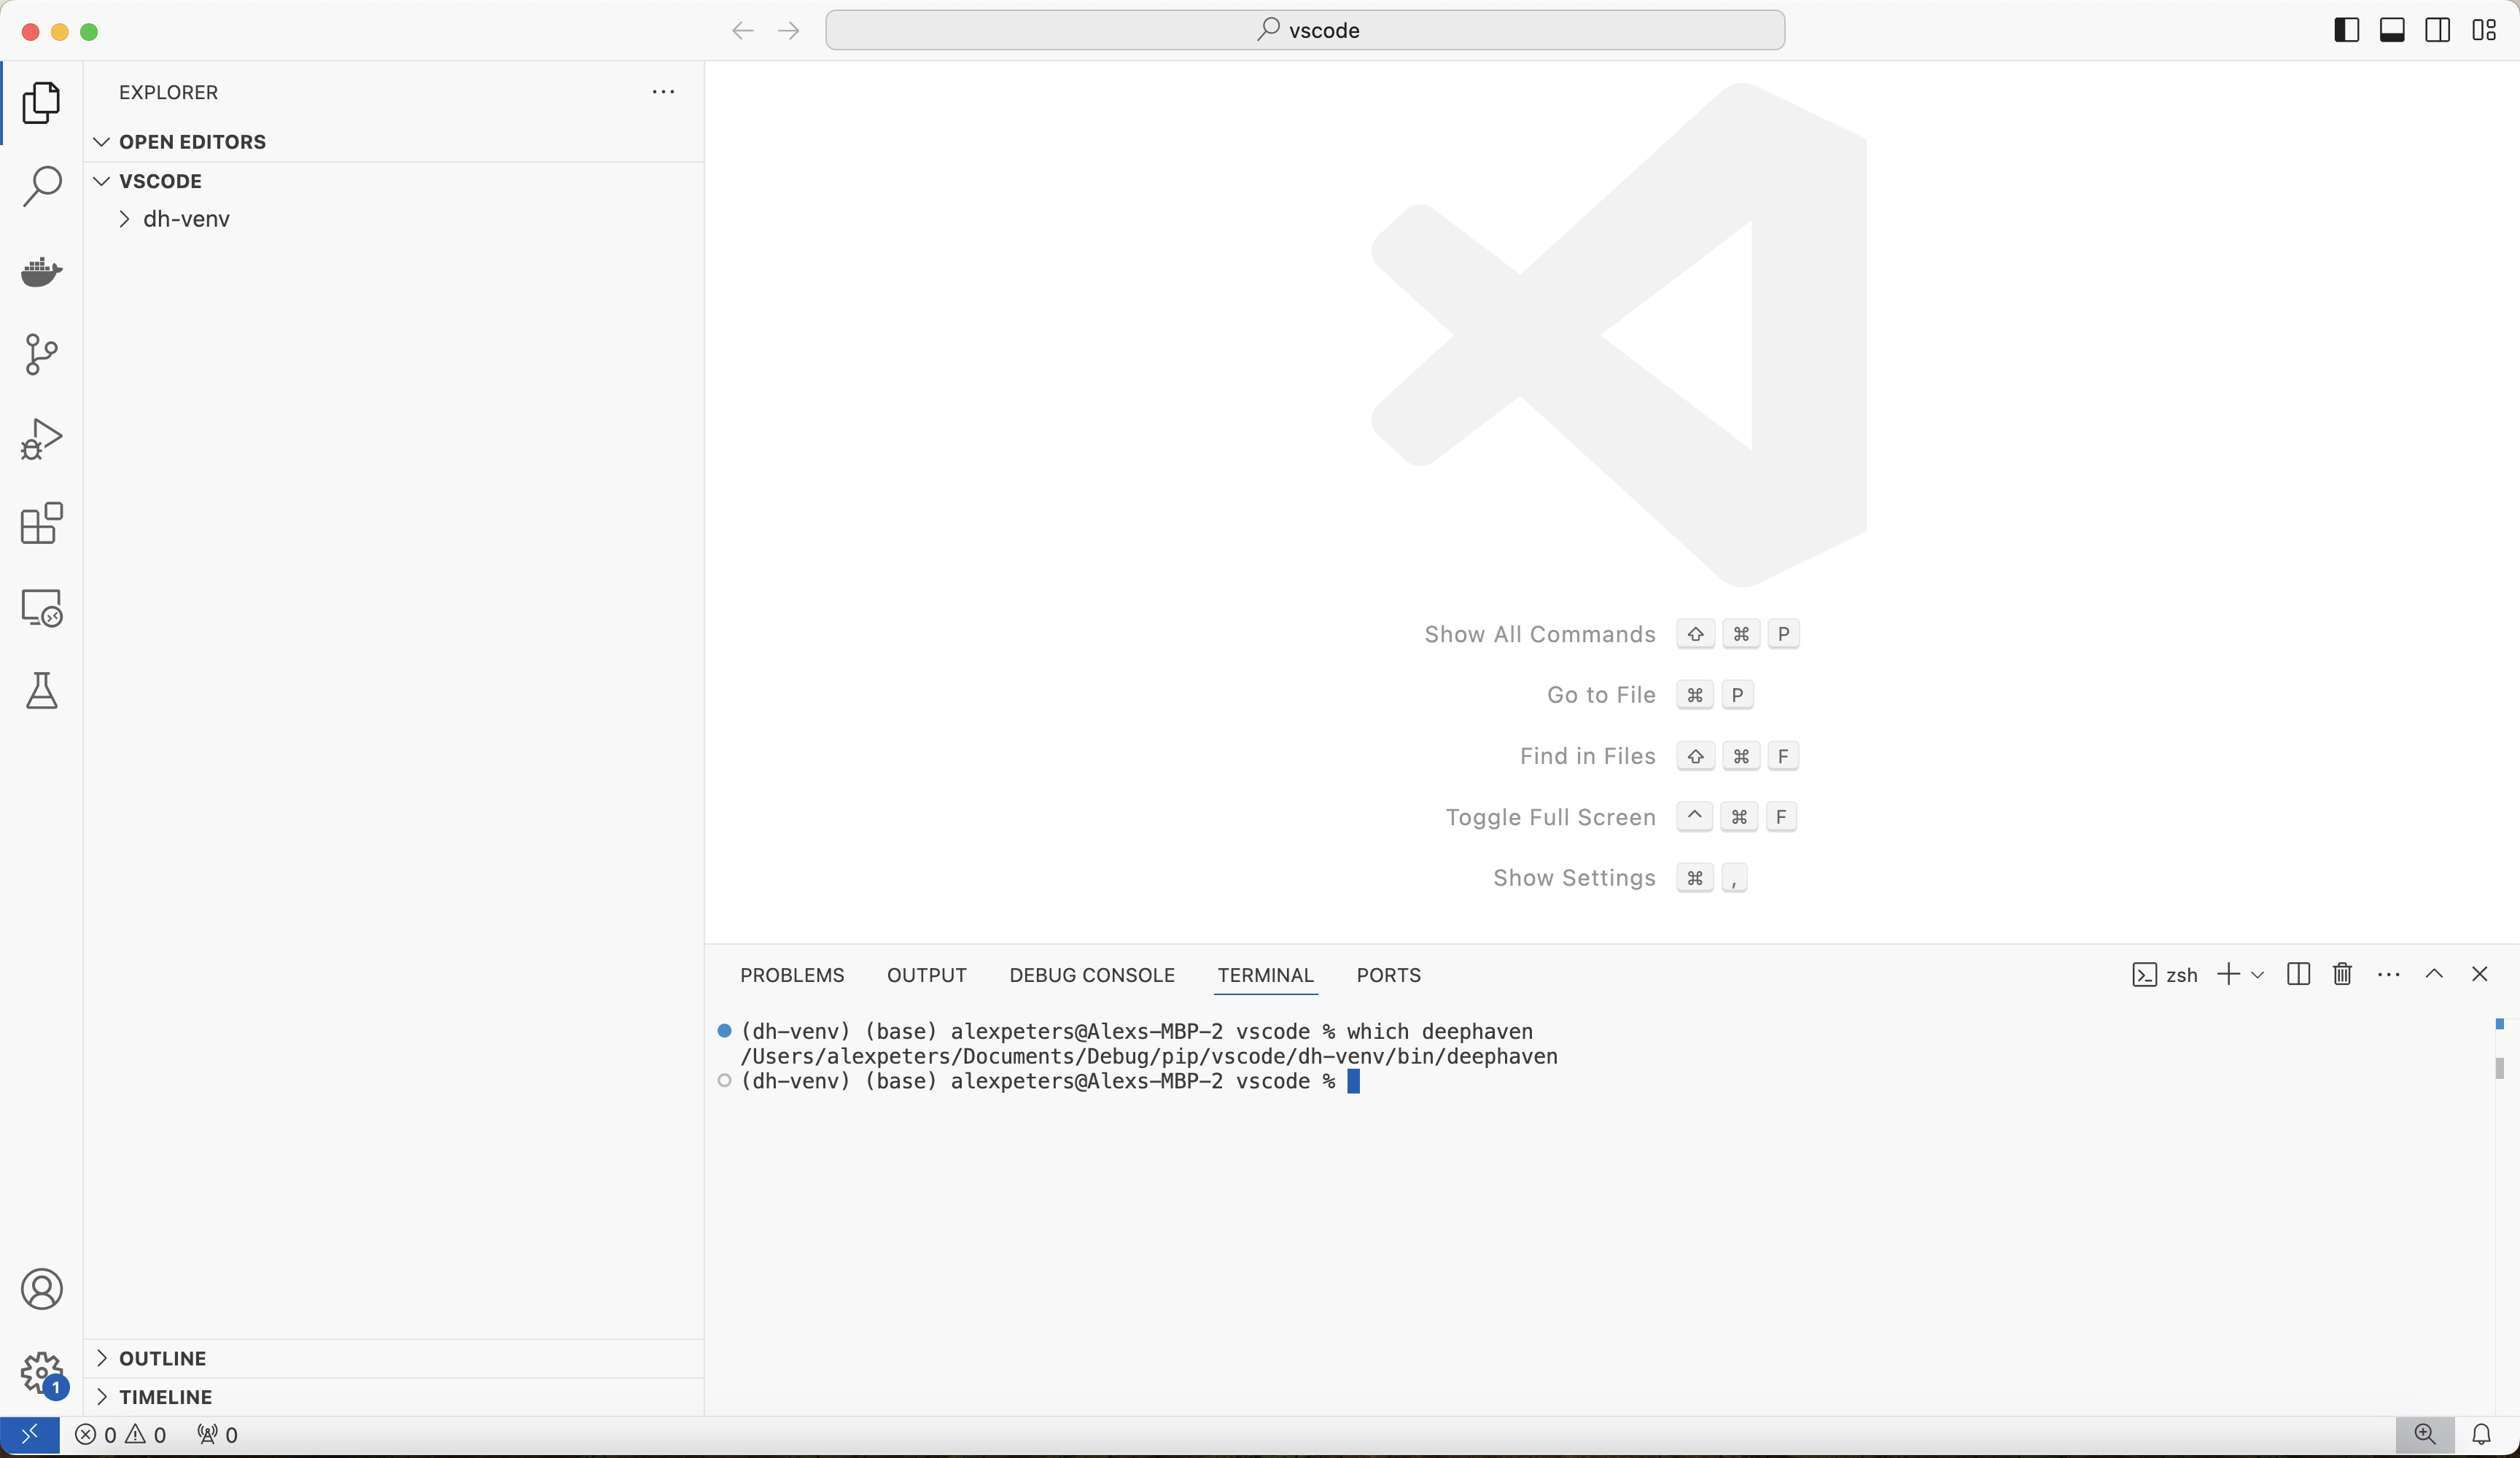
Verify that the interpreter is configured correctly by opening a terminal and running which deephaven. It should return the path of the deephaven command inside the dh-venv directory of your project:
2. Test the debugger
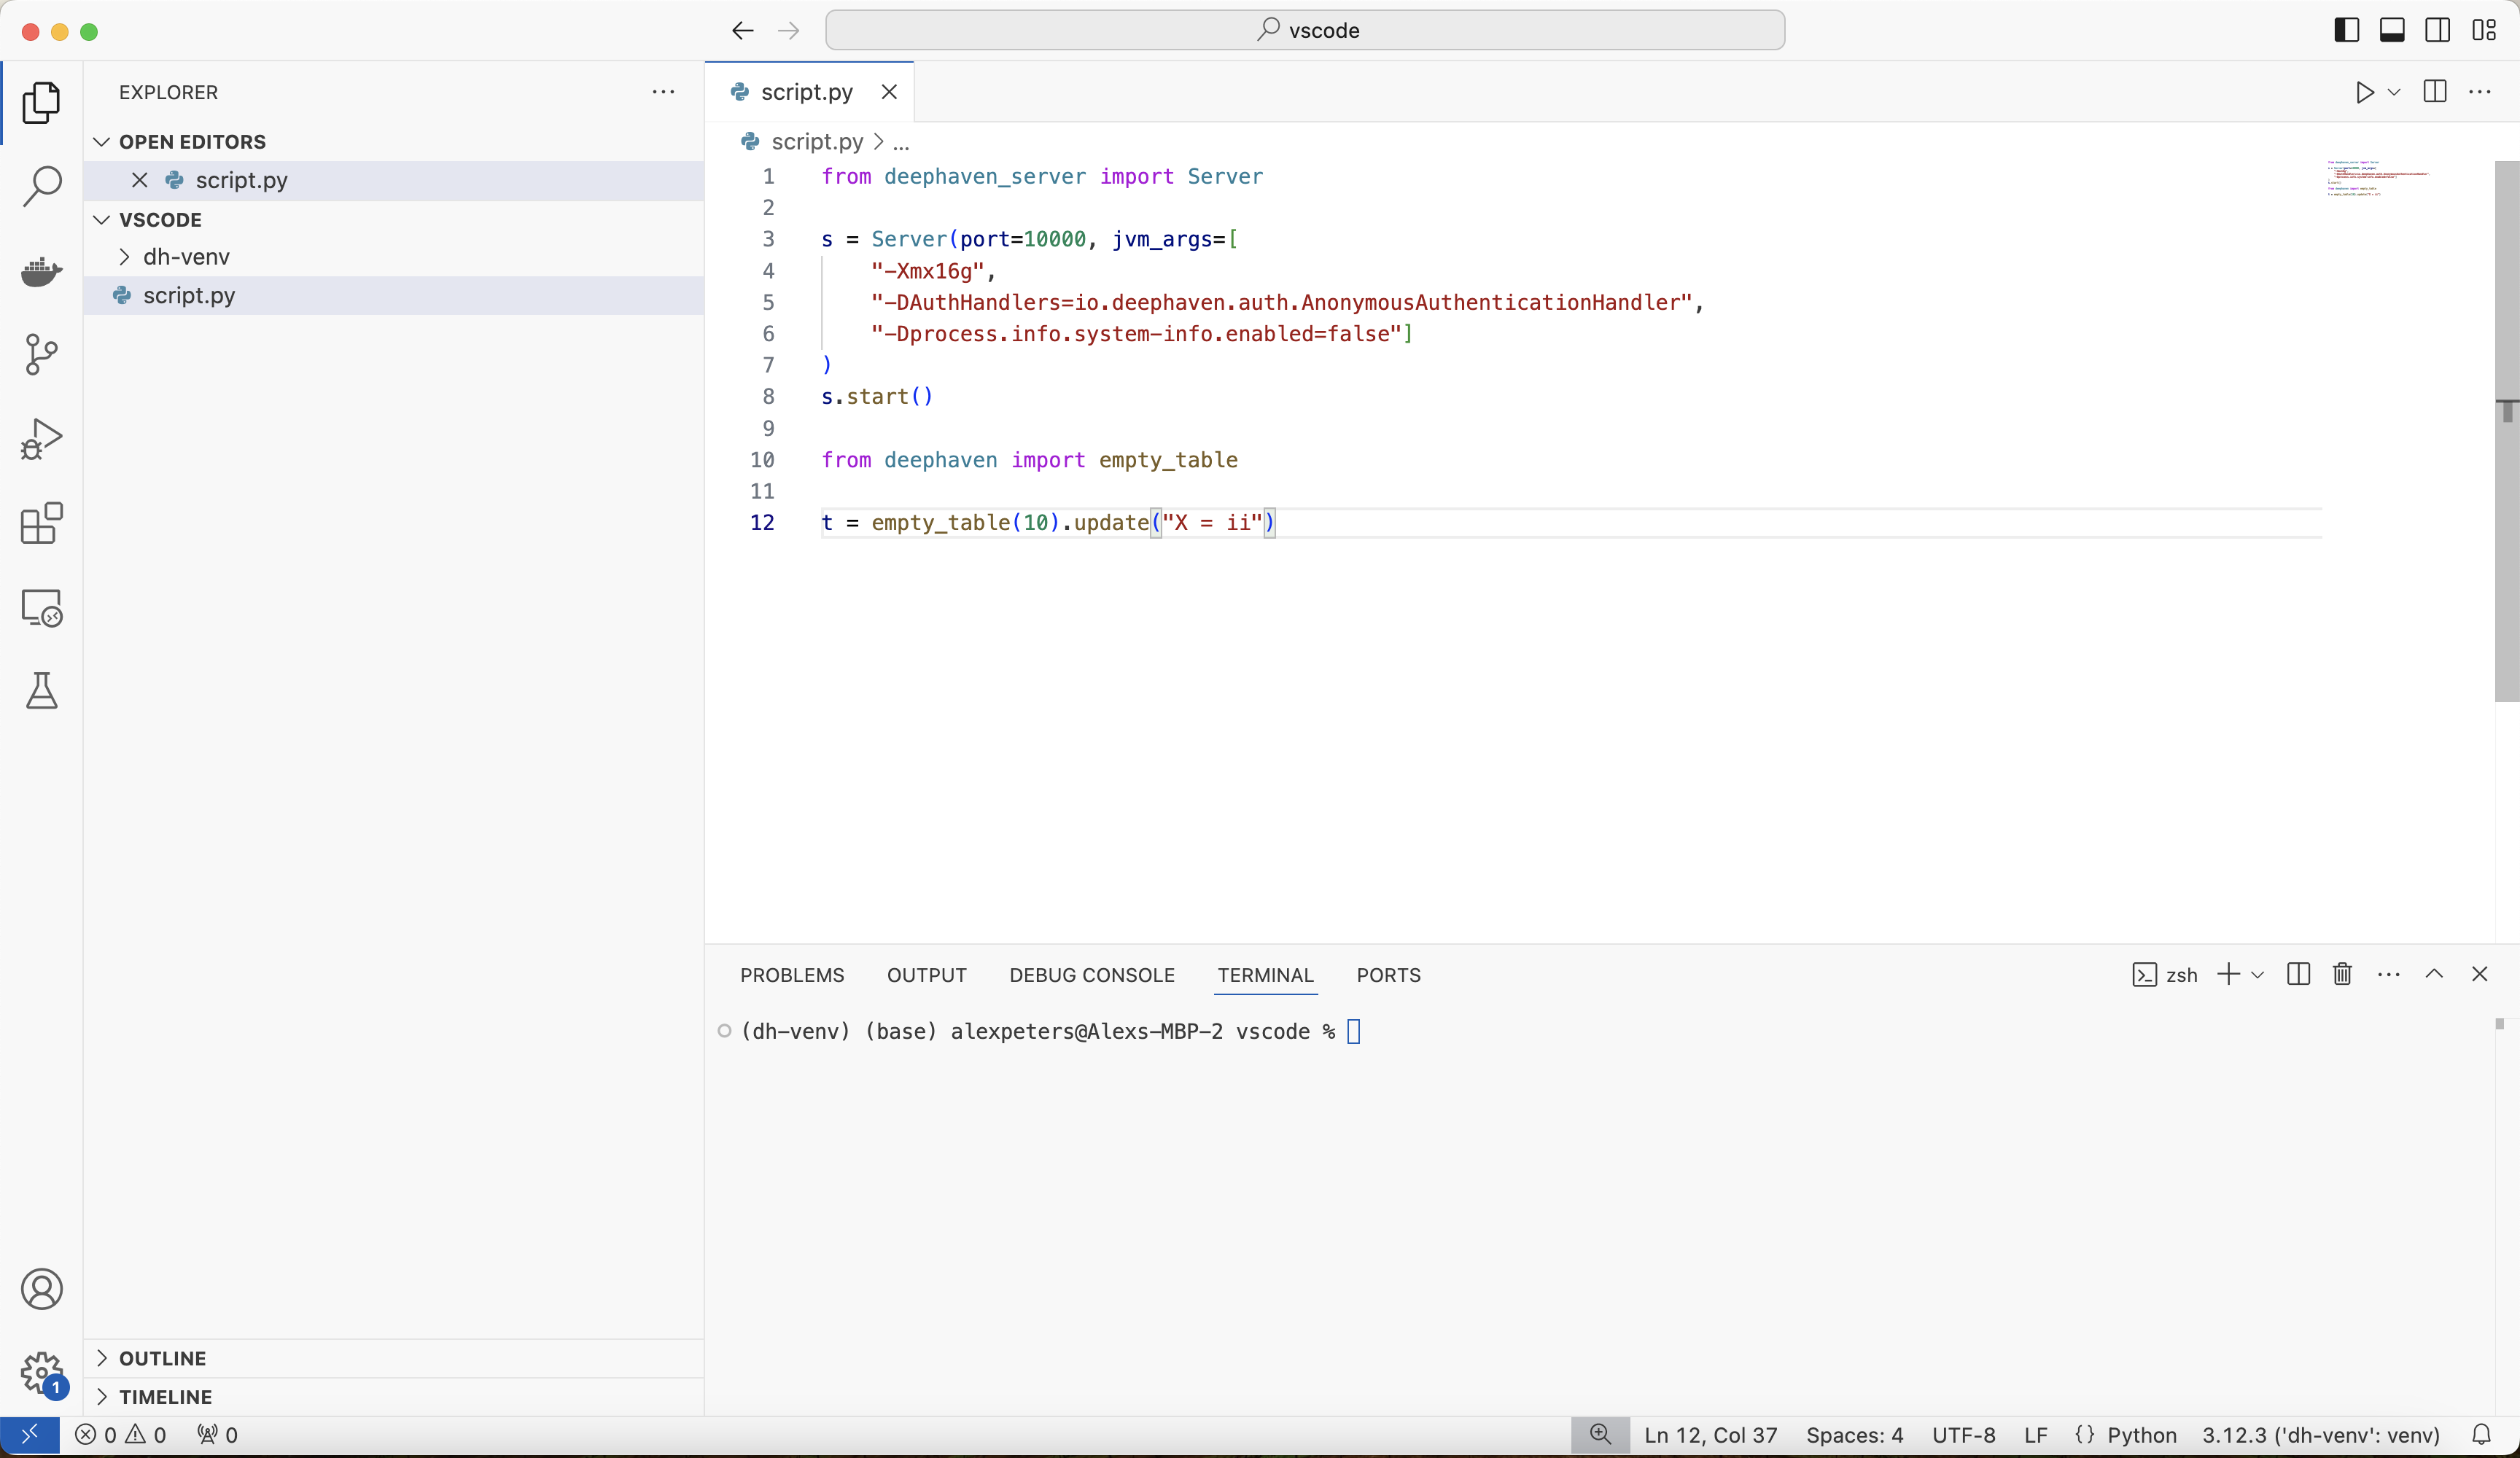
To ensure that the debugger is configured correctly, create a script called script.py that starts the Deephaven server and runs a command. It is the same test script as in the PyCharm section. The script passes two JVM arguments, and debugging needs neither of them:
-Xmx4gsets a 4 GB maximum heap. Adjust or remove it to suit your machine.-Dprocess.info.system-info.enabled=falseturns off the collection of system information when the server starts. You can remove it, except on M2 Macs, where the pip install guide recommends keeping it.
The screenshot shows an earlier version of the script, with -Xmx16g and an -DAuthHandlers=io.deephaven.auth.AnonymousAuthenticationHandler argument. That argument replaces the default pre-shared key login with anonymous authentication, which lets anyone who can reach the server connect. Leave it out of your script.
Expand for test script
Click on the small downward-facing arrow toward the top-right corner of the screen and select Python Debugger: Debug Python File:
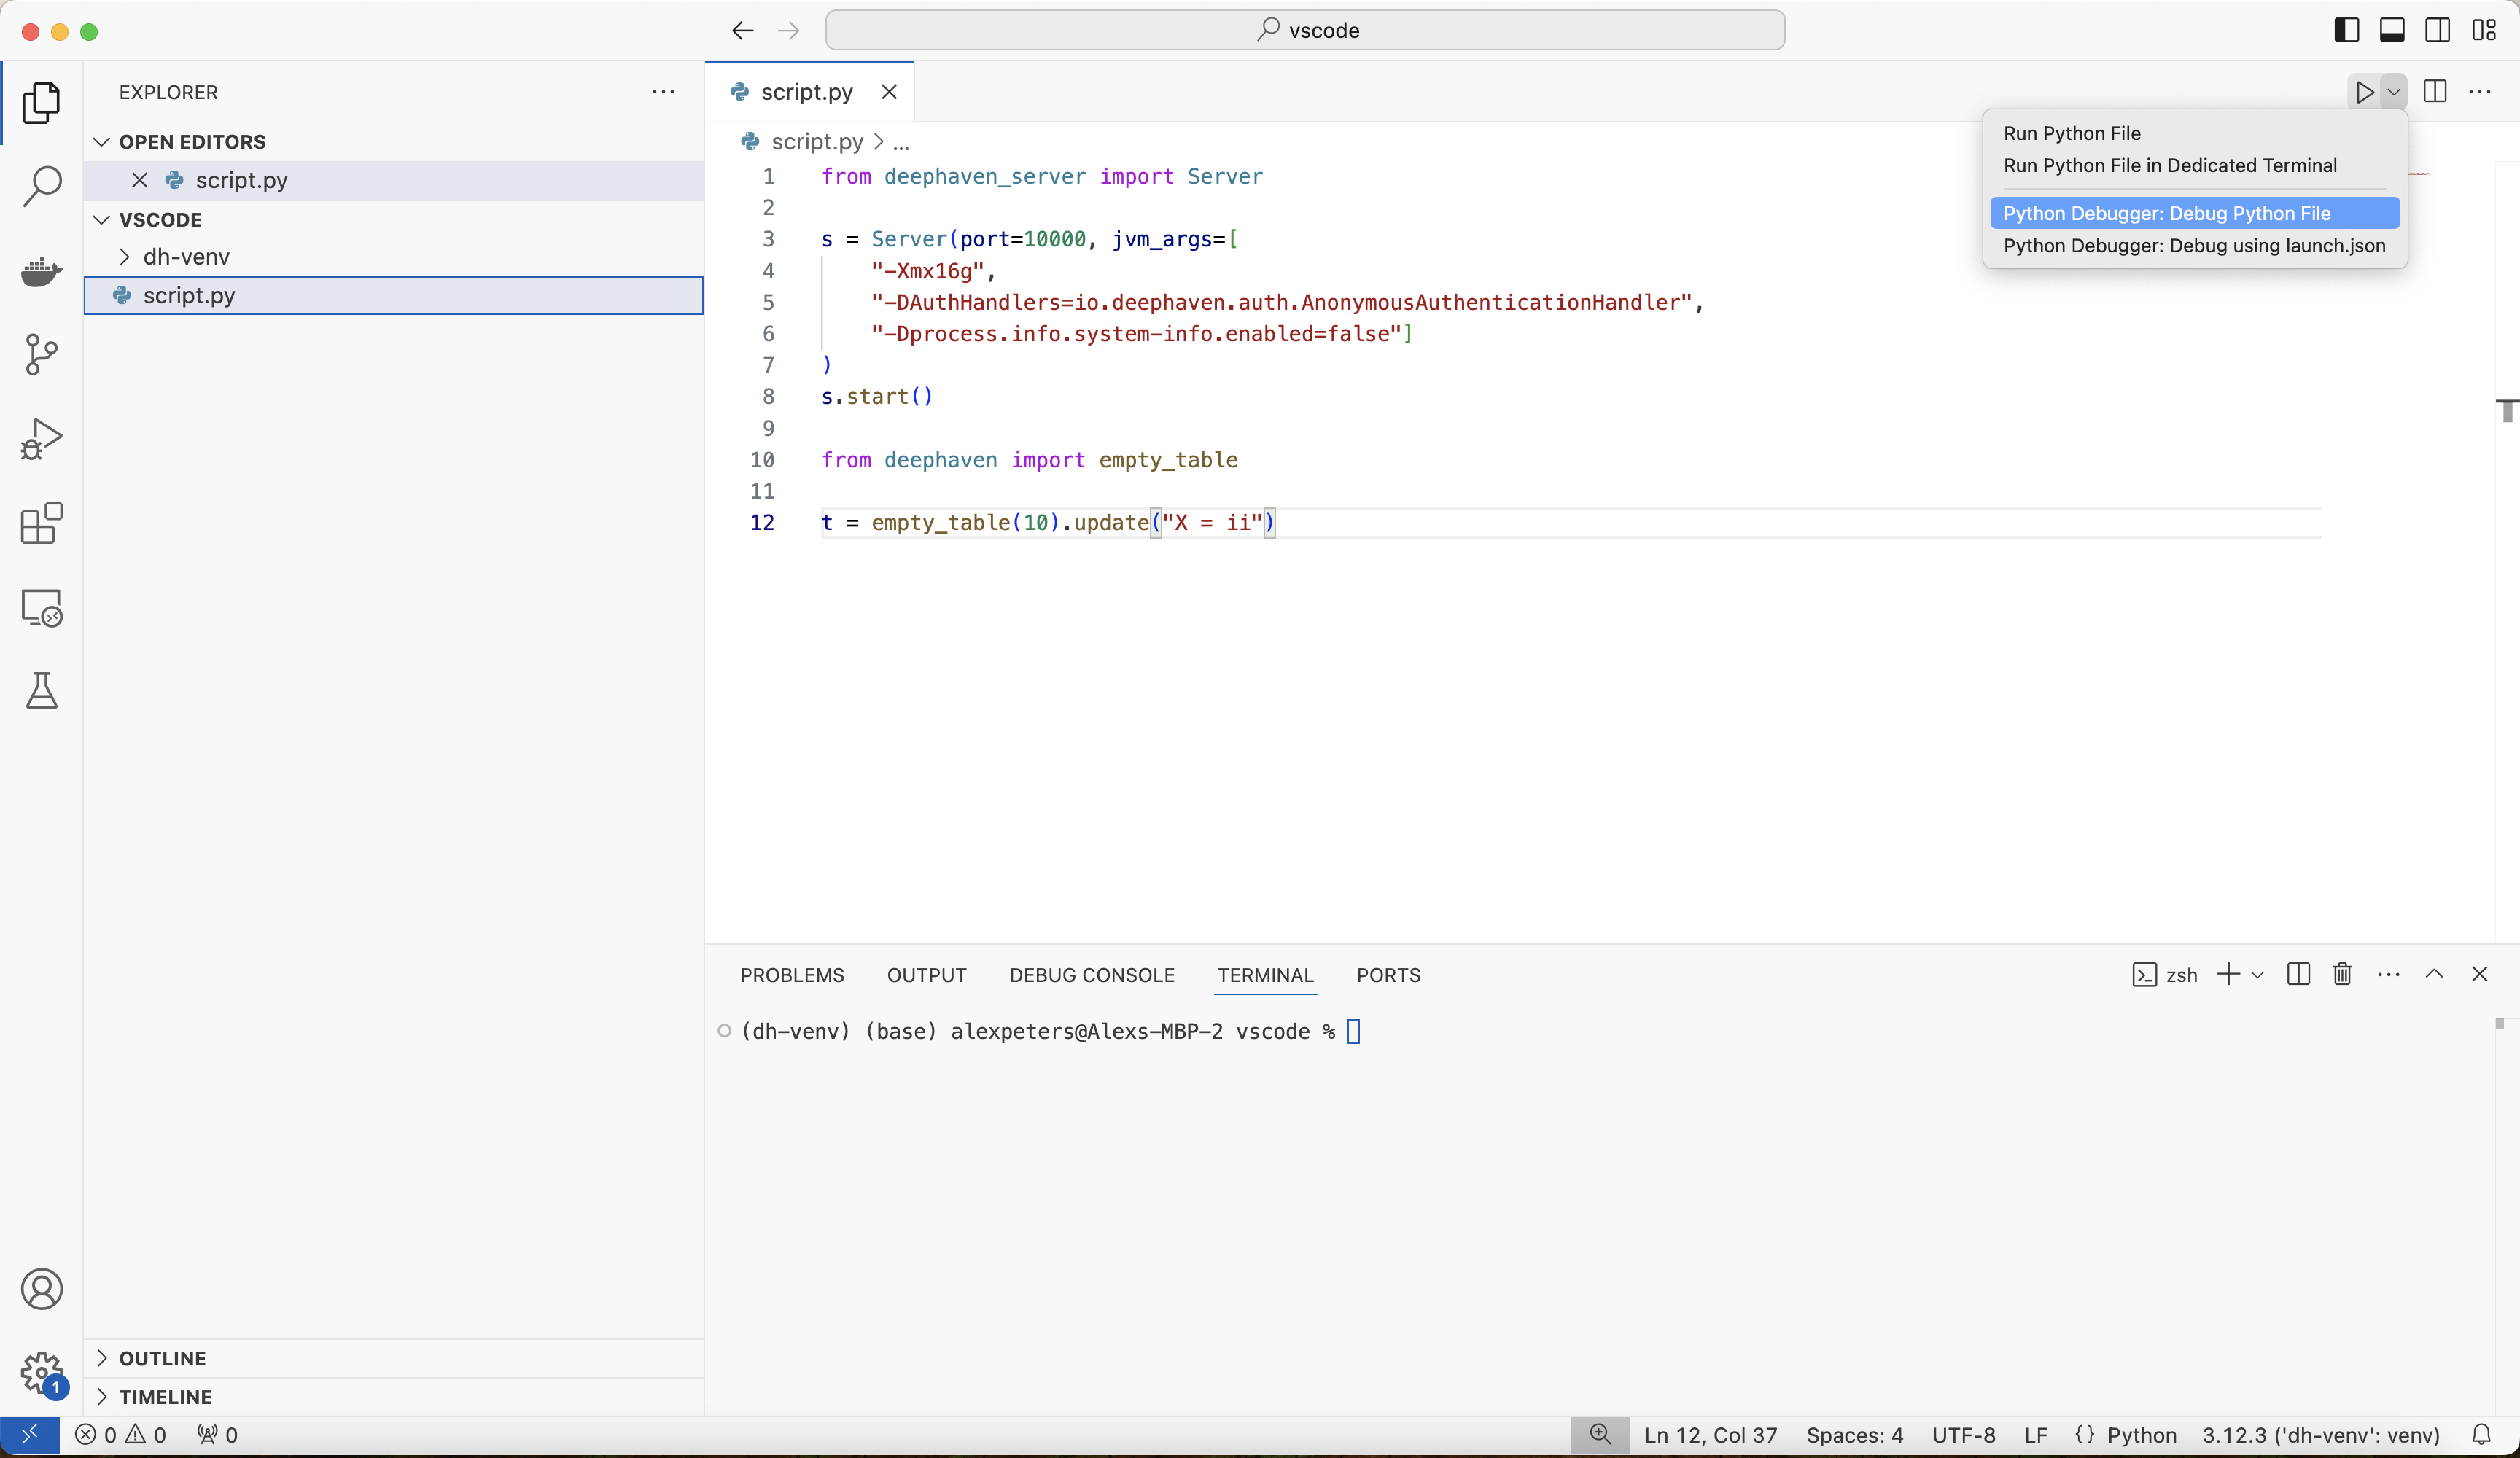
This runs the test script in the debugger for this environment. If the test is successful, the debugger starts the Deephaven server, runs the script, and exits:
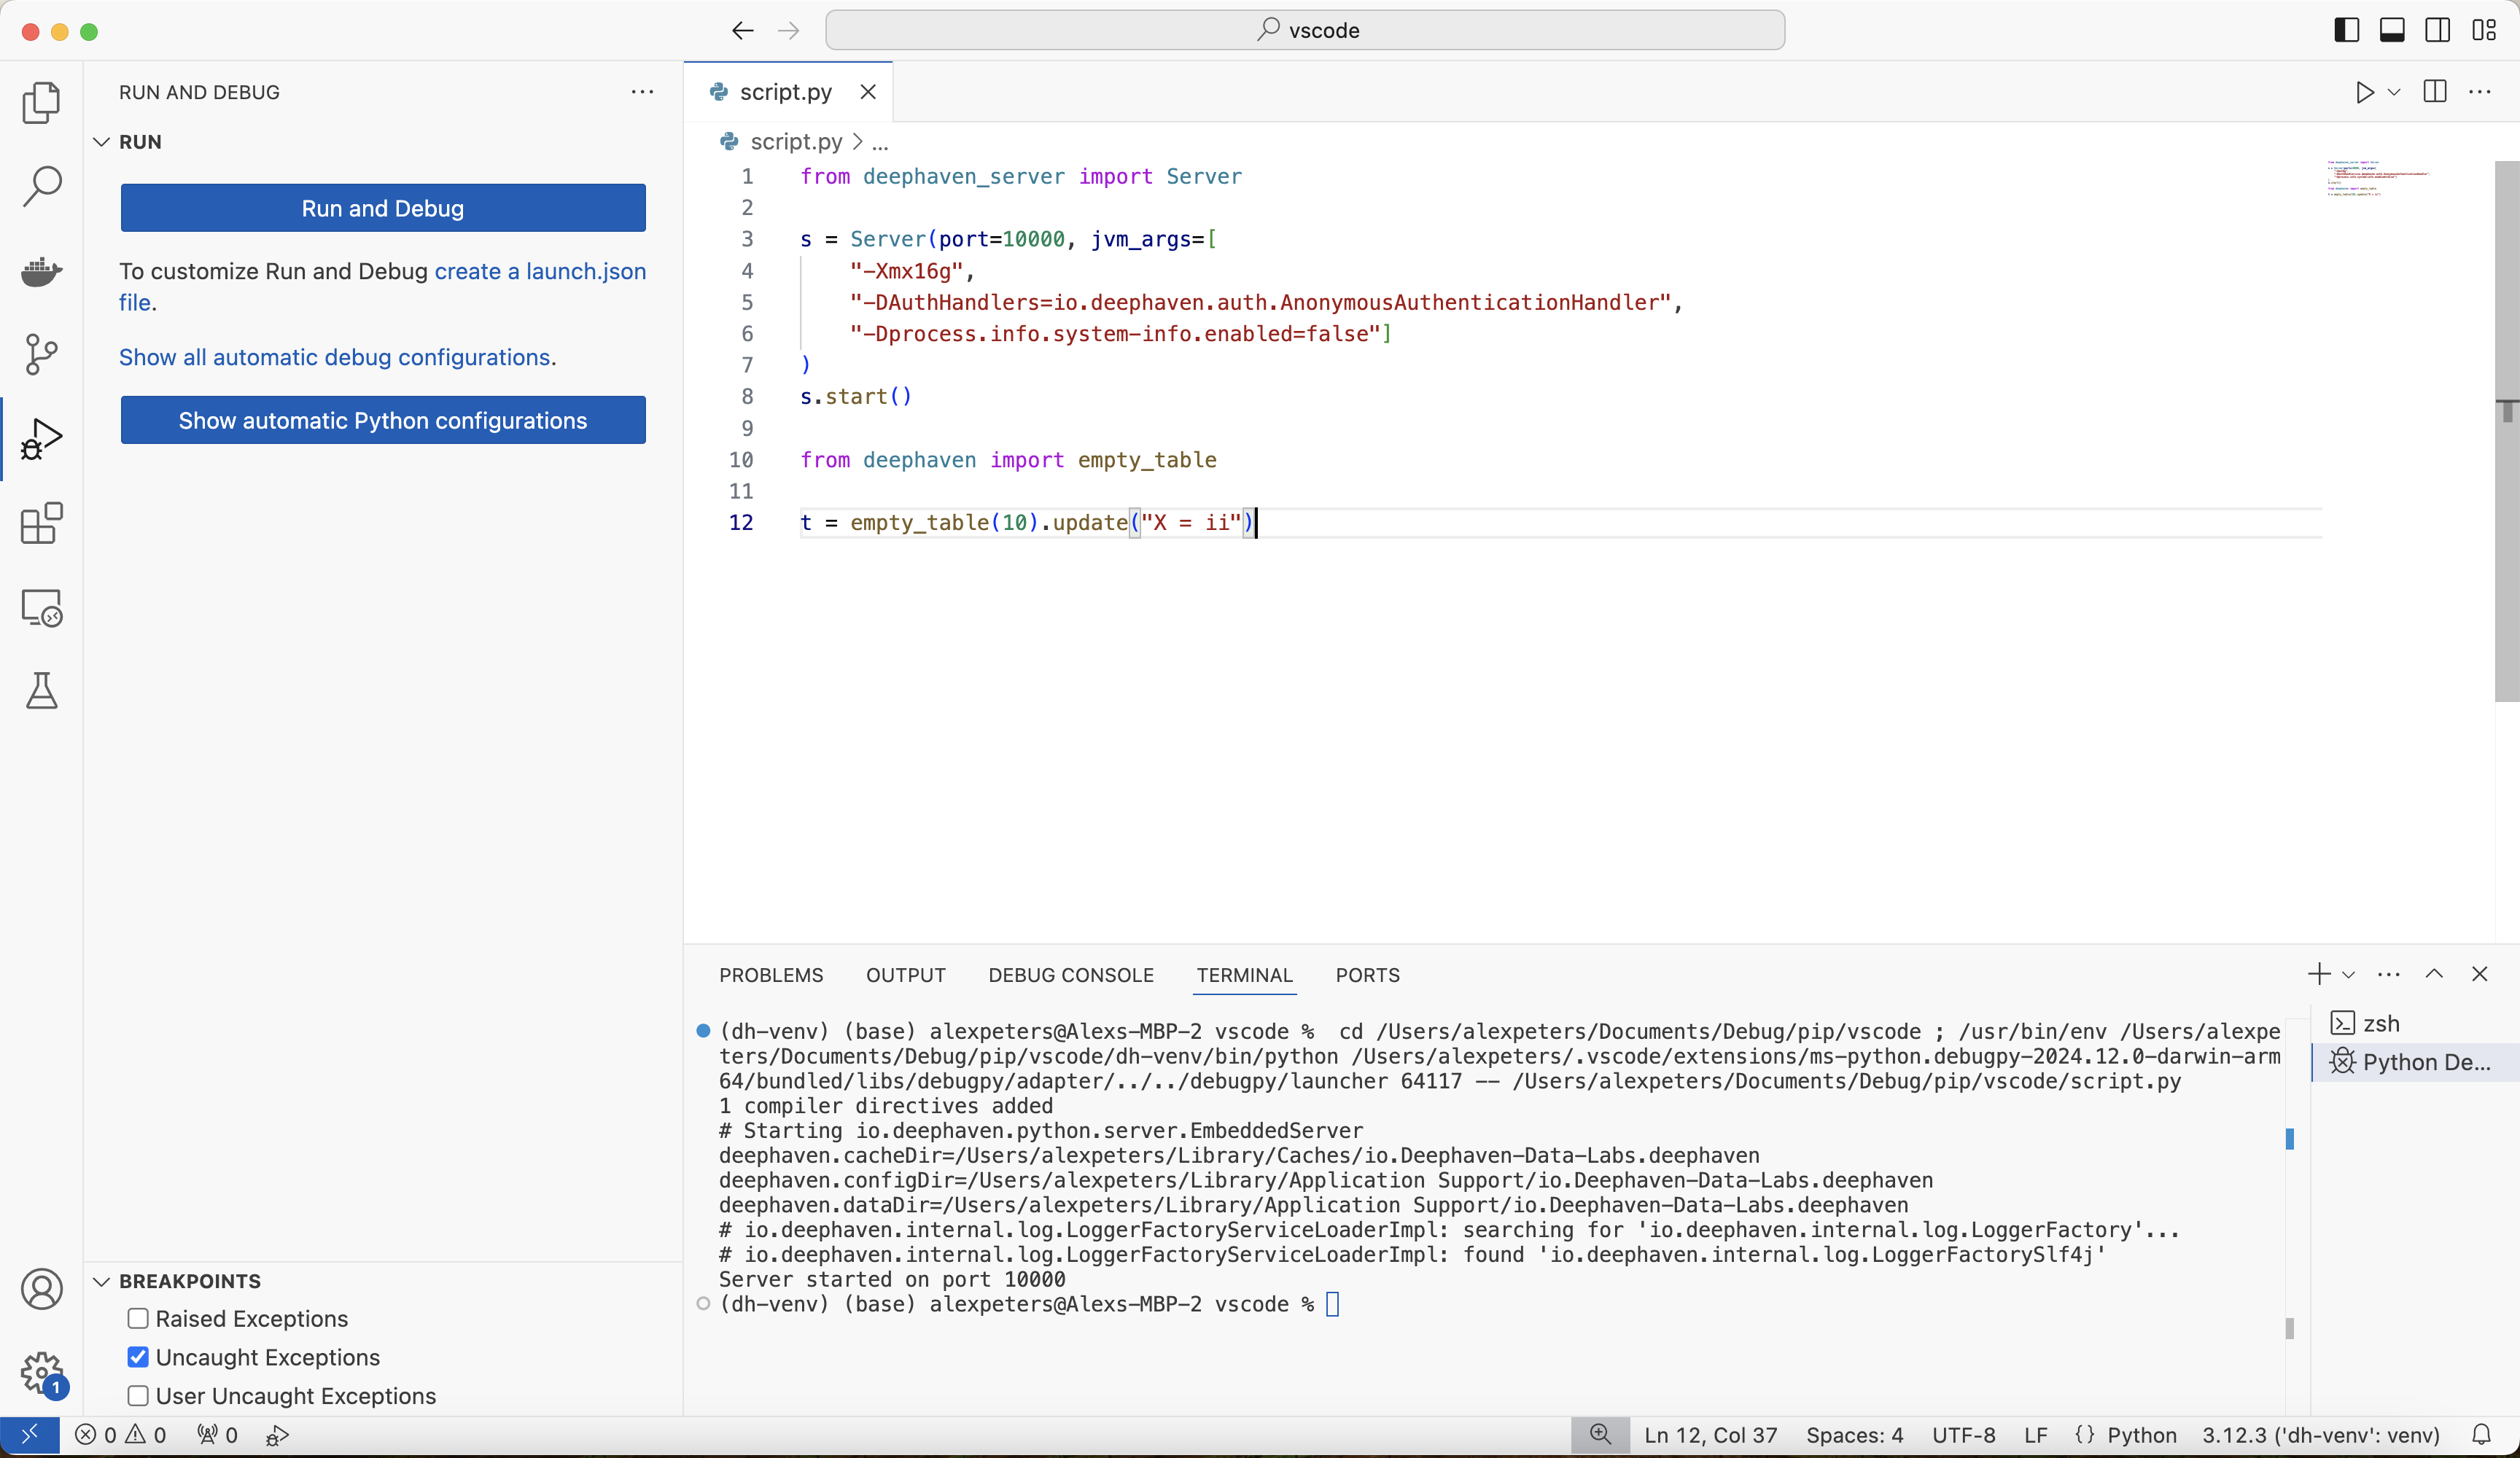
The debugger is then ready for use. If the test fails, check for these causes:
- The Python interpreter isn't set to
dh-venv. Repeat step 1. - The Deephaven Python package isn't installed in
dh-venv. Runpip install deephaven-server. - Java 17 or later isn't installed, or
JAVA_HOMEisn't set. See the prerequisites.
3. Use the debugger with Deephaven
Once the debugger is set up and working, all of the features in VS Code's debugger are available. Set breakpoints, step through functions, and inspect source code:
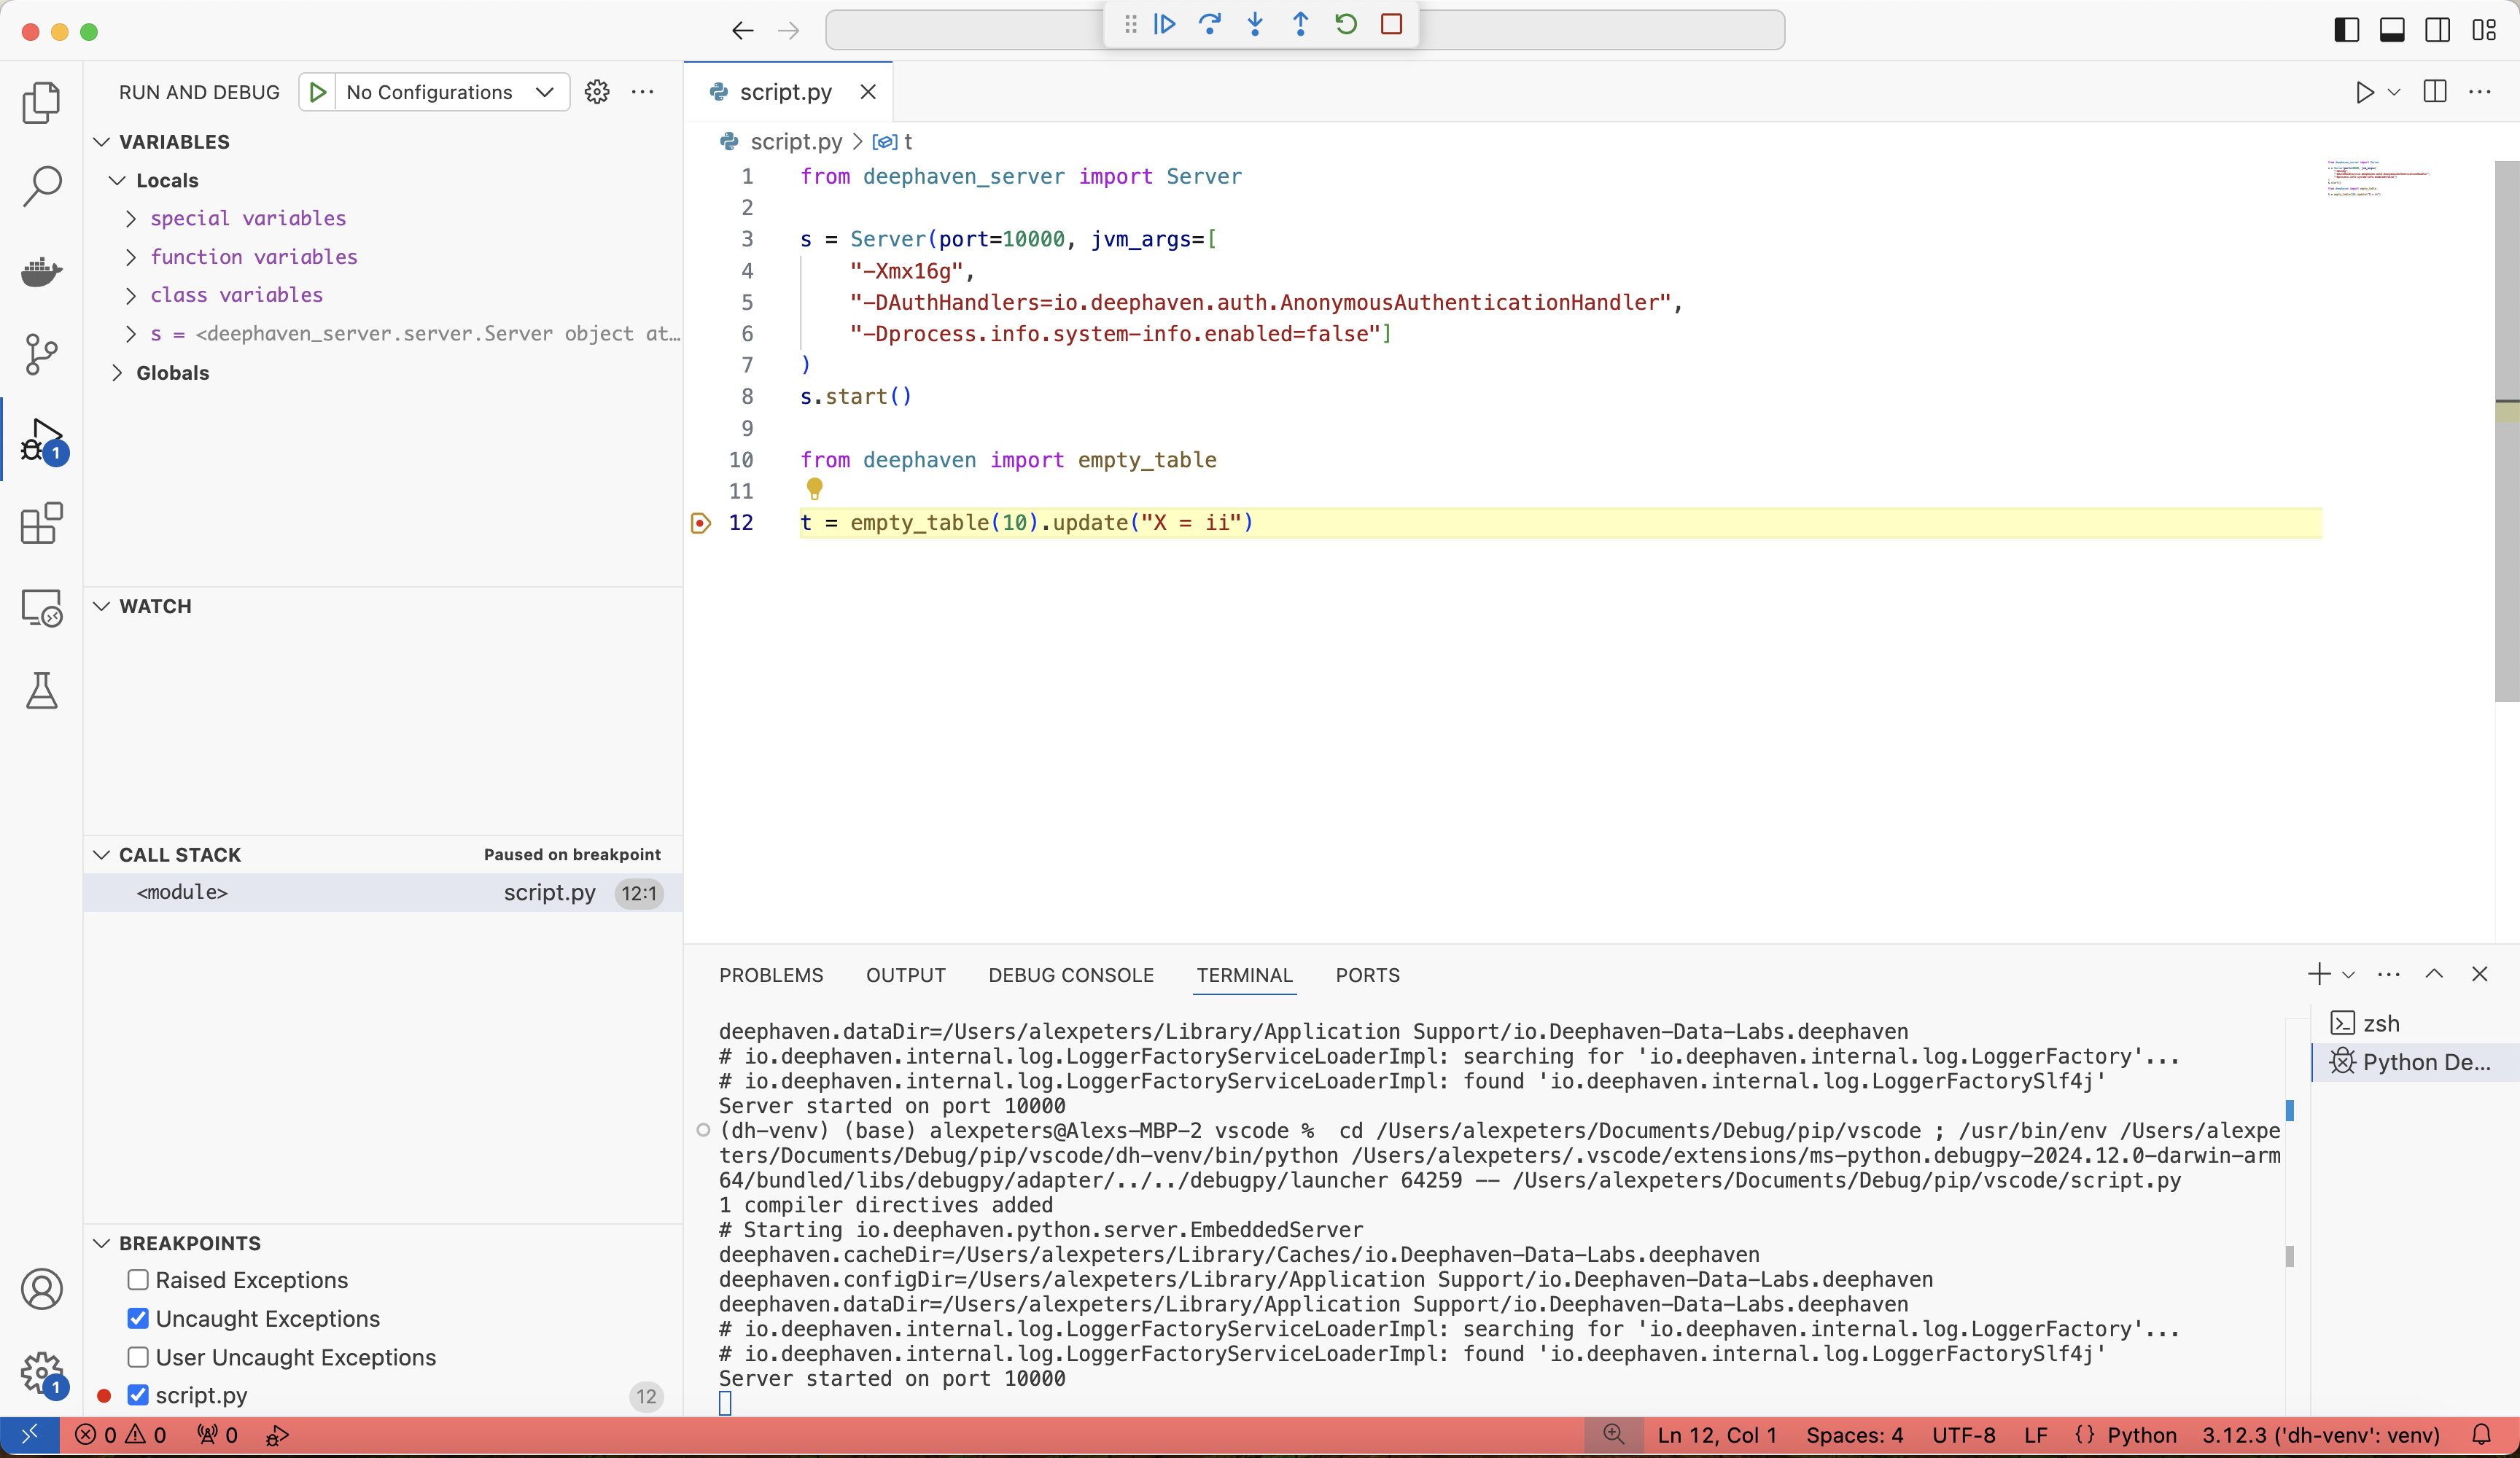
Deephaven has some debugging pitfalls of its own, such as lazy evaluation and ticking tables when your script starts the server. See Common problems when debugging Deephaven.
Remote debugging with PyCharm Pro
The Deephaven web IDE has no built-in debugger. However, you can debug code that runs in the Deephaven console with the remote debug server in PyCharm Pro. PyCharm Pro is the paid tier of PyCharm. Before version 2025.1, it was called PyCharm Professional. This approach is more complex than local debugging, but it's useful when you work mainly in the Deephaven web IDE.
Warning
Use PyCharm 2024 or later. Debugging Deephaven with PyCharm 2023 has known problems.
1. Install pydevd
First, install pydevd into the dh-venv virtual environment. pydevd is the Python debugger library that PyCharm's debugger is built on. The Deephaven server's Python process uses it to connect to PyCharm's debug server.
Verify that this package is installed and available by importing it:
The import may print a warning like the following, which doesn't stop debugging:
2. Create and configure a PyCharm project
Create and configure a PyCharm project that uses the dh-venv interpreter, as described in Create and configure a PyCharm project. If you already did this, skip to step 3.
3. Create a debug server
Next, create a remote debug server from PyCharm.
Go to Run > Edit Configurations, which opens the Run/Debug Configurations window. Click on + in the top-left corner to add a new configuration. This brings up a list of configuration types to select. Scroll down and select the Python Debug Server configuration option:
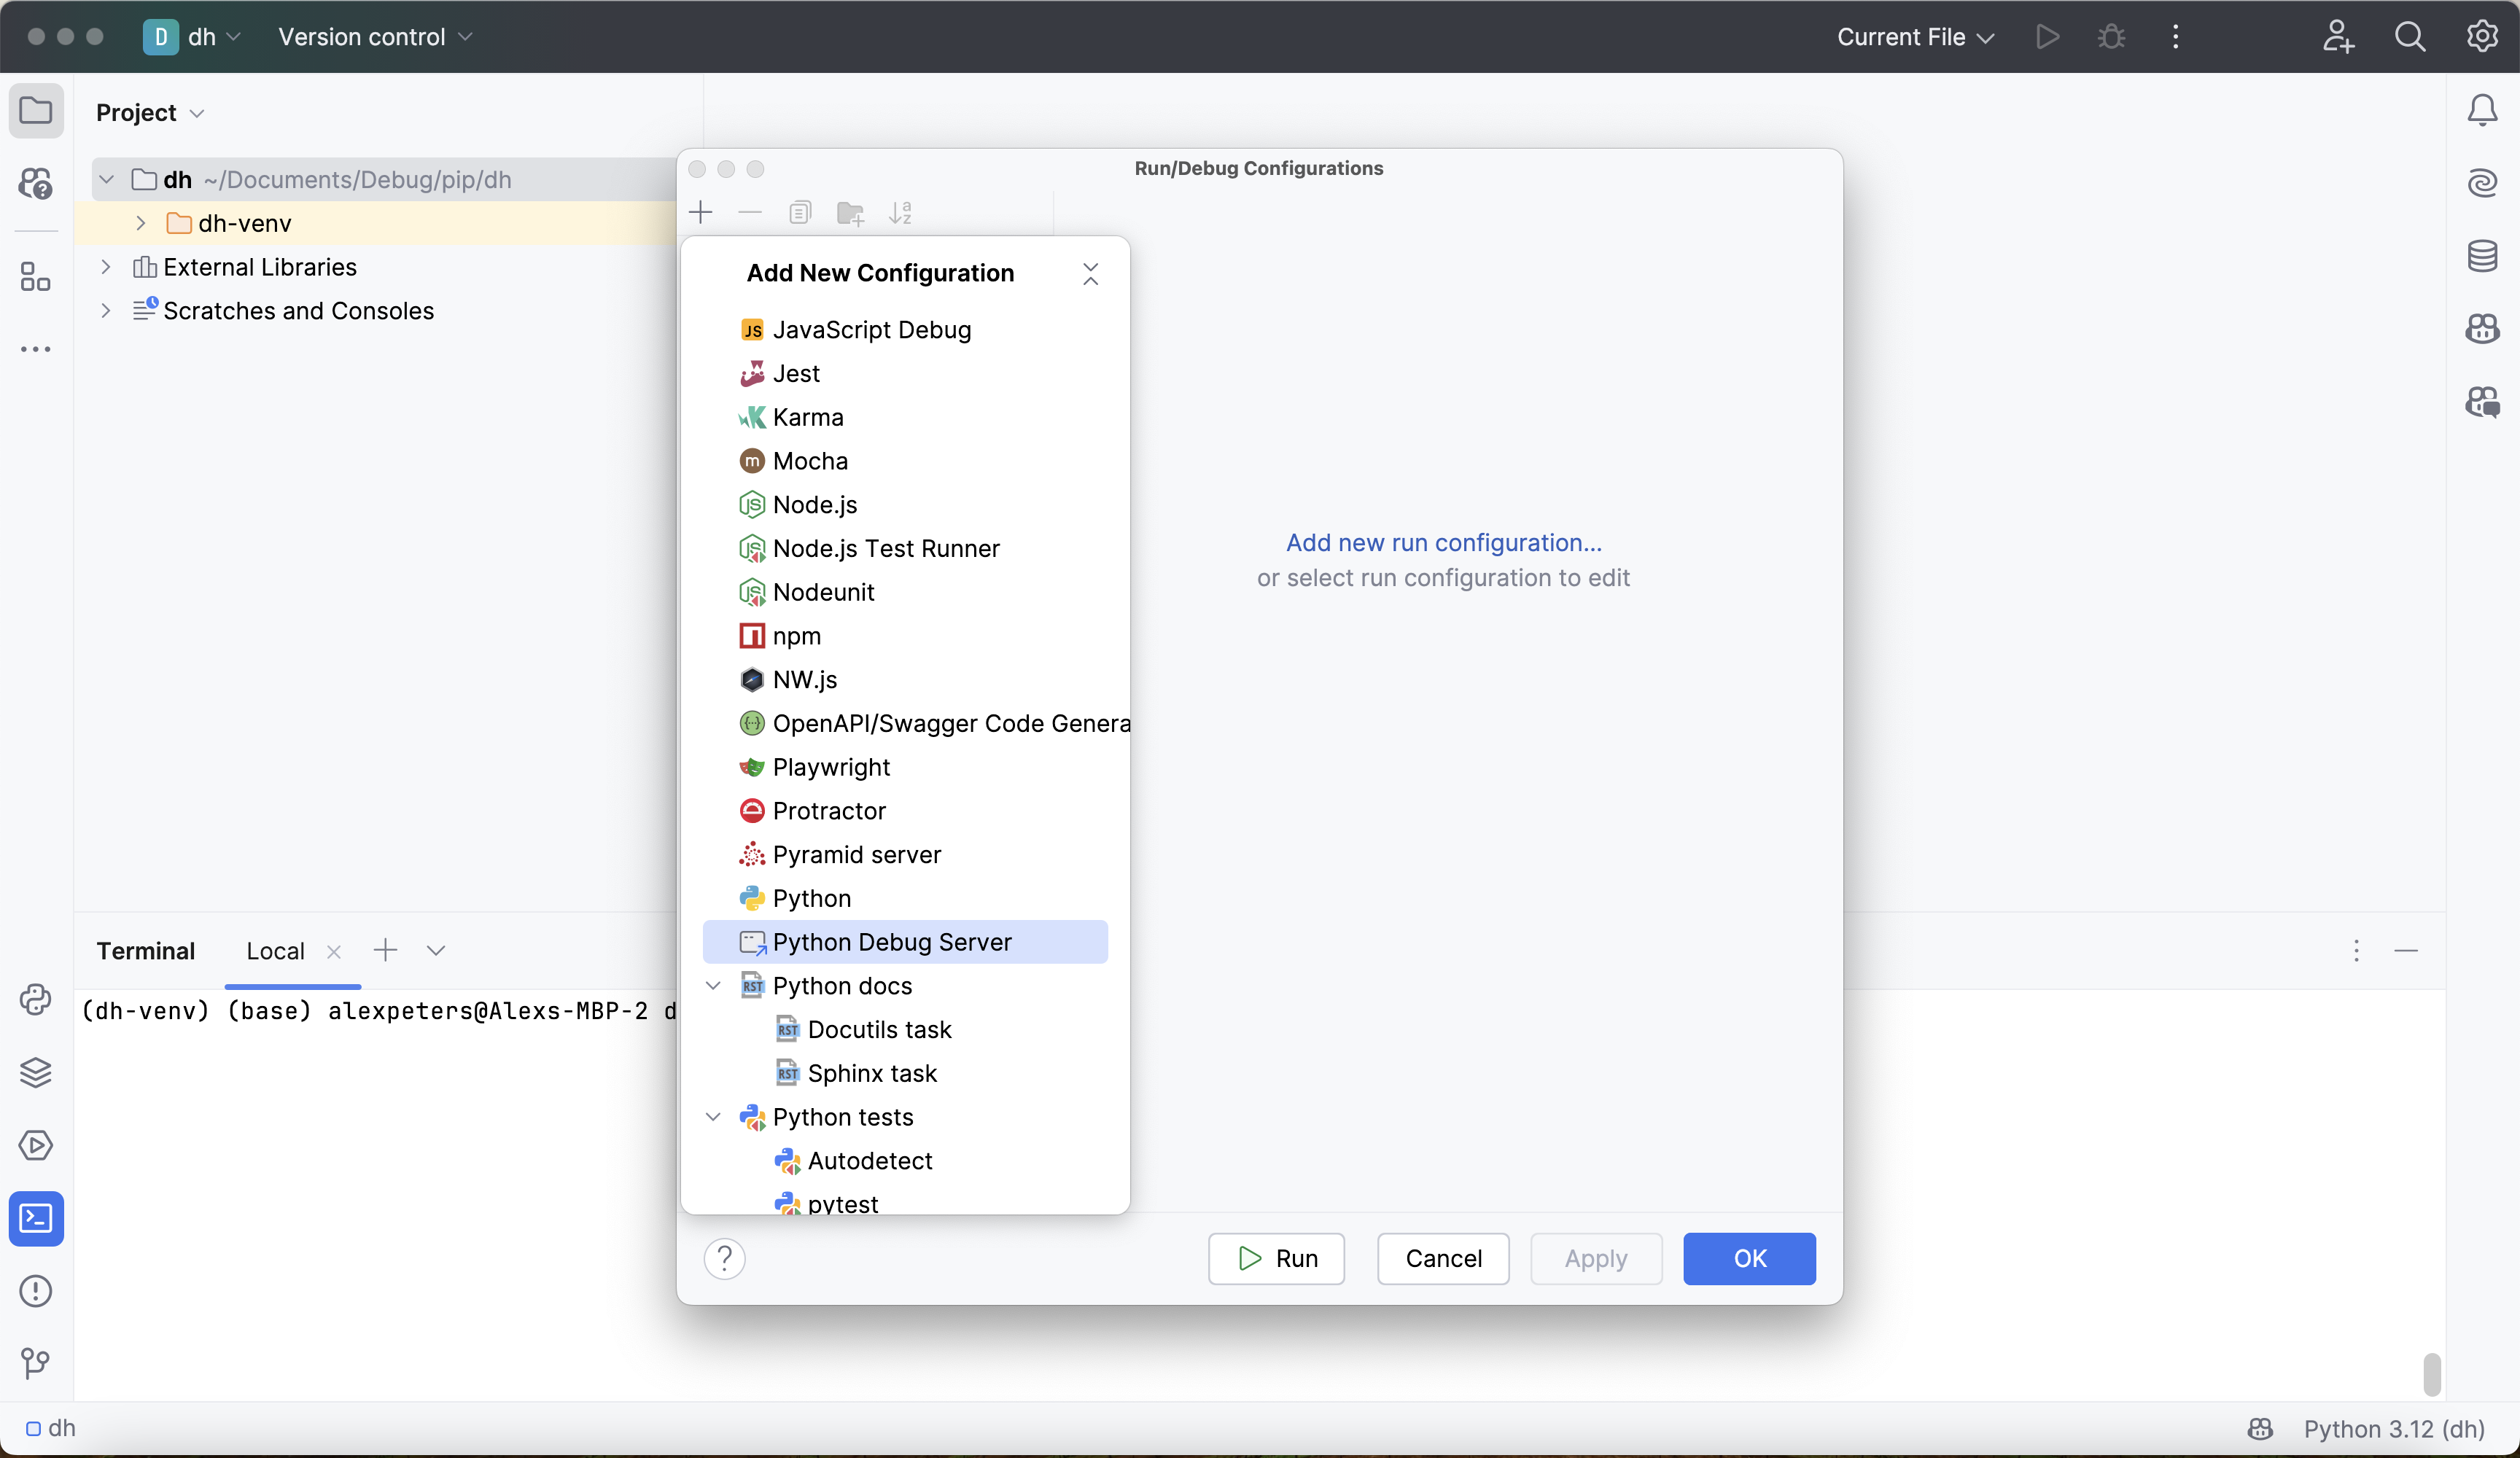
Give the configuration a reasonable, memorable name. The virtual environment is named dh-venv, so this guide names the configuration dh-venv-debugging-server.
Next, set the IDE host name. The pip-installed Deephaven server runs locally, so use one of these host names:
- macOS and Linux:
localhost. - Windows with WSL 2 mirrored networking mode:
localhost. - Windows without mirrored networking mode: the Windows host's IP address. Use it here and in the
settracecall in step 4.
Finally, choose a port for the debug server to run on. Note that this is not the same as the port that the Deephaven server runs on, which is port 10000 by default. Any unused port works. This guide uses port 4444.
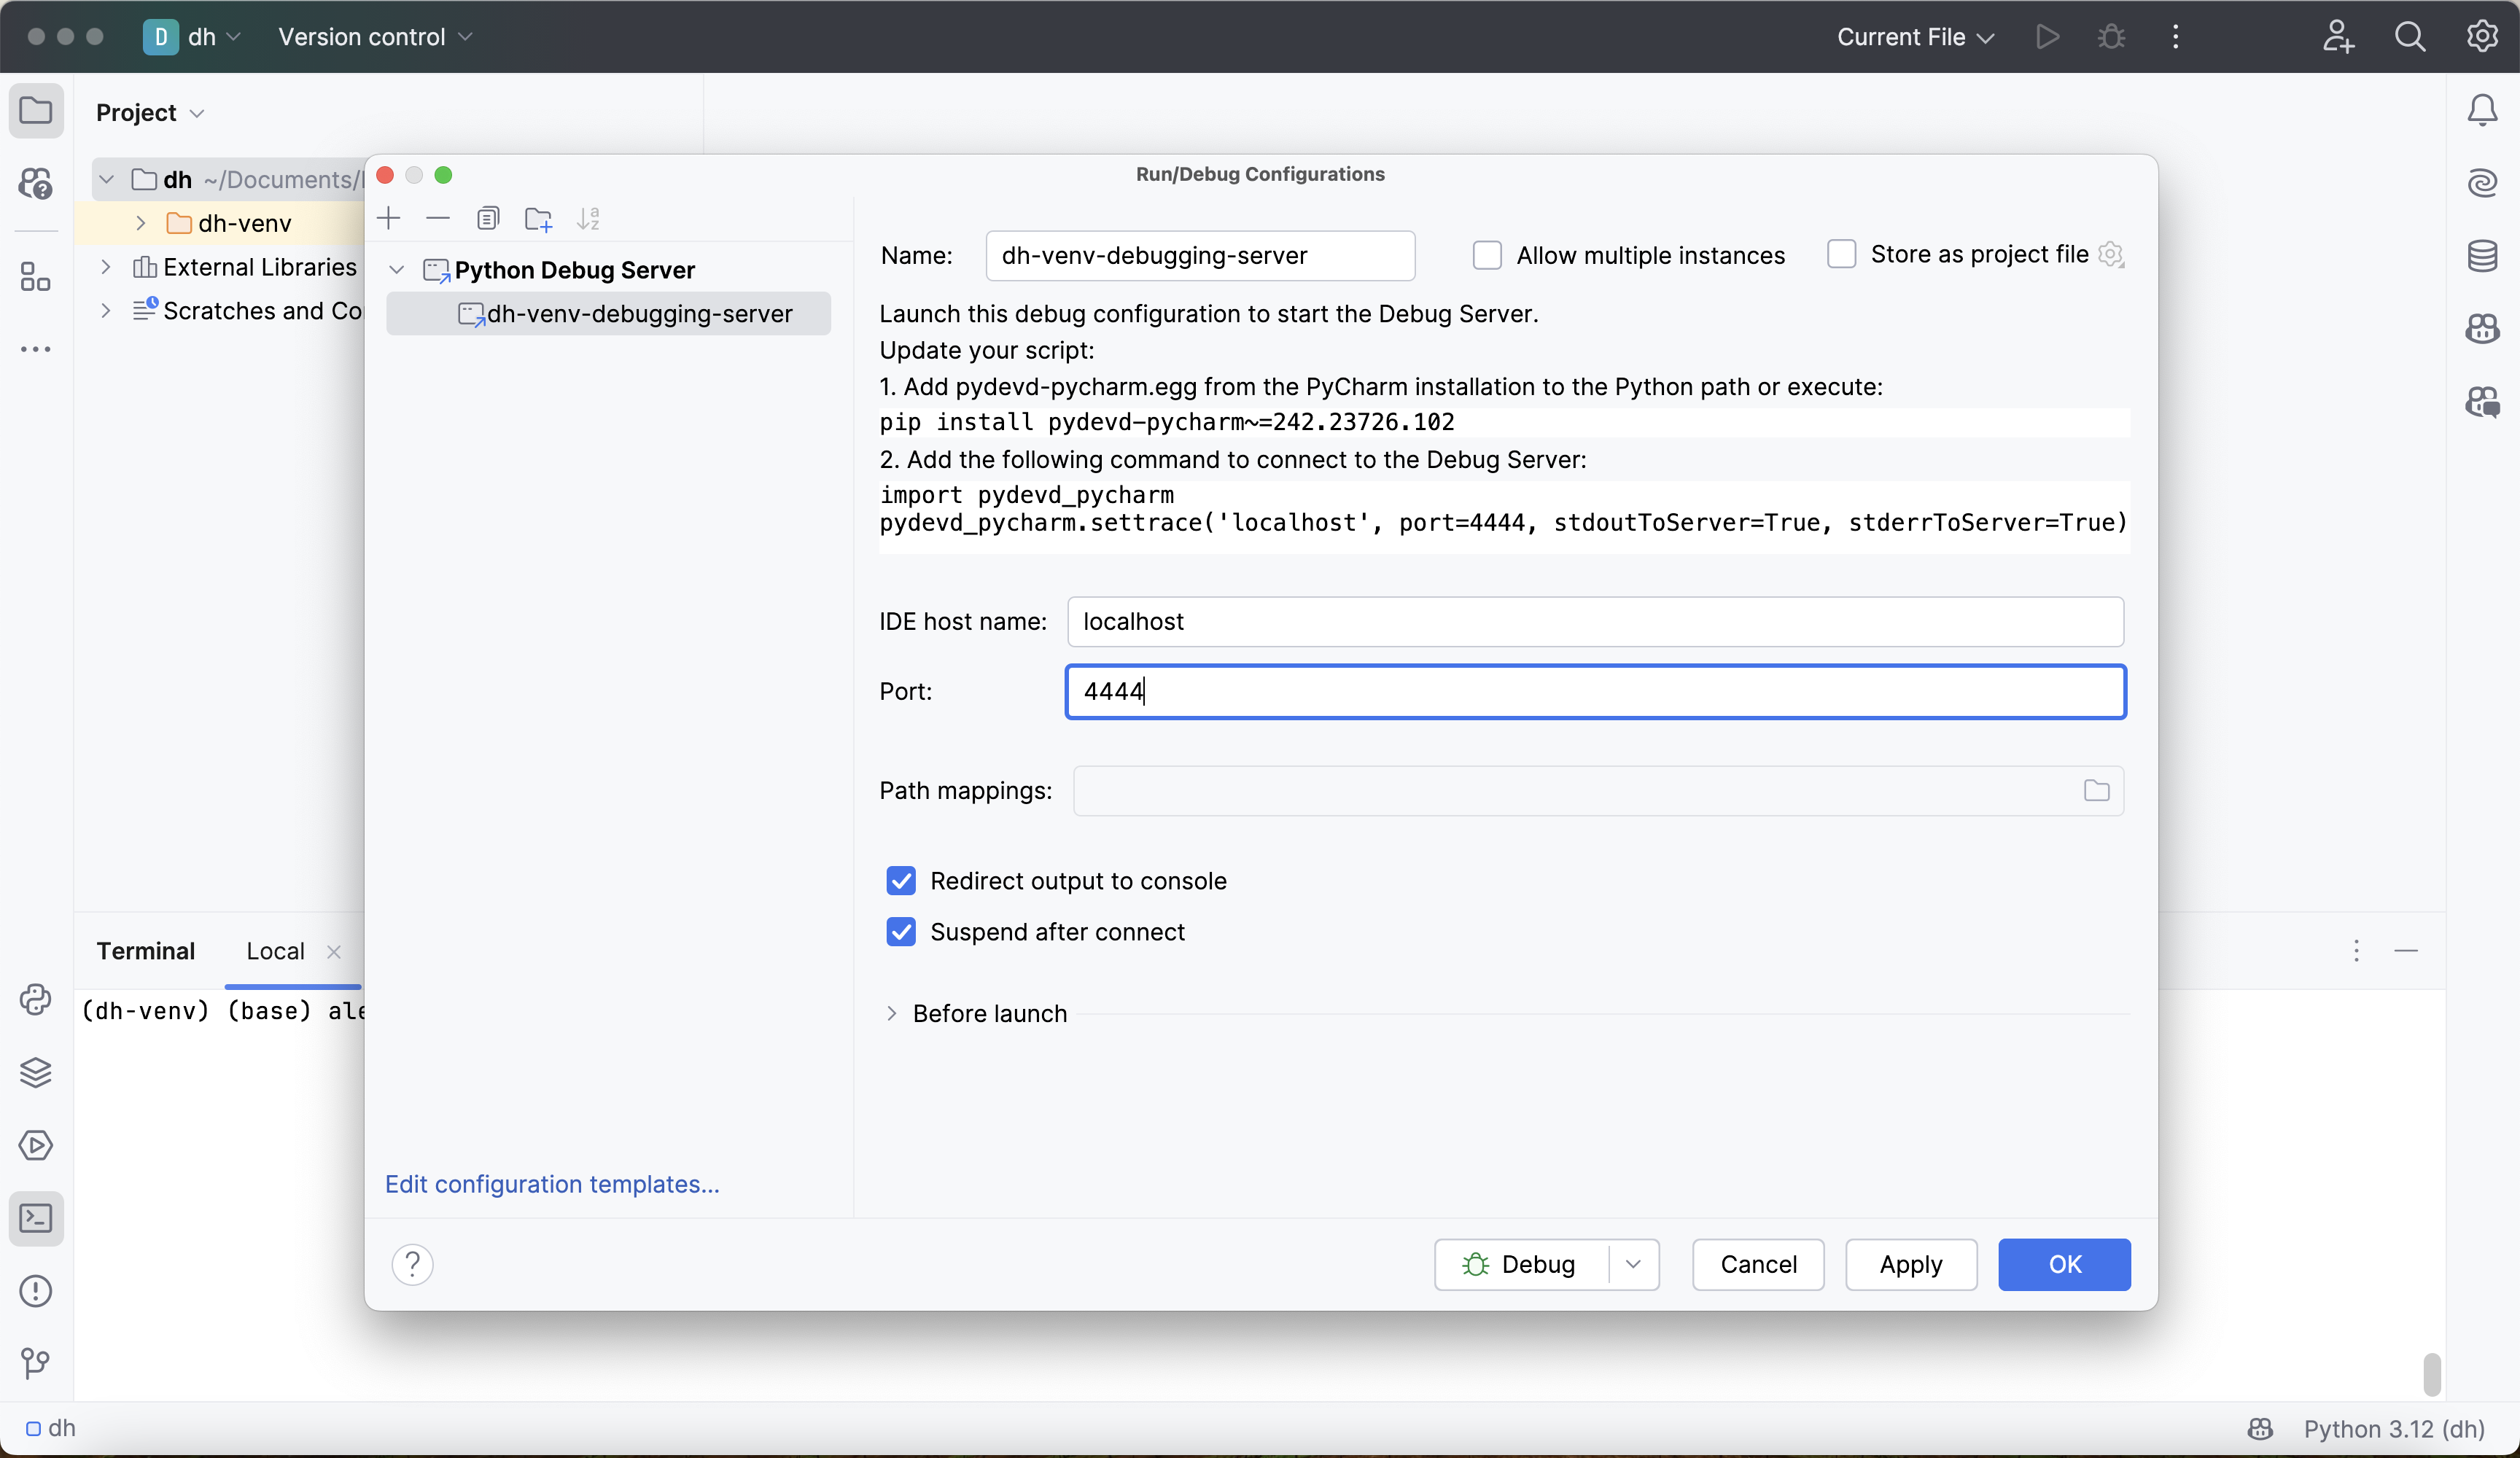
The Python Debug Server configuration window also shows a pydevd-pycharm version that matches your PyCharm build. Note that version. If settrace fails to connect in step 4, install that package in place of pydevd, as described in Version compatibility issues.
Click Apply and OK. The new debug server configuration is ready to use.
4. Attach the debugger to Deephaven
Select the dh-venv-debugging-server configuration in the run configuration menu at the top right of the window, then click the small green bug icon next to it. This starts the debugger and opens a debug console:
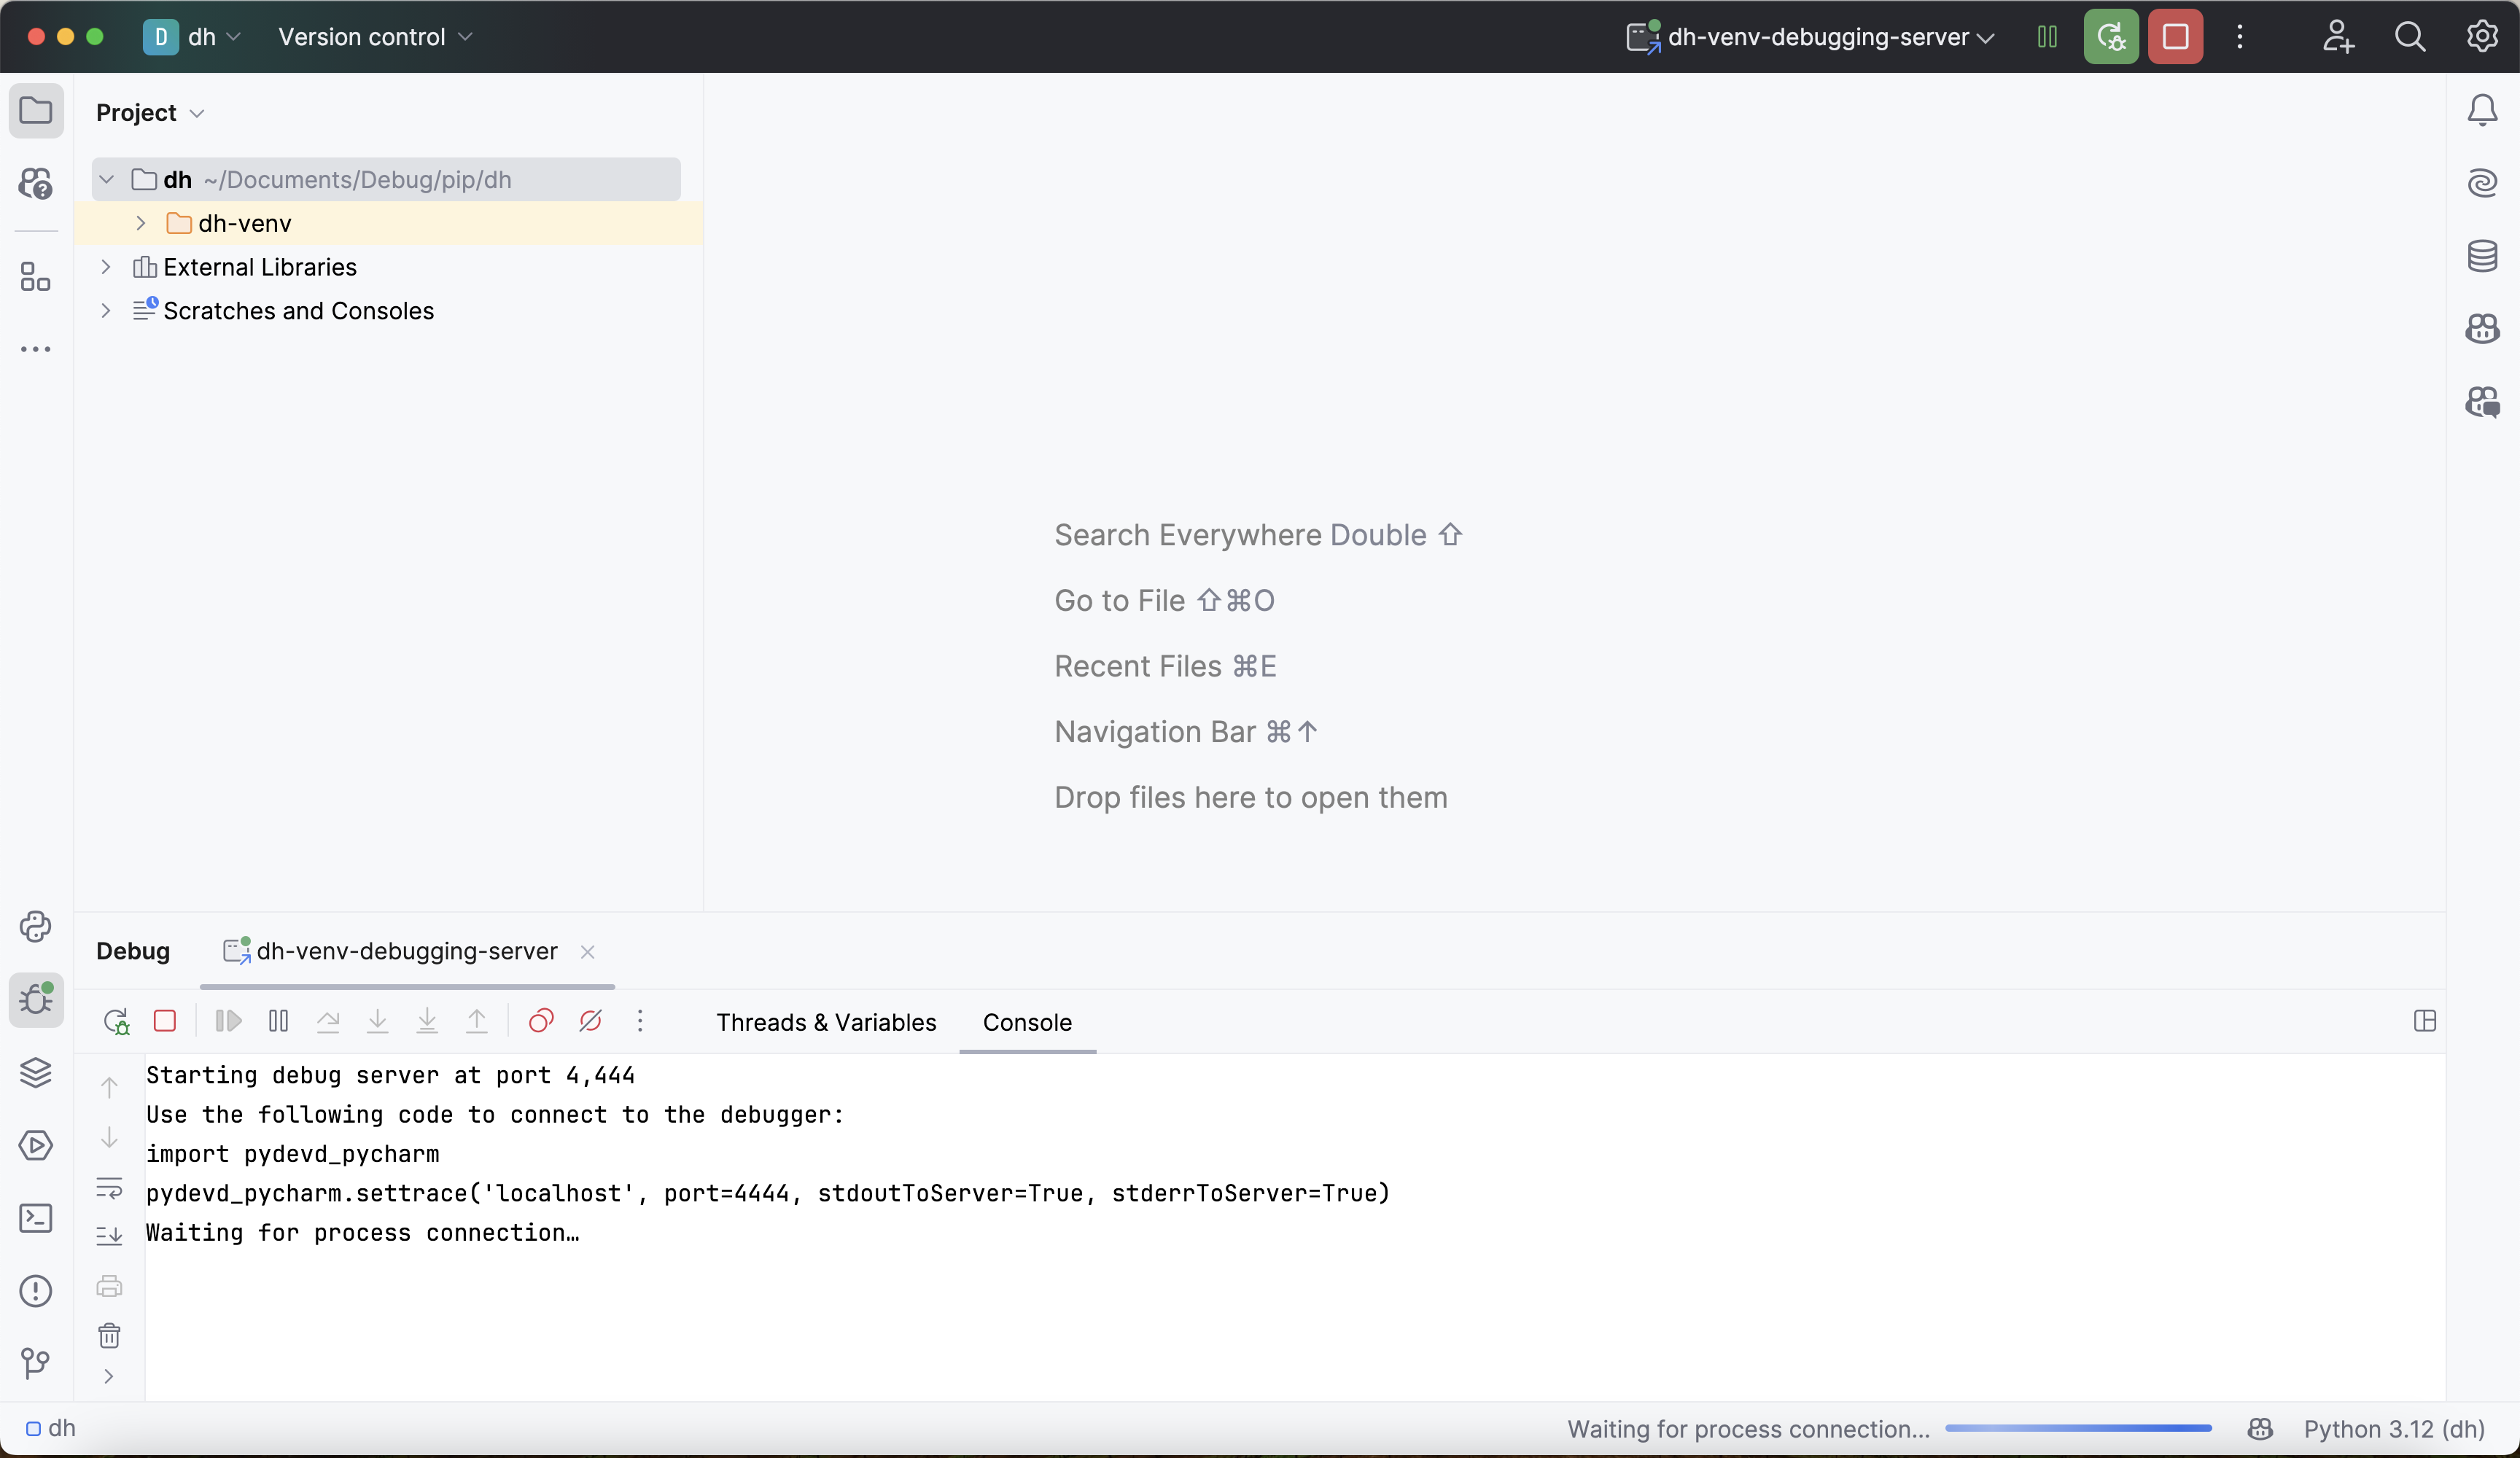
The output above states that the debugger is "waiting for process connection". This means that the debugger is not yet attached to the Deephaven process.
Now, start the Deephaven server from the dh-venv virtual environment where you installed pydevd. The easiest way to do this is to open a new terminal in the current PyCharm project and run the following command:
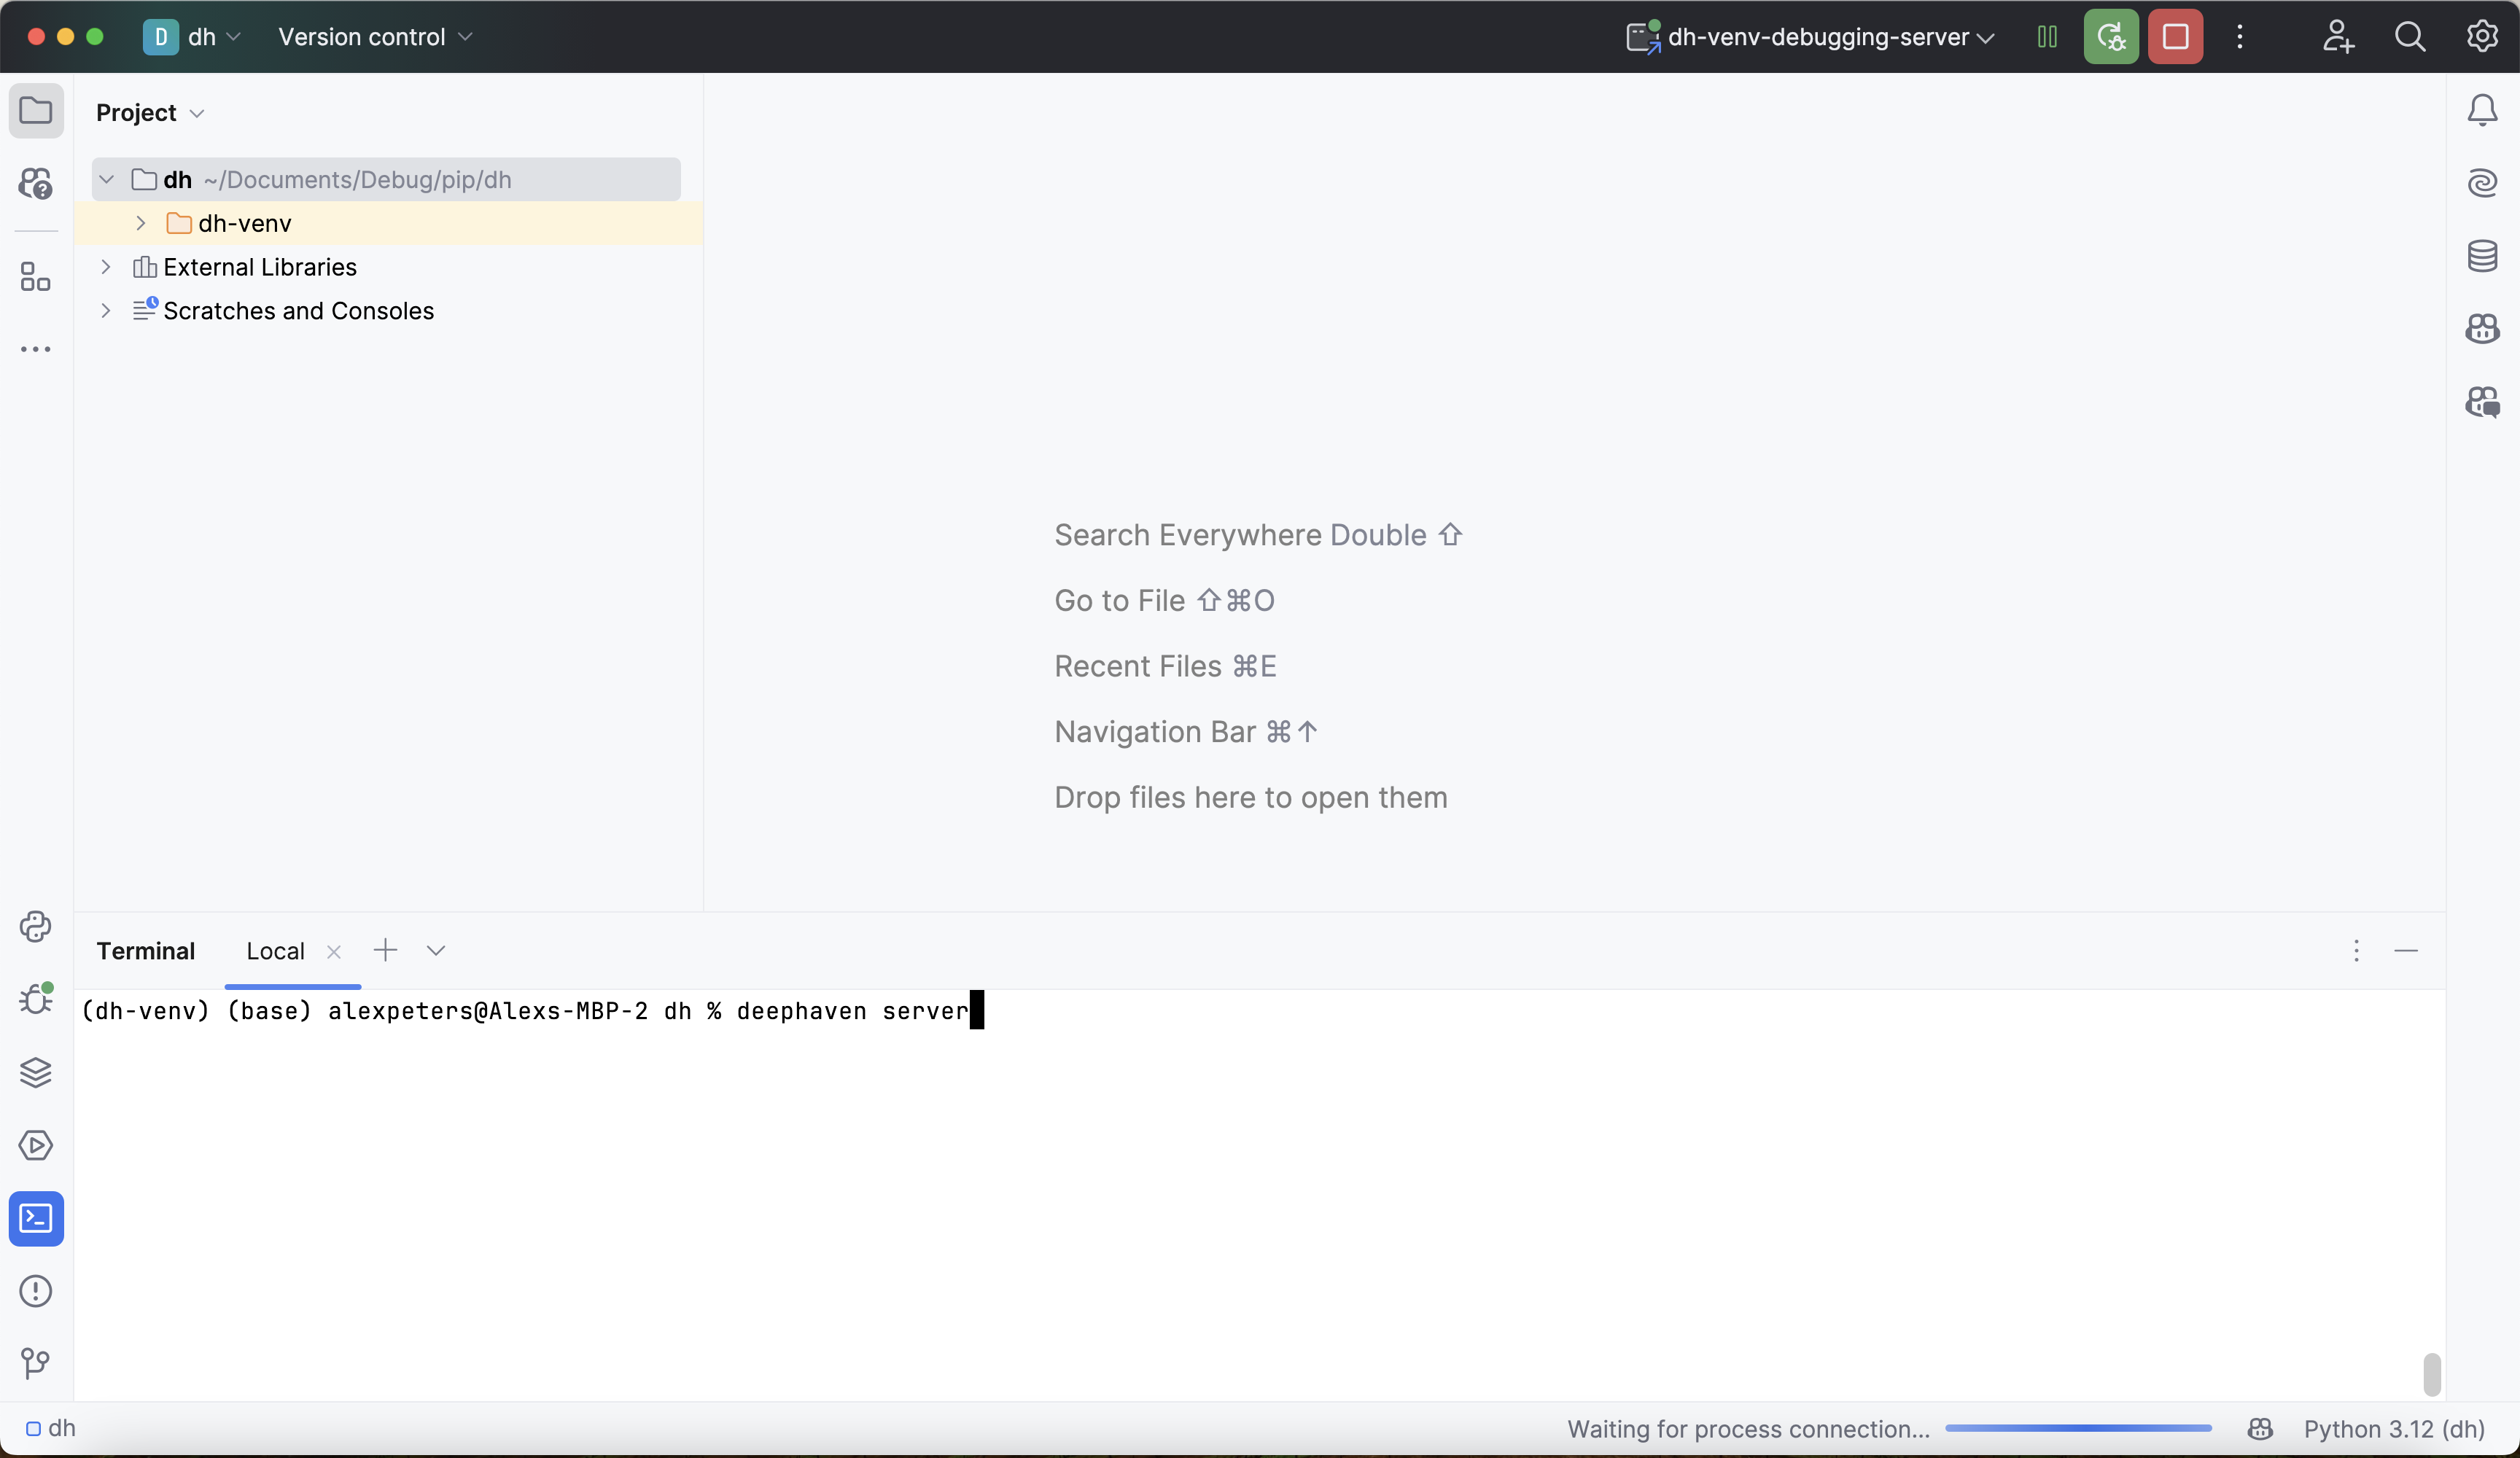
If you plan to set breakpoints in your own modules in step 5, run PYTHONPATH=$PWD deephaven server from your project directory instead. That lets the console import those modules.
The command opens the Deephaven web IDE in your browser and prints its URL, which includes the pre-shared key that logs you in. The debugger connection doesn't go through Deephaven's authentication, so you can keep the default pre-shared key authentication.
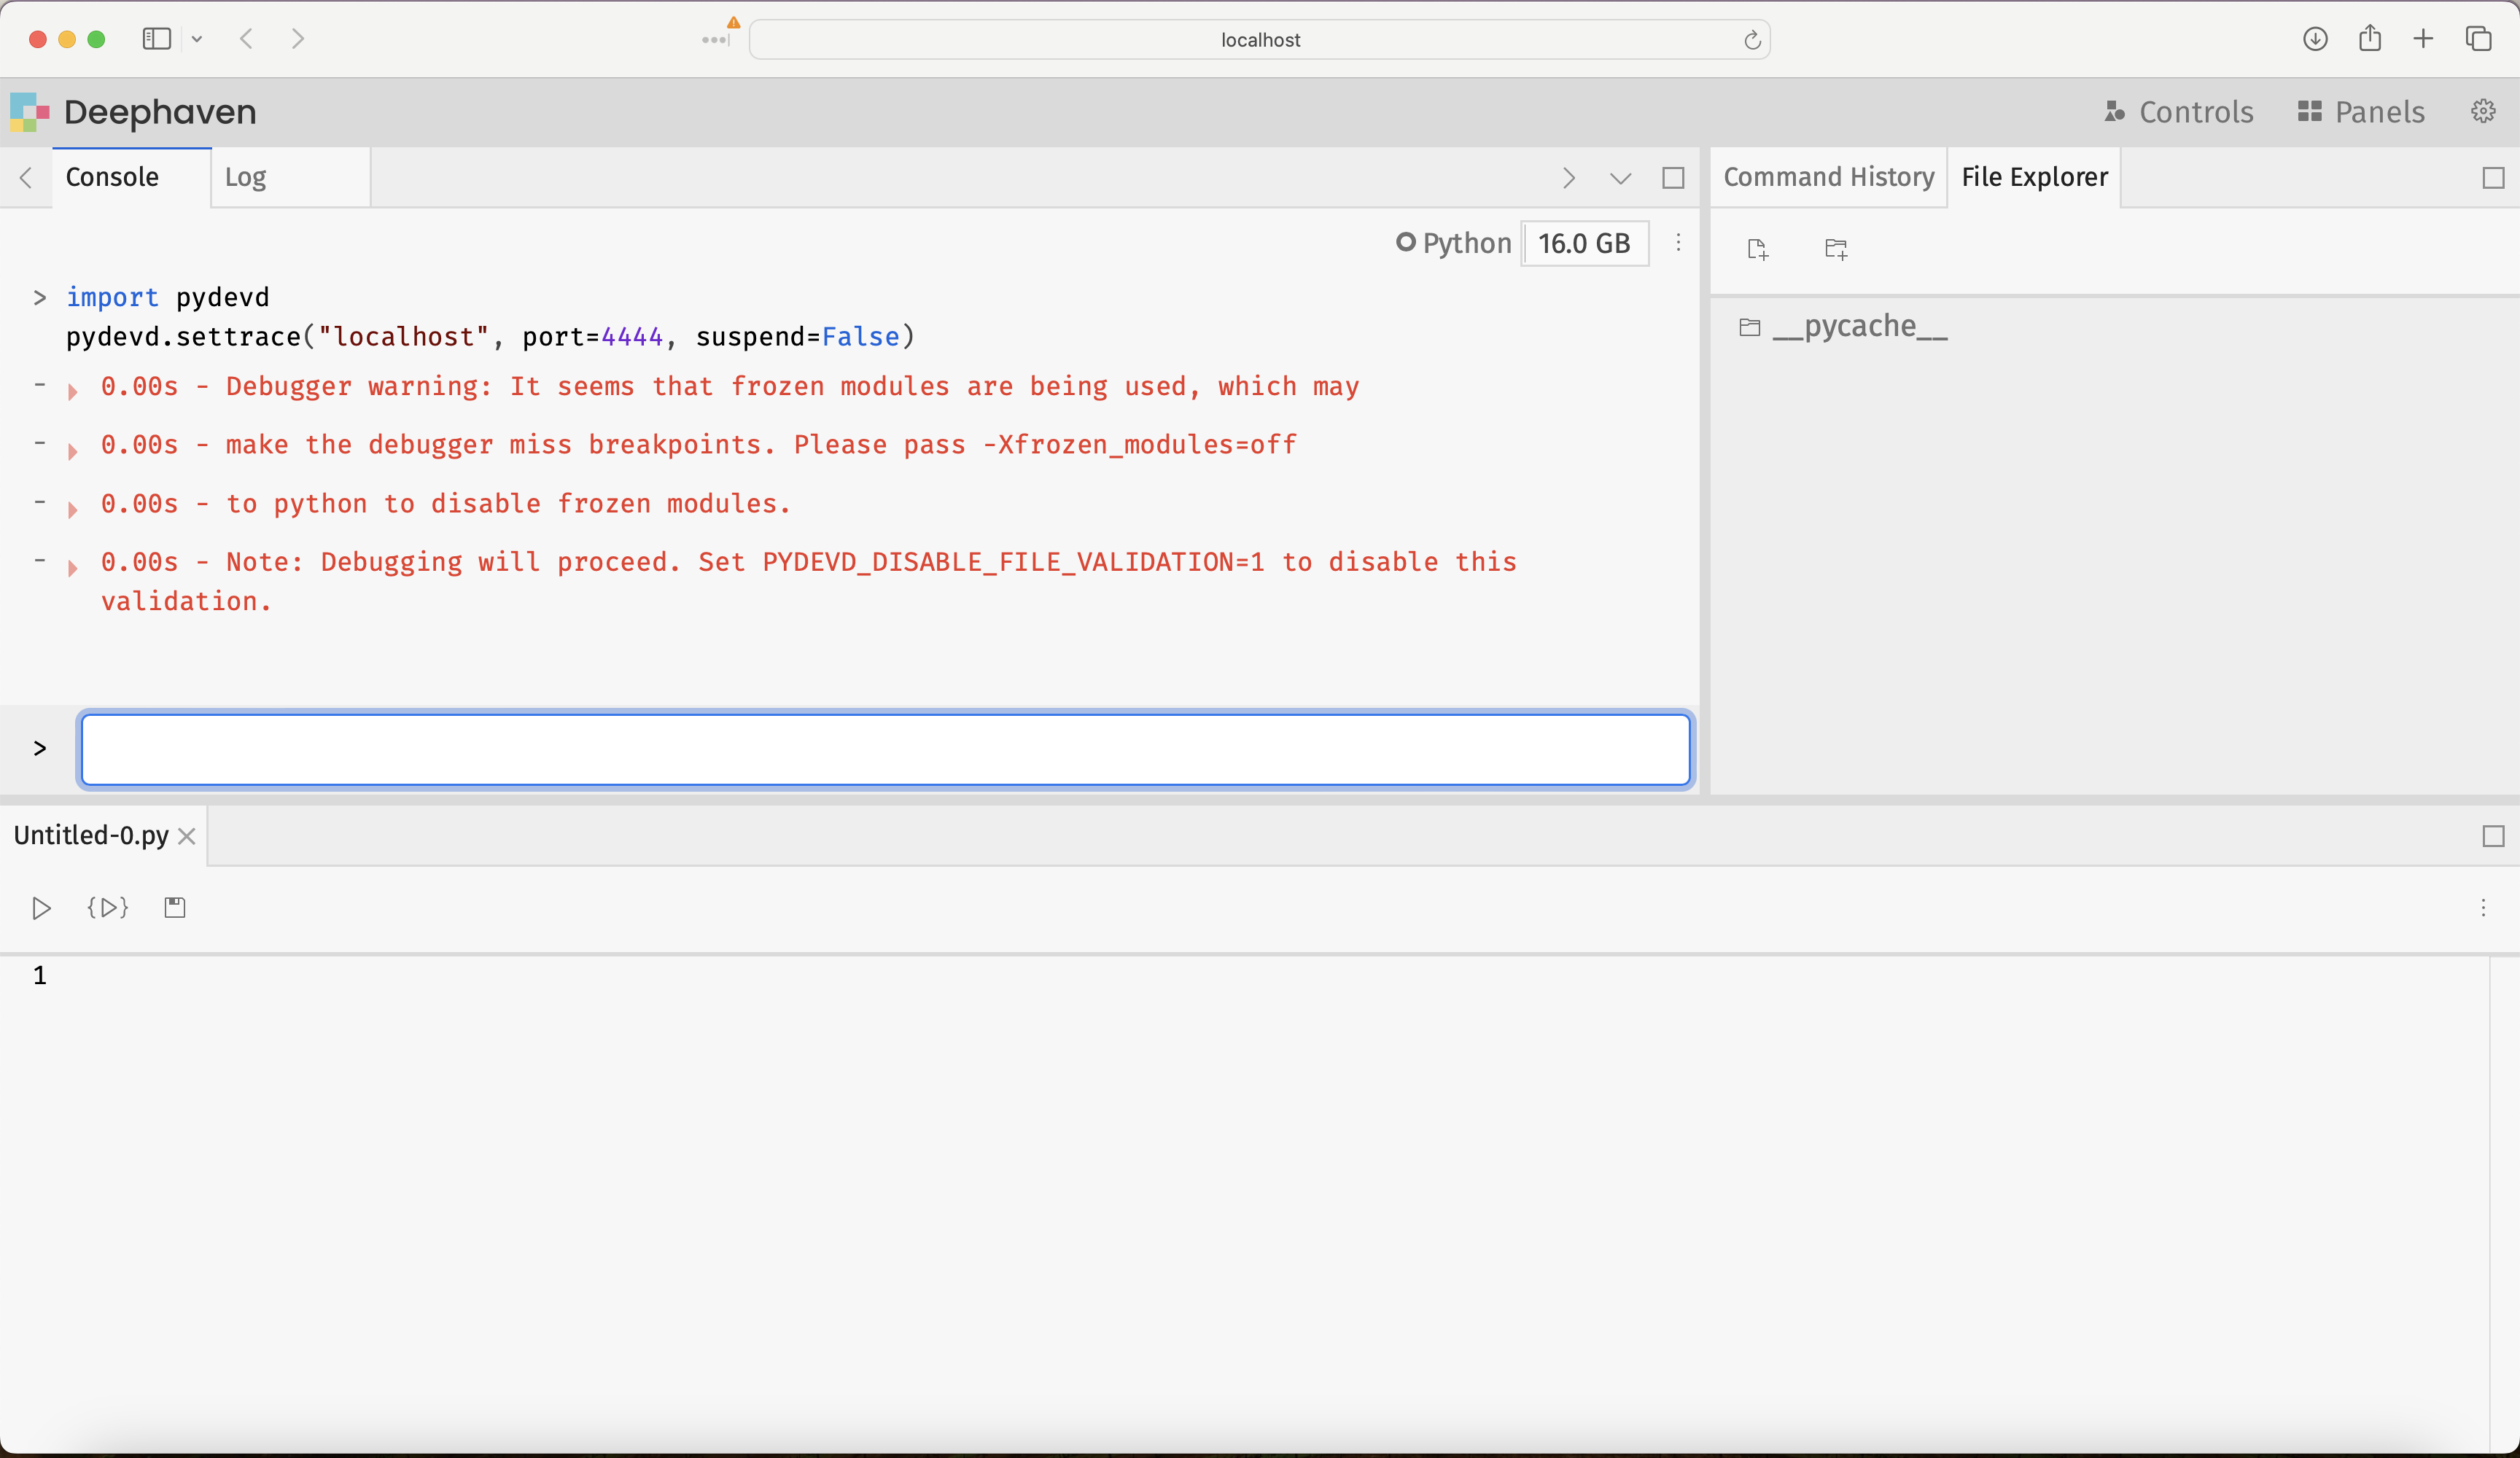
To attach the debugger, navigate to the Deephaven web IDE and execute the following commands in the console. Use the same host name that you set in the debug server configuration in step 3: localhost, or the Windows host's IP address if you use WSL 2 without mirrored networking mode.
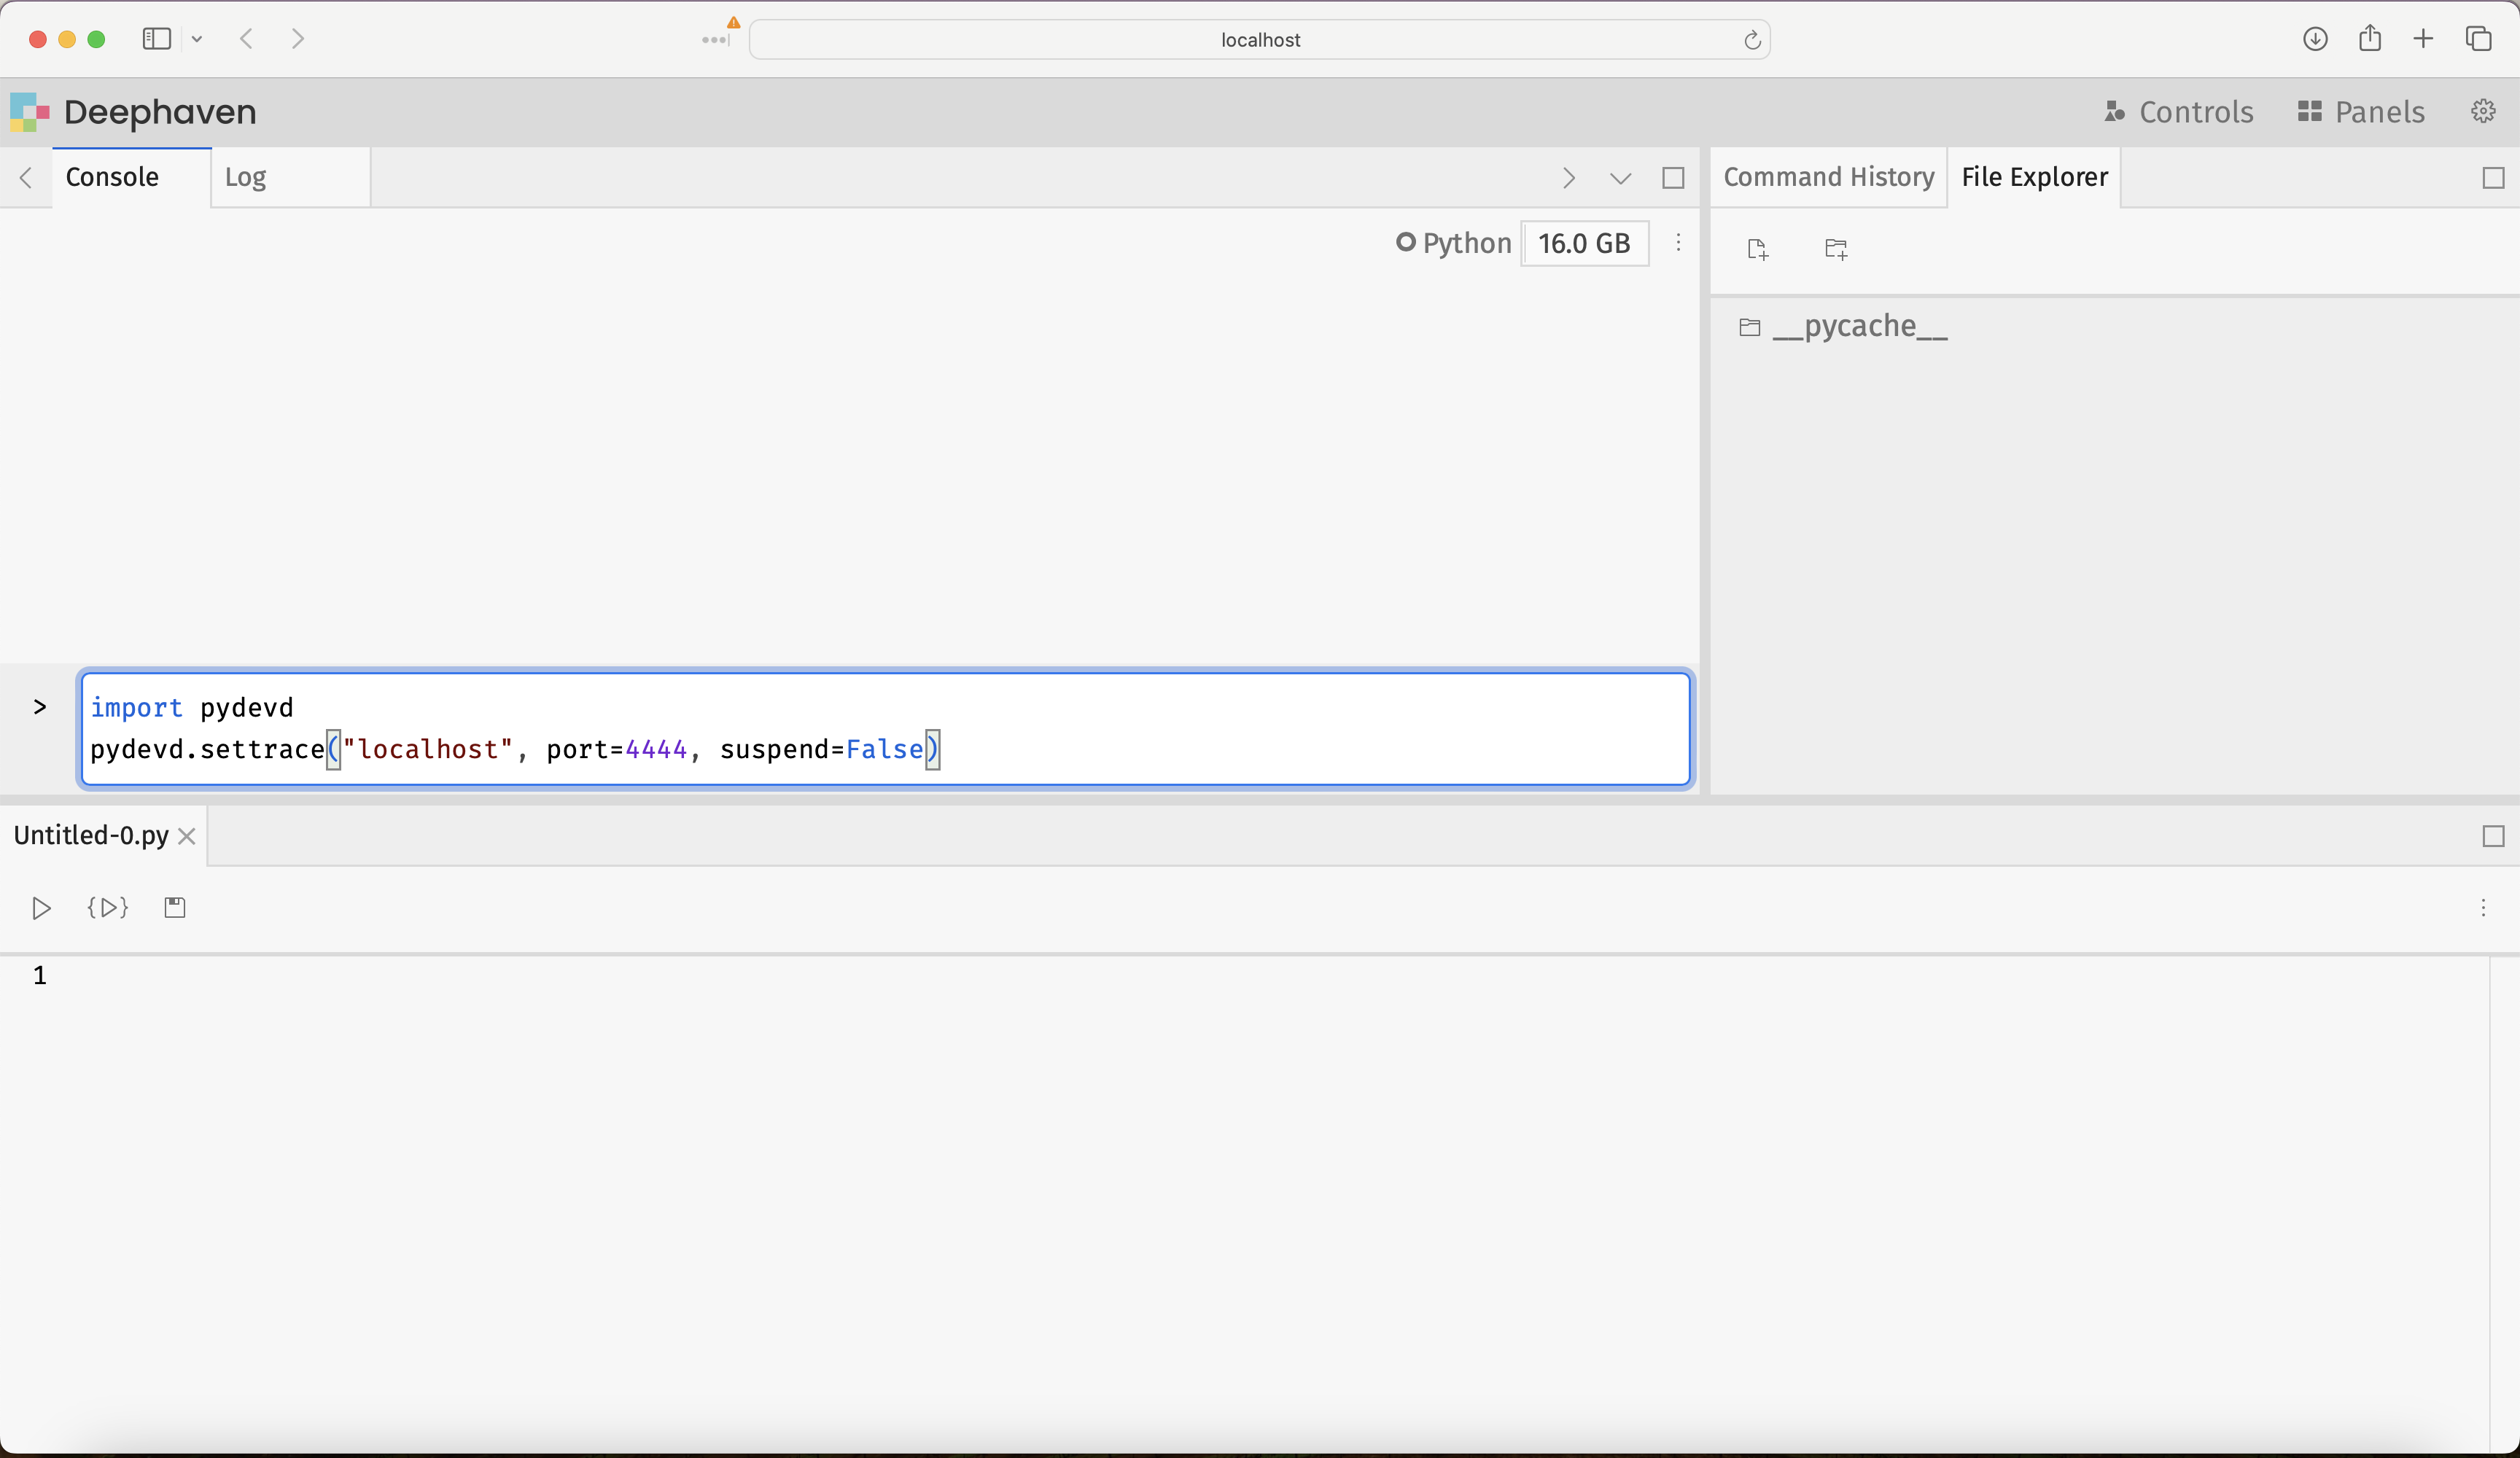
The Deephaven console may print the frozen-modules warning from step 1. That warning doesn't mean the connection failed:
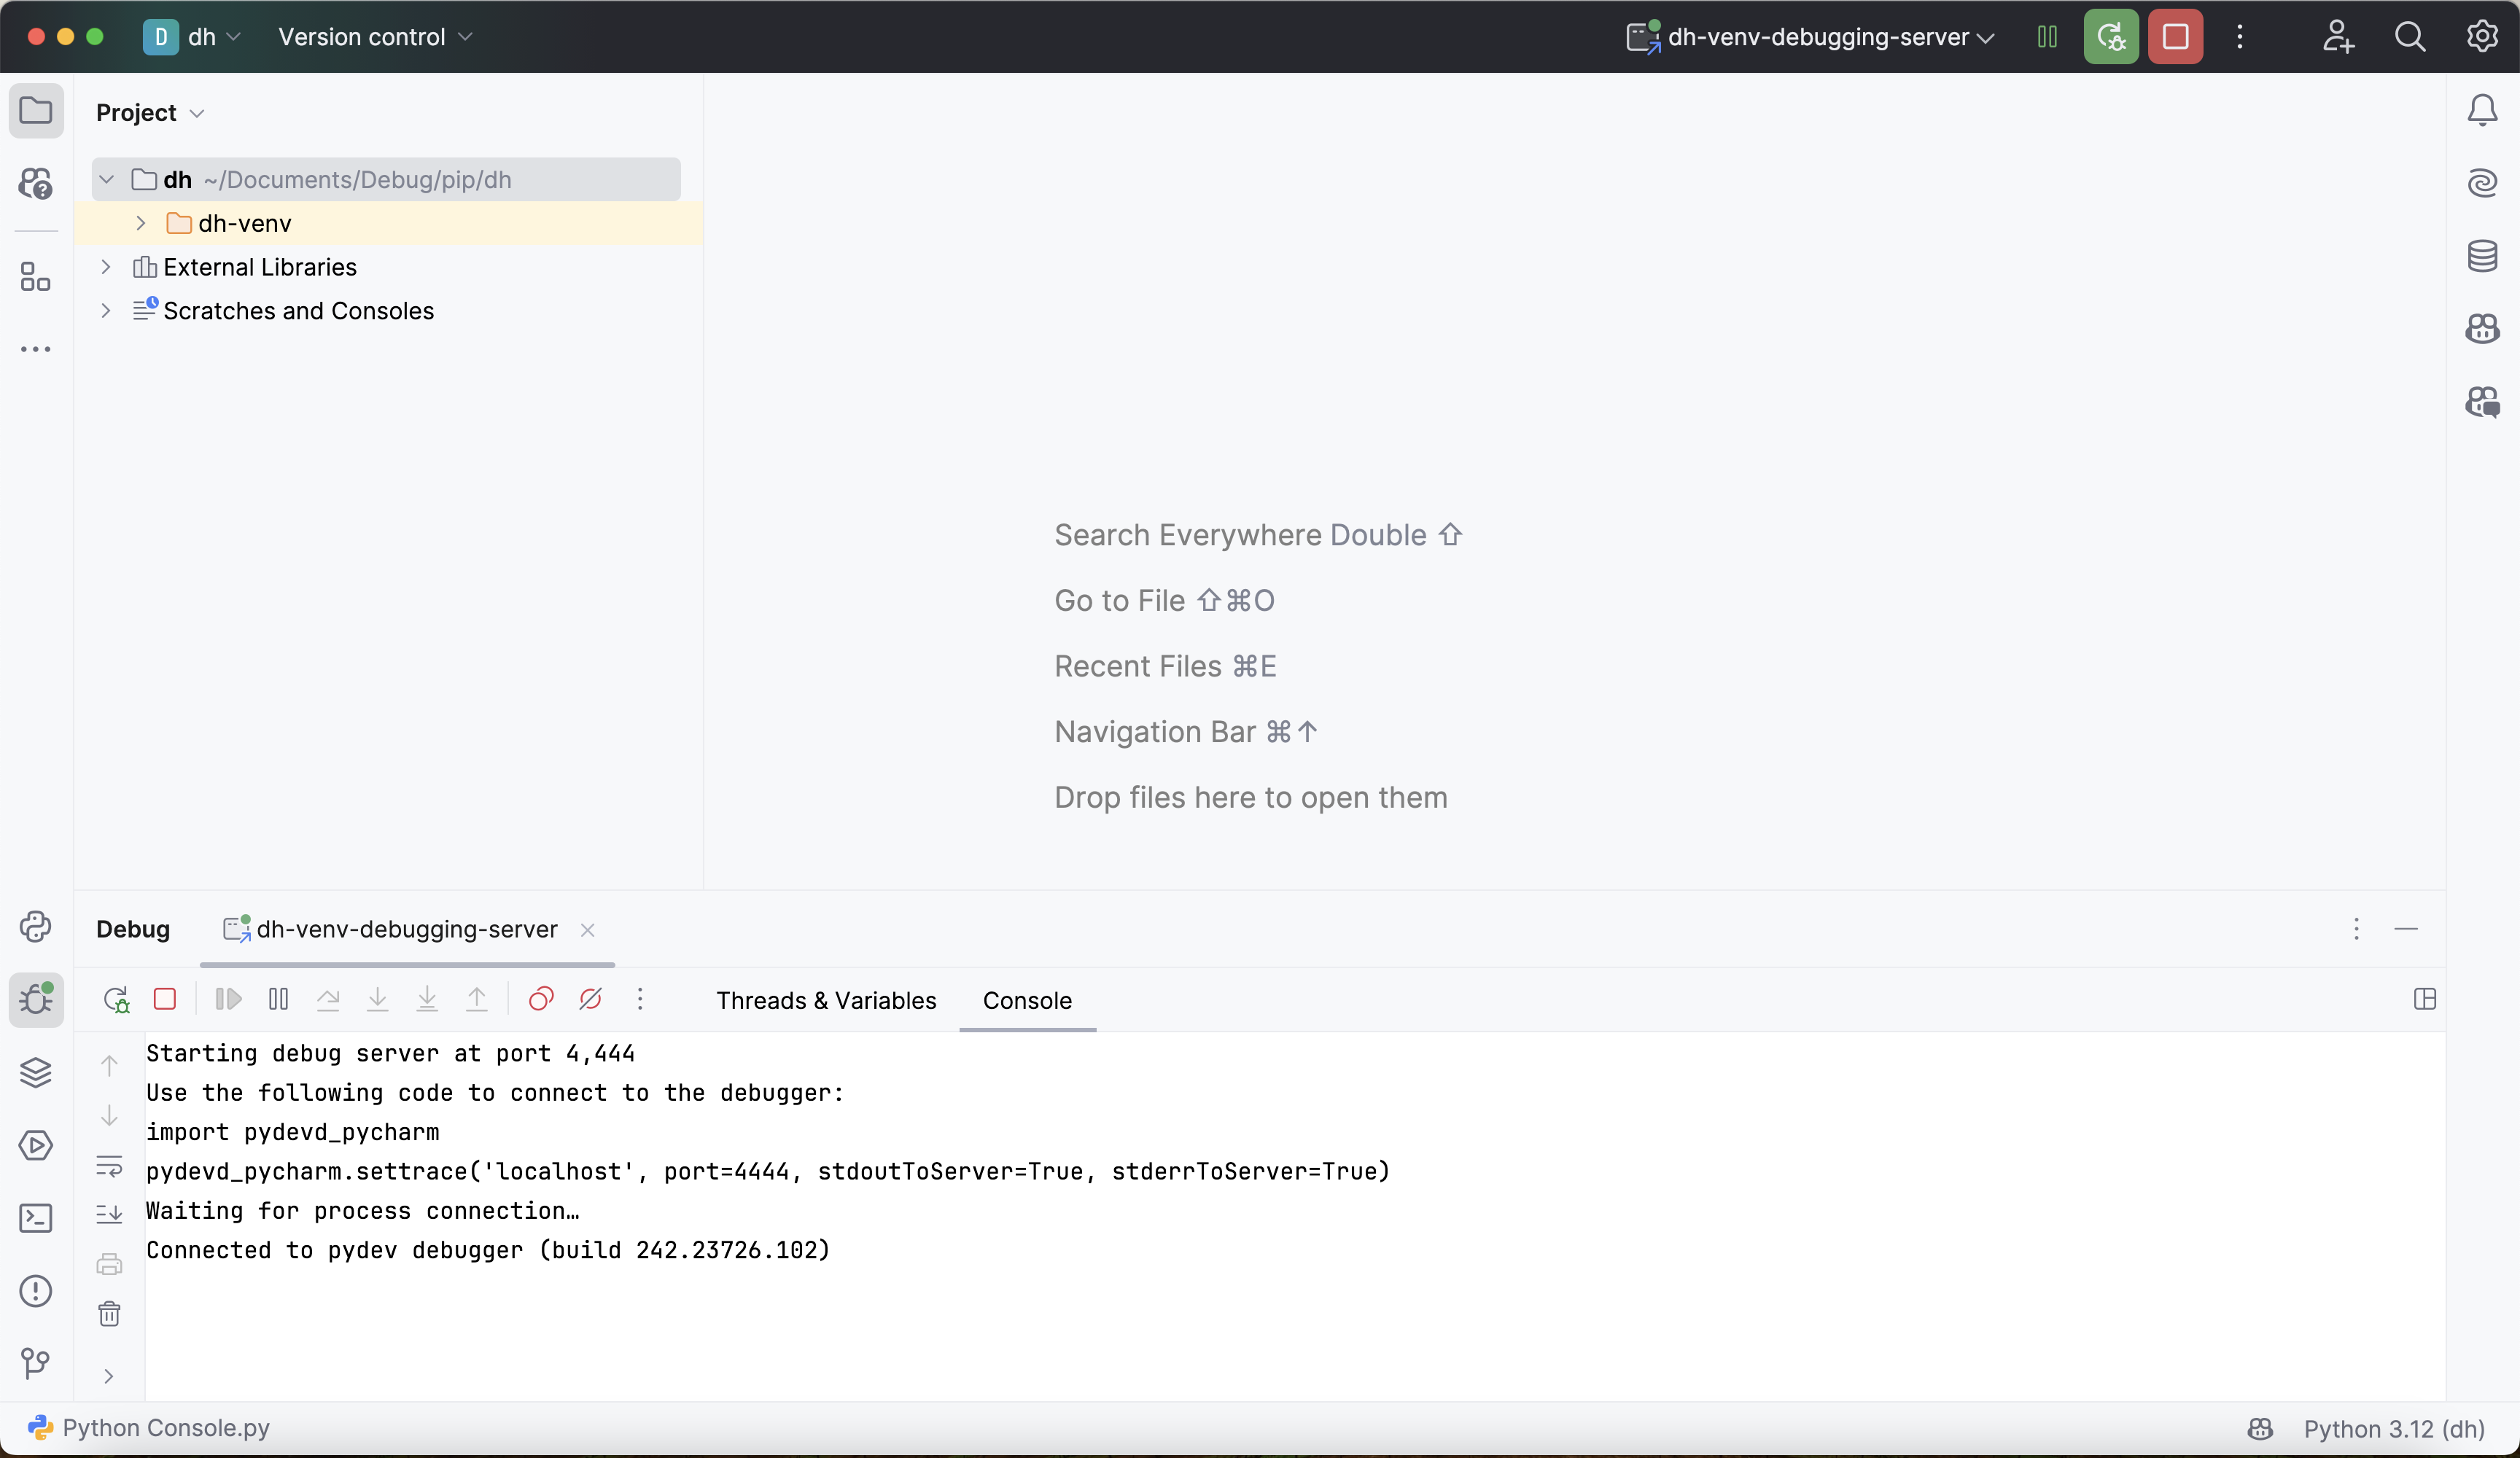
Navigate back to PyCharm and verify that Deephaven is connected. The debug console shows a new line like the following, with a build number that matches your PyCharm version:
The debugger is ready to use!
5. Use the PyCharm debugger
Once connected, you can use the PyCharm debugger in two ways:
- Set breakpoints in PyCharm: Click in the left margin of a Python file that the server imports, such as a Deephaven module in
dh-venv'ssite-packagesor a module in your project directory. - Call
pydevd.settracein code: Execution pauses on the line after the call. Use this for code you type into the Deephaven console, which has no file in PyCharm to put a breakpoint in.
After the initial connection in step 4, you no longer need to pass arguments to settrace. Here's an example using it as a breakpoint:
When the update call runs udf, execution pauses on the line after the pydevd.settrace call. PyCharm then shows the paused frame, with x available to inspect. update calls udf once for each of the 10 rows, so PyCharm pauses 10 times. The console command finishes after you resume the last pause.
From there, the PyCharm debugger's full set of tools is available. You can step through Deephaven's Python source code, set breakpoints to halt execution, and inspect variables and intermediate values deep within function calls. Many resources about PyCharm's debugger are available online, and the JetBrains guide to the PyCharm debug console is a good starting point.
Deephaven has some debugging pitfalls of its own, such as lazy evaluation. See Common problems when debugging Deephaven.
Troubleshooting
Virtual environment not activated
Problem: Commands like deephaven server or imports fail with "command not found" or "module not found" errors.
Solutions:
- Verify the virtual environment is activated: look for
(dh-venv)in your terminal prompt. - Activate the environment:
source dh-venv/bin/activate. On Windows, run this command in WSL 2, which pip-installed Deephaven requires. - Verify Deephaven is installed:
pip list | grep deephaven.
IDE not using correct interpreter
Problem: The debugger fails to start or can't find Deephaven modules.
Solutions:
- Verify the IDE is configured to use the
dh-venvPython interpreter. - In PyCharm, check the interpreter selector in the bottom-right corner.
- In VS Code, check the Python interpreter shown in the status bar, or run > Python: Select Interpreter from the command palette.
- Restart the IDE after changing the interpreter.
Debugger won't connect (remote debugging)
Problem: pydevd.settrace fails with a connection error when you use the remote debugging approach.
Solutions:
- Verify that the PyCharm debug server is running. Its debug console shows "waiting for process connection".
- Check that no firewall blocks the debug server port that you chose in step 3 of remote debugging.
- Ensure the port in
settracematches the PyCharm configuration. - Verify that the Deephaven server was started from the
dh-venvenvironment wherepydevdis installed. - If the debug server is running and the ports match, your
pydevdversion may not match your PyCharm build. Install thepydevd-pycharmversion that PyCharm recommends, as described in Version compatibility issues.
Version compatibility issues
Problem: The debugger behaves unexpectedly, shows errors, or some of its features don't work.
Solutions:
- Use PyCharm 2024 or later. Debugging Deephaven with PyCharm 2023 has known problems.
- Verify that your VS Code version is 1.94 or later.
- For remote debugging, check that your
pydevdversion is compatible with your PyCharm build. Runpip show pydevdto check the installed version. - If the versions don't match, switch to the package that PyCharm recommends:
- Copy the
pip install pydevd-pycharm~=<build>command from the Python Debug Server configuration window, for examplepip install pydevd-pycharm~=242.23726.102, and run it in place ofpip install pydevdfrom step 1. - In the code from steps 4 and 5, change
import pydevdtoimport pydevd_pycharm, andpydevd.settracetopydevd_pycharm.settrace.
- Copy the
Related documentation
- Deephaven's table types
- Install and run Deephaven with pip
- Debug Python code in Deephaven
- Common problems when debugging Deephaven
- Debug Docker-run Deephaven with PyCharm
- Debug built-from-source Deephaven with PyCharm
- Debug an embedded Deephaven server with PyCharm
- Configure and use pre-shared key authentication
- Enable anonymous authentication
empty_tableupdateempty_tablePydocupdatePydoc